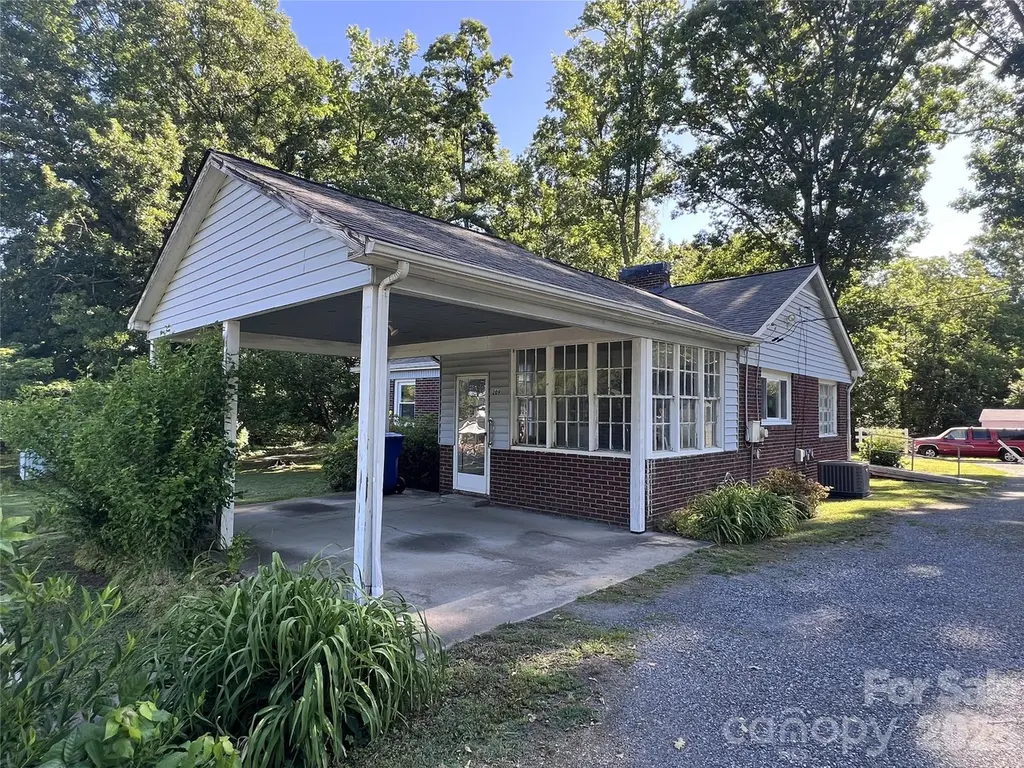
209 S Roxford Rd · Kings Mountain, NC
Flood risk 1/10 · Minimal
- FEMA flood zone
- X (unshaded)
- Chance of flooding over 30 yrs
- 0.0%
- Est. flood insurance / yr
- $507 – $1,088
Fire risk 3/10 · Minor
- Est. fire insurance / yr
- $906 – $1,684
Heat risk 5/10 · Moderate
- Hot days now (above 103°F)
- 7 days/yr
- Hot days in 30 yrs
- 17 days/yr
Wind risk 4/10 · Minor
- Chance of severe wind over 30 yrs
- 11.0%
Air-quality risk 4/10 · Minor
- Unhealthy air days now
- 4 days/yr
- Unhealthy air days in 30 yrs
- 4 days/yr
Risk factors via First Street. Map © Google.
Why this score? — see what drove the D+ grade
The composite is a weighted blend of 9 inputs, each scored 0–100. Each bar is that input's sub-score; the figure is the points it added to the 100-point composite (weight × sub-score).
- ARV discount +15.0/15.0
- Cash flow +14.5/30.0
- DSCR +4.4/10.0
- Schools +4.0/10.0
- 1% rule +3.4/10.0
- Livability +3.2/5.0
- Rent growth +2.5/5.0
- Condition / age +2.5/5.0
- Appreciation +0.0/10.0
$199,999
🖨 Deal sheet (PDF) 📄 Offer letter ✓ Due diligence
Listing remarks
Great investment opportunity located right off Business 74 in Kings Mountain. This home offers a quick commute to schools, grocery stores, and downtown KM. 3 bedroom, 2 bathrooms. With over 1,400 square feet, this property has significant potential. Features include: - Spacious Kitchen: Includes a breakfast area and charming built-ins for extra storage. - Large Living Room: Fills with plenty of natural sunlight. - 3 Bedrooms: Two bedrooms also feature functional built-ins. - Exterior: The home sits on a level . 42-acre lot with ample shade. Please let me know if you would like more information or to schedule a viewing.
Key facts
- Spacious kitchen
- Quick commute
- Large living room
Tags
Property features AI
Finance
- HOA & community: No HOA
Exterior
- Parking: Attached carport with 1 covered space
- Utilities: City water; Public sewer
- Home design: Single-family residence; One story; Site-built construction
- Construction: Brick, vinyl, and wood exterior materials; Crawl space foundation
- Exterior features: Lot is approximately 0.42 acres; Roads are gravel and paved; Publicly maintained road
Interior
- Kitchen: Dishwasher; Electric cooktop; Wall oven; Microwave; Refrigerator
- Bedrooms: Three bedrooms on the main level
- Bathrooms: Two full bathrooms
- Heating & cooling: Forced air heating; Central air conditioning
- Interior features: 7 total rooms; Fireplace; Room levels: main floor
- Laundry & utility: Washer and dryer included; Laundry located in a bathroom
Neighborhood map
What this means for you Summary
Snapshot
- This is a 3-bed/2.0-bath single-family listed at $200k.
Deal economics
- At list price, monthly cash flow is $43 ($519/yr) — positive.
- The deal already cash-flows at list — no discount required.
- To meet the 1% rule (rent ≥ 1% of price), the offer needs to be $167k (16.4% below list).
- Recommended offer: $167k (16.4% below list) — sets the bar for 1% rule.
- Cap rate 6.6% vs local median 3.4% in Kings Mountain — top-decile yield for the area; either an underpriced asset or a hidden risk that comps aren't pricing in. Stress-test before assuming the spread holds.
Location & tenants
- Location reads 63/100 on livability (#404 in NC) — a middle-class / working-renter tenant base. Strengths: cost of living A+, housing A+; Watch: crime F, amenities F, commute F.
- Cleveland County Schools (rural): math 47% / reading 49% proficiency, ranked #76 of 178 in NC (top 43%) — families likely to look elsewhere, expect single-tenant / working-renter base with shorter leases.
- Zoned schools: North Elementary (math 42% / reading 42%, grade F, #633 of 1,410 statewide, top 48%, 263 students, 99% FRL); Kings Mountain Middle (math 43% / reading 57%, grade C, #113 of 475 statewide, top 25%, 712 students, 67% FRL); Kings Mountain High (math 68% / reading 65%, grade B, #150 of 535 statewide, top 28%, 1,236 students, 56% FRL).
- Market conditions: 193 active listings in the ZIP; 461 units permitted in Cleveland County in 2024 (38 in 5+ unit buildings).
- This rent runs 32% of the median local income ($62k/yr) — at the standard rent-burdened threshold; future hikes will face affordability resistance.
Forward outlook
- Local home prices are declining (-3.0%/yr); year-one equity from $1k of loan paydown is wiped out by about $6k of value loss. Plan a longer hold.
- Cleveland County population projected at -15% by 2050 — secular population decline; favor cash flow + early exit over multi-decade hold.
Negotiation context
- It's been on market 37 days — a 3% lower offer ($194k) is reasonable based on typical stale-listing flexibility.
Risks & watch-outs
- Watch-outs: built in 1953 — expect roof / HVAC / electrical / plumbing capex.
- Climate carrying-cost: extreme-heat days projected 7→17/yr by 2055 (HVAC capex compounding) — expect insurance premiums to compound above CPI over the hold.
Questions for the listing agent
- It's been on market 37 days. Have you received any prior offers? Is the seller open to a 16% concession, seller financing, or rate buy-down credit?
- Built in 1953 — when were the roof, HVAC, electrical panel, plumbing, and water heater last replaced?
- Is there a deadline driving the sale (1031 exchange, divorce, estate, relocation)? That informs how much negotiation room exists.
- Schools are D-rated, which usually means shorter tenancies and higher turnover. Who's the typical renter profile here, and what's been the actual vacancy rate?
- Crime grade is F in this area — have there been break-ins, vandalism, or insurance claims at this property in the last 3 years? What carrier currently insures it and at what premium?
- The area grade is low — what's the realistic commute time and amenity access for the typical tenant pool here? Any planned neighborhood developments (good or bad) we should know about?
- What's the average days-on-market for RENTAL listings here right now (not sales)? A rising rental-DOM trend means longer vacancies and softer asking-rent achievability than the comps imply.
- What's the recent tenant-quality profile in this submarket — average credit score on applications, eviction rate, late-payment / NSF rate, and stable-employment percentage? A property-management company in the area should have these aggregated.
- How much new for-sale + rental construction is in the pipeline within 1–3 miles? Heavy new supply typically softens prices + rents 12–24 months out; constrained supply supports both.
Investment metrics
- 1% rule
- 0.84% ✗
- Cap rate
- 6.55%
- Cash-on-cash
- 0.93%
- DSCR
- 1.04
- GRM
- 10.0
CMA / ARV
- ARV (on-the-fly)
- $350,811
- Comps found
- 12
Show comp detail 12 sales within ~0.75 mi
| Address | Dist | Beds/Ba | Sqft | Sold | Price | $/sf | Match |
|---|---|---|---|---|---|---|---|
| 1305 Merrimont Ave | 0.40mi | 3/2.0 | 2,051 (+7%) | 2mo | $499,000 | $243 | 68 |
| 304 Ware St | 0.58mi | 3/2.5 | 1,968 (+3%) | 2mo | $300,000 | $152 | 65 |
| 704 Marion St | 0.66mi | 3/2.0 | 1,928 (+1%) | 4mo | $320,000 | $166 | 64 |
| 230 Colton Ct | 0.37mi | 4/2.0 (+1) | 1,764 (-8%) | 0mo | $323,000 | $183 | 64 |
| 412 Scotland Dr | 0.45mi | 3/2.0 | 1,710 (-11%) | 1mo | $327,400 | $191 | 60 |
| 231 Colton Ct | 0.37mi | 3/2.5 | 2,175 (+14%) | 0mo | $350,000 | $161 | 58 |
| 442 Phifer Rd | 0.16mi | 4/3.0 (+1) | 2,204 (+15%) | 2mo | $297,997 | $135 | 57 |
| 424 Fulton Dr | 0.35mi | 3/2.5 | 1,718 (-10%) | 8mo | $350,000 | $204 | 57 |
| 402 Scotland Dr | 0.52mi | 3/2.0 | 1,715 (-10%) | 8mo | $310,000 | $181 | 52 |
| 438 Phifer Rd | 0.20mi | 4/3.0 (+1) | 2,204 (+15%) | 10mo | $320,000 | $145 | 48 |
| 503 Deerfield Dr | 0.67mi | 3/2.0 | 2,187 (+14%) | 9mo | $440,000 | $201 | 37 |
| 304 Wintergreen Ct | 0.56mi | 4/3.0 (+1) | 2,201 (+15%) | 9mo | $495,000 | $225 | 32 |
Match score weights: distance 35% · size 25% · config 20% · recency 20%. Top-matched comps best support the ARV.
Projected returns pro-forma
-3.0% appreciation · 3.0% rent growth · sell at horizon
- IRR
- -14.8%
- Equity multiple
- 0.47×
- Total profit
- $-29,693
- Equity at exit
- $29,821
- IRR
- -6.2%
- Equity multiple
- 0.60×
- Total profit
- $-22,469
- Equity at exit
- $17,292
Cash invested: $56,000 (down + closing). Projections, not guarantees.
Landlord ↔ Tenant lean methodology
- Overall (STATE)
- 85 Strongly Landlord-Friendly
- State North Carolina
- 85 Strongly Landlord-Friendly · R+3
- County
- — inherits STATE
- City
- — inherits STATE
ZIP-level market 28086
- Home prices YoY
- -28.6%
- Active inventory
- 193
- Price-to-rent
- 10.0×
Monthly cashflow live
- Estimated rent
- $1,672 medium interval (Pro) →
- Mortgage (P&I)
- −$1,049
- Tax from tax record
- −$146 /mo · $1,747/yr
- Insurance
- −$83
- HOA
- −$0
- Vacancy / Maint / Mgmt
- −$351
- Net cashflow
- $43
Break-even live
Sensitivity live
| Price | -10% $156 | -5% $100 | +0% $43 | +5% $-13 | +10% $-70 |
|---|---|---|---|---|---|
| Rent | -10% $-89 | -5% $-23 | +0% $43 | +5% $109 | +10% $175 |
| Rate | -1.0pp $144 | -0.5pp $94 | base $43 | +0.5pp $-9 | +1.0pp $-61 |
UW: 25.0% down · 7.5% · 30yr · 1.5% tax · 5.0% vac · 8.0% maint · 8.0% mgmt
Financing live
Cash to close
- Down payment
- $50,000
- Closing costs
- $6,000
- Reserves months
- —
- Total cash needed
- —
Loan-product check · same deal, 3 products live
Conventional
25% down · 7.5% · 30yr
- Down + closing
- —
- Monthly P&I
- —
- Monthly cashflow
- —
- DSCR
- —
- Eligible?
- —
Personal DTI + credit; lowest rate.
DSCR
20% down · 8.5% · 30yr
- Down + closing
- —
- Monthly P&I
- —
- Monthly cashflow
- —
- DSCR
- —
- Eligible?
- —
No personal income docs; deal must DSCR.
Hard money
10% down · 12.0% · 12mo
- Down + closing
- —
- Monthly P&I
- —
- Monthly cashflow
- —
- DSCR
- —
- Eligible?
- —
Short-term bridge; refi at stabilization.
Listing history 19 events
-
2026-06-22days on market $199,999 Active 37 DOM
-
2026-06-19days on market $199,999 Active 35 DOM
-
2026-06-18days on market $199,999 Active 34 DOM
-
2026-06-17days on market $199,999 Active 33 DOM
-
2026-06-16days on market $199,999 Active 32 DOM
-
2026-06-15days on market $199,999 Active 31 DOM
-
2026-06-14days on market $199,999 Active 29 DOM
-
2026-06-13days on market $199,999 Active 28 DOM
-
2026-06-10days on market $199,999 Active 26 DOM
-
2026-06-09days on market $199,999 Active 25 DOM
-
2026-06-08days on market $199,999 Active 24 DOM
-
2026-06-07days on market $199,999 Active 23 DOM
-
2026-06-05days on market $199,999 Active 20 DOM
-
2026-06-03days on market $199,999 Active 19 DOM
-
2026-06-02days on market $199,999 Active 18 DOM
-
2026-06-01pricedays on market $199,999 Active 17 DOM
-
2026-05-31days on market $215,000 Active 16 DOM
-
2026-05-30days on market $215,000 Active 15 DOM
-
2026-05-15$215,000 Active
ⓘ Source: listings_history table (triggers on properties + properties_extension) + one-shot
backfill from property_details.listing_events for pre-trigger history.
Tax reassessment forecast NC · Resets to sale price
- Current annual tax
- $1,747 · $146/mo
- Projected year-2 tax
- $1,747 · $146/mo
- Expected delta
- $0/yr ($0/mo · 0.0%)
ⓘ Screening estimate from a state-policy table — verify with the county assessor before closing.
Climate risk First Street
- Flood 1/10 Low FEMA zone X (unshaded) · 0% chance over 30 yrs
- Wildfire 3/10 Moderate
- Heat 5/10 Major 7 d/yr ≥103°F today · 17 d/yr by 30 yrs out
- Wind 4/10 Moderate 11% chance of damaging wind over 30 yrs
- Air quality 4/10 Moderate 4 unhealthy d/yr today · 4 by 30 yrs out
Nearby sold comps map
Loading sold comps map…
Walkable amenities ~0.75 mi
Loading nearby amenities…
Taxation est. · year 1
- Rental income
- $20,065
- − Mortgage interest
- −$11,203
- − Property taxes
- −$1,747
- − Insurance
- −$1,000
- − Repairs & maintenance
- −$1,605
- − Management
- −$1,605
- − Depreciation
- −$5,818
- Taxable loss
- −$2,913
- Est. tax savings @ 24.0%
- +$699
- After-tax cash flow
- $1,218/yr
For passive investors: Depreciation is non-cash, so a rental often shows a tax loss while cash-flowing — sheltering income. Rental losses are passive: they offset passive income freely, and up to $25,000/yr can offset ordinary (W-2) income if you actively participate and your MAGI is under $100k (phasing out to $0 by $150k); unused losses carry forward. On sale, claimed depreciation is recaptured at up to 25%, and gains may owe capital-gains tax (a 1031 exchange can defer both). Figures are a year-1 estimate at your 24.0% rate — not tax advice; consult a CPA.
Schools (NCES district)
- District
- Cleveland County Schools
- NCES district ID
- 3700900
- Math proficiency
- 47% ▬ 0.00%
- Reading proficiency
- 49% ▲ 4.00%
- Median HH income
- $38,501
- Composite
- 40.03/100
- National rank
- #3823
- State rank
- #76 of 178 in NC
Livability — Kings Mountain
- Score
- 63/100
- State rank
- #404
- US rank
- #15377
Category grades
Schools grade is shown separately in the Schools card above.
Census & demographics
- Census place
- Kings Mountain, NC
- County
- Cleveland County · 83,736 people
- City population
- 29,460
- Metro
- Shelby, NC
- Population (ZIP)
- 29,460
- Household income
- $62,414
- Rent vs Own
- Severe rent burden
- 726.0
Population outlook (Cleveland County) Hauer SSP2
- Today (2025)
- 93,671 people
- By 2030
- 91,157 · -2.7%
- By 2040
- 85,519 · -8.7%
- By 2050
- 79,708 · -14.9%
- By 2075
- 68,317 · -27.1%
- By 2100
- 57,145 · -39.0%
Race, ethnicity, and origin ACS 2023
- Neighborhood character
- Predominantly White (74%)
- Race & ethnicity
- White 74% Black 16% Two or more races 4% Hispanic / Latino 4% Asian 2%
- Common ancestry
- Slovak 3% Italian 2% Serbian 2%
- Foreign-born
- 5% · Canada
- Languages at home
- 93% English-only · Spanish 4% Other Asian/Pacific 2%
Political lean MEDSL · Cleveland
- 2024 margin
- Solid R (+35.0) · D 32.2% · R 67.2%
- 2008→2024 swing
- -15.1pp toward R · 2008: -19.9pp · 2024: -35.0pp
- All cycles
- 2024: R+35.0 2020: R+32.8 2016: R+30.6 2012: R+20.5 2008: R+19.9
Not yet ingested
- Civics
- —
Market trends
- HPI YoY
- ▼ -99.17%
- Current HPI
- 248.0613
- Rent YoY
- —
- Metro
- Shelby, NC
- State GDP YoY
- ▲ 3.28%
- F500 in state
- 26
Industry mix (Fortune 500 HQ in NC)
| Industry | F500 HQs | Revenue |
|---|---|---|
| Financial Services | 2 | $213B |
|
||
| Retail | 2 | $95B |
|
||
| Industrial Conglomerate | 1 | $38B |
|
||
| Metals / Steel | 1 | $35B |
|
||
| Utilities | 1 | $30B |
|
||
| Industrial Machinery | 1 | $19B |
|
||
Price history
1 event — show timeline
- 2026-05-15 Listed $215,000 CANOPYMLS as Distributed by MLS Grid
Property tax history
+7.9%/yrLatest (2025): $1,747 · +65.9% YoY. Source: county tax records.
Cash-flow waterfall
monthlySold comps — $/sqft
last 12 mo · ≤1 miLoading sold comps…