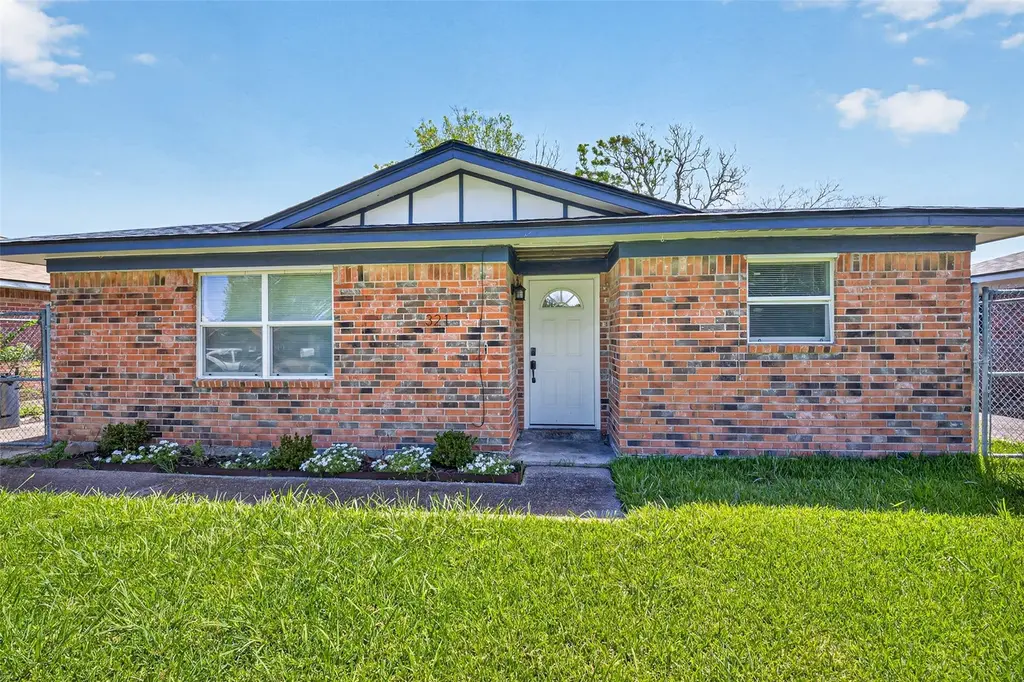
321 S Brownell St · La Porte, TX
Flood risk 7/10 · Major
- FEMA flood zone
- X (shaded)
- Chance of flooding over 30 yrs
- 0.74%
- Est. flood insurance / yr
- $507 – $1,088
Fire risk 1/10 · Minimal
- Est. fire insurance / yr
- $1,222 – $2,270
Heat risk 10/10 · Severe
- Hot days now (above 108°F)
- 7 days/yr
- Hot days in 30 yrs
- 25 days/yr
Wind risk 9/10 · Severe
- Chance of severe wind over 30 yrs
- 99.0%
Air-quality risk 2/10 · Minimal
- Unhealthy air days now
- 1 days/yr
- Unhealthy air days in 30 yrs
- 2 days/yr
Risk factors via First Street. Map © Google.
Why this score? — see what drove the D grade
The composite is a weighted blend of 9 inputs, each scored 0–100. Each bar is that input's sub-score; the figure is the points it added to the 100-point composite (weight × sub-score).
- Cash flow +14.9/30.0
- ARV discount +7.9/15.0
- DSCR +4.6/10.0
- 1% rule +4.3/10.0
- Schools +3.9/10.0
- Livability +3.5/5.0
- Rent growth +3.2/5.0
- Condition / age +2.5/5.0
- Appreciation +0.0/10.0
$197,900
🖨 Deal sheet 📄 Offer letter ✓ Due diligence
Listing remarks
* * OPEN HOUSE on Saturday, 06/06/2026 from 12-2pm * * WALKING DISTANCE TO FISHING PIER! This fully renovated LaPorte stunner is a rare find. Enjoy a new home with an updated kitchen! The primary bedroom features a convenient, updated half-bath, while the secondary bedrooms share a beautifully redesigned full bath with custom tile work. Head out to the back to enjoy a spacious backyard—perfect for weekend BBQs and outdoor activities. Excellent location near La Porte schools, parks, and Sylvan Beach. Schedule your tour today!
Key facts
- Spacious backyard
- Updated half bath
- Redesigned full bath
Tags
Property features AI
Finance
- Financial info: Lease not considered
- HOA & community: Community pool
Exterior
- Parking: Detached carport; 1-car carport
- Security: Owned security system; Smoke detectors
- Utilities: Public water; Public sewer; Central heating (gas); Central electric air conditioning
- Home design: Residential property; Faces west; Built in 1971; Slab foundation
- Construction: Brick construction; Composition roof
- Exterior features: Fully fenced yard; Back yard fencing; Concrete road access; Other lot features
Interior
- Kitchen: Dishwasher; Gas cooktop; Gas oven; Refrigerator
- Bedrooms: 5 total rooms (includes bedrooms and living spaces)
- Bathrooms: 1 full bathroom; 1 half bathroom
- Interior features: Ceiling fans; Kitchen/dining combo; Programmable thermostat; Low emissivity windows; Ventilation for improved indoor air quality; ENERGY STAR qualified appliances
- Laundry & utility: Washer hookup; Gas dryer hookup; Dryer included
Neighborhood map
What this means for you Summary
Snapshot
- This is a 3-bed/1.5-bath single-family listed at $198k.
Deal economics
- At list price, monthly cash flow is $-9 ($-103/yr) — negative.
- To cash-flow at today's rent, offer at most $196k (0.8% below list).
- To meet the 1% rule (rent ≥ 1% of price), the offer needs to be $184k (7.2% below list).
- Recommended offer: $184k (7.2% below list) — sets the bar for 1% rule.
- Cap rate 6.6% vs local median 3.4% in La Porte — top-decile yield for the area; either an underpriced asset or a hidden risk that comps aren't pricing in. Stress-test before assuming the spread holds.
Location & tenants
- Location reads 70/100 on livability (#360 in TX) — a middle-class / working-renter tenant base. Strengths: cost of living A+, housing A+, crime A-; Watch: amenities F, commute F, health & safety F.
- La Porte ISD (suburban): math 41% / reading 44% proficiency, ranked #260 of 826 in TX (top 32%) — families likely to look elsewhere, expect single-tenant / working-renter base with shorter leases.
- Zoned schools: La Porte J H (math 41% / reading 43%, grade D-, #572 of 1,662 statewide, top 36%, 527 students, 65% FRL); La Porte H S (math 24% / reading 46%, grade F, #954 of 1,632 statewide, top 59%, 2,069 students, 51% FRL).
- Market conditions: Rents rising (+2.8%/yr); 337 active listings in the ZIP; 4 comparable units currently listed for rent nearby; rentals at typical pace (median 25d on market — plan ~3-4 weeks tenant-placement turnaround); solid renter incomes; 29,883 units permitted in Harris County in 2024 (8,621 in 5+ unit buildings).
Forward outlook
- Local home prices are declining (-3.0%/yr); year-one equity from $1k of loan paydown is wiped out by about $6k of value loss. Plan a longer hold.
- Harris County population projected at +47% by 2050 — long-run rental-demand tailwind backs the buy-and-hold thesis.
Negotiation context
- Only 14 days on market — expect competitive offers; lowballing is unlikely to land.
Risks & watch-outs
- Watch-outs: flood insurance adds $66/mo.
- Climate carrying-cost: major flood risk; severe wind risk, 99% chance of damaging wind over 30y; extreme-heat days projected 7→25/yr by 2055 (HVAC capex compounding) — expect insurance premiums to compound above CPI over the hold.
Questions for the listing agent
- What do current leases actually rent for vs. the listed asking? Can we see a recent rent roll and the last 12 months of T-12 income?
- Built in 1971 — when were the roof, HVAC, electrical panel, plumbing, and water heater last replaced?
- What's the actual annual flood-insurance premium (NFIP or private), and is the property in a SFHA with mandatory coverage?
- Is there a deadline driving the sale (1031 exchange, divorce, estate, relocation)? That informs how much negotiation room exists.
- Schools are D-rated, which usually means shorter tenancies and higher turnover. Who's the typical renter profile here, and what's been the actual vacancy rate?
- The area grade is low — what's the realistic commute time and amenity access for the typical tenant pool here? Any planned neighborhood developments (good or bad) we should know about?
- What's the average days-on-market for RENTAL listings here right now (not sales)? A rising rental-DOM trend means longer vacancies and softer asking-rent achievability than the comps imply.
- What's the recent tenant-quality profile in this submarket — average credit score on applications, eviction rate, late-payment / NSF rate, and stable-employment percentage? A property-management company in the area should have these aggregated.
- How much new for-sale + rental construction is in the pipeline within 1–3 miles? Heavy new supply typically softens prices + rents 12–24 months out; constrained supply supports both.
Investment metrics
- 1% rule
- 0.93% ✗
- Cap rate
- 6.64%
- Cash-on-cash
- 1.25%
- DSCR
- 1.06
- GRM
- 9.0
CMA / ARV
- ARV (on-the-fly)
- $199,584
- Comps found
- 12
Show comp detail 12 sales within ~0.75 mi
| Address | Dist | Beds/Ba | Sqft | Sold | Price | $/sf | Match |
|---|---|---|---|---|---|---|---|
| 309 S Brownell St | 0.03mi | 3/2.0 | 1,358 (+5%) | 4mo | $209,500 | $154 | 86 |
| 510 S Ohio St | 0.16mi | 3/2.0 | 1,310 (+1%) | 13mo | $249,000 | $190 | 78 |
| 125 S Nugent St | 0.19mi | 3/1.0 | 1,237 (-5%) | 11mo | $128,500 | $104 | 73 |
| 622 S Idaho St | 0.29mi | 3/1.0 | 1,200 (-7%) | 4mo | $184,900 | $154 | 68 |
| 301 S Virginia St | 0.39mi | 2/1.0 (-1) | 1,273 (-2%) | 5mo | $194,900 | $153 | 68 |
| 305 S Carroll St | 0.20mi | 2/1.5 (-1) | 1,167 (-10%) | 4mo | $155,000 | $133 | 66 |
| 601 S Carroll St | 0.27mi | 3/2.0 | 1,403 (+8%) | 11mo | $259,900 | $185 | 62 |
| 424 S Broadway St | 0.64mi | 3/2.0 | 1,337 (+3%) | 4mo | $159,000 | $119 | 59 |
| 920 Oak Grove St | 0.42mi | 2/2.0 (-1) | 1,200 (-7%) | 2mo | $239,000 | $199 | 59 |
| 503 S Kansas St | 0.28mi | 4/2.0 (+1) | 1,144 (-12%) | 2mo | $159,990 | $140 | 59 |
| 801 S Idaho St | 0.37mi | 3/2.0 | 1,152 (-11%) | 11mo | $220,000 | $191 | 53 |
| 214 N 2nd St | 0.66mi | 3/2.0 | 1,248 (-4%) | 12mo | $174,900 | $140 | 51 |
Match score weights: distance 35% · size 25% · config 20% · recency 20%. Top-matched comps best support the ARV.
Projected returns pro-forma
-3.0% appreciation · 2.81% rent growth · sell at horizon
- IRR
- -16.8%
- Equity multiple
- 0.41×
- Total profit
- $-32,881
- Equity at exit
- $29,508
- IRR
- -8.9%
- Equity multiple
- 0.45×
- Total profit
- $-30,427
- Equity at exit
- $17,111
Cash invested: $55,412 (down + closing). Projections, not guarantees.
Landlord ↔ Tenant lean methodology
- Overall (STATE)
- 87 Strongly Landlord-Friendly
- State Texas
- 87 Strongly Landlord-Friendly · R+5
- County
- — inherits STATE
- City
- — inherits STATE
ZIP-level market 77571
- Home prices YoY
- -28.9%
- Rents YoY
- 2.8%
- Active inventory
- 337
- Price-to-rent
- 9.0×
Monthly cashflow live
- Estimated rent
- $1,836 medium interval (Pro) →
- Mortgage (P&I)
- −$1,038
- Tax from tax record
- −$272 /mo · $3,264/yr
- Insurance
- −$82
- Flood insurance flood zone
- −$66 /mo · $798/yr
- HOA
- −$0
- Vacancy / Maint / Mgmt
- −$385
- Net cashflow
- $-9
Break-even live
UW: 25.0% down · 7.5% · 30yr · 1.5% tax · 5.0% vac · 8.0% maint · 8.0% mgmt
Financing live
Cash to close
- Down payment
- $49,475
- Closing costs
- $5,937
- Reserves months
- —
- Total cash needed
- —
Loan-product check · same deal, 3 products live
Conventional
25% down · 7.5% · 30yr
- Down + closing
- —
- Monthly P&I
- —
- Monthly cashflow
- —
- DSCR
- —
- Eligible?
- —
Personal DTI + credit; lowest rate.
DSCR
20% down · 8.5% · 30yr
- Down + closing
- —
- Monthly P&I
- —
- Monthly cashflow
- —
- DSCR
- —
- Eligible?
- —
No personal income docs; deal must DSCR.
Hard money
10% down · 12.0% · 12mo
- Down + closing
- —
- Monthly P&I
- —
- Monthly cashflow
- —
- DSCR
- —
- Eligible?
- —
Short-term bridge; refi at stabilization.
Rent comps 4 comps
| Address | Beds | Baths | Sqft | Rent | $/sqft | DOM | Units | Dist |
|---|---|---|---|---|---|---|---|---|
| 315 N 2nd St La Porte, TX | 1.0–3.0 | 1.0 | 762 | $1,259 | $1.65 | 17d | 1 | 0.69mi |
| 319 S 6th St La Porte, TX | 4.0 | 2.0 | 1812 | $1,795 | $0.99 | 24d | 1 | 0.89mi |
| 218 S 6th St La Porte, TX | 3.0 | 2.0 | 1500 | $1,925 | $1.28 | 43d | 1 | 0.90mi |
| 803 S 4th St La Porte, TX | 4.0 | 1.5 | 1688 | $1,700 | $1.01 | 5d | 1 | 0.95mi |
Listing history 9 events
-
2026-06-18days on market $197,900 Active 14 DOM
-
2026-06-17days on market $197,900 Active 13 DOM
-
2026-06-16days on market $197,900 Active 12 DOM
-
2026-06-15days on market $197,900 Active 11 DOM
-
2026-06-13days on market $197,900 Active 9 DOM
-
2026-06-09days on market $197,900 Active 5 DOM
-
2026-06-08days on market $197,900 Active 4 DOM
-
2026-06-07remarks 535-char remark
-
2026-06-07$197,900 Active 3 DOM
ⓘ Source: listings_history table (triggers on properties + properties_extension) + one-shot
backfill from property_details.listing_events for pre-trigger history.
Tax reassessment forecast TX · Resets to sale price
- Current annual tax
- $3,264 · $272/mo
- Projected year-2 tax
- $3,622 · $302/mo
- Expected delta
- +$358/yr (+$30/mo · 11.0%)
ⓘ Screening estimate from a state-policy table — verify with the county assessor before closing.
Climate risk First Street
- Flood 7/10 Severe FEMA zone X (shaded) · 74% chance over 30 yrs
- Wildfire 1/10 Low
- Heat 10/10 Extreme 7 d/yr ≥108°F today · 25 d/yr by 30 yrs out
- Wind 9/10 Extreme 99% chance of damaging wind over 30 yrs
- Air quality 2/10 Low 1 unhealthy d/yr today · 2 by 30 yrs out
Nearby sold comps map
Loading sold comps map…
Walkable amenities ~0.75 mi
Loading nearby amenities…
Taxation est. · year 1
- Rental income
- $22,028
- − Mortgage interest
- −$11,085
- − Property taxes
- −$3,264
- − Insurance
- −$1,787
- − Repairs & maintenance
- −$1,762
- − Management
- −$1,762
- − Depreciation
- −$5,757
- Taxable loss
- −$3,390
- Est. tax savings @ 24.0%
- +$814
- After-tax cash flow
- $711/yr
For passive investors: Depreciation is non-cash, so a rental often shows a tax loss while cash-flowing — sheltering income. Rental losses are passive: they offset passive income freely, and up to $25,000/yr can offset ordinary (W-2) income if you actively participate and your MAGI is under $100k (phasing out to $0 by $150k); unused losses carry forward. On sale, claimed depreciation is recaptured at up to 25%, and gains may owe capital-gains tax (a 1031 exchange can defer both). Figures are a year-1 estimate at your 24.0% rate — not tax advice; consult a CPA.
Schools (NCES district)
- District
- La Porte ISD
- NCES district ID
- 4826190
- Math proficiency
- 41% ▼ -10.00%
- Reading proficiency
- 44% ▼ -4.00%
- Median HH income
- $71,841
- Composite
- 38.65/100
- National rank
- #4151
- State rank
- #260 of 826 in TX
Livability — La Porte
- Score
- 70/100
- State rank
- #360
- US rank
- #7754
Category grades
Schools grade is shown separately in the Schools card above.
Census & demographics
- Census place
- La Porte, TX
- County
- Harris County · 4,702,590 people
- City population
- 38,543
- Metro
- Houston-The Woodlands-Sugar Land, TX
- Population (ZIP)
- 38,543
- Household income
- $81,850
- Rent vs Own
- Severe rent burden
- 1176.0
Population outlook (Harris County) Hauer SSP2
- Today (2025)
- 5,571,493 people
- By 2030
- 6,089,821 · +9.3%
- By 2040
- 7,142,806 · +28.2%
- By 2050
- 8,185,864 · +46.9%
- By 2075
- 10,574,329 · +89.8%
- By 2100
- 12,109,958 · +117.4%
Race, ethnicity, and origin ACS 2023
- Neighborhood character
- Diverse neighborhood (Simpson 0.60)
- Race & ethnicity
- White 51% Hispanic / Latino 36% Two or more races 20% Black 8% Asian 1%
- Hispanic origin (detail)
- Mexican 31%
- Common ancestry
- Italian 4% Lithuanian 3% Iranian 1%
- Foreign-born
- 10% · Canada, Vietnam
- Languages at home
- 77% English-only · Spanish 21% Other Indo-European 1%
Political lean MEDSL · Harris
- 2024 margin
- Lean D (+5.5) · D 52.0% · R 46.4% · Other 1.6%
- 2008→2024 swing
- +3.9pp toward D · 2008: 1.6pp · 2024: 5.5pp
- All cycles
- 2024: D+5.5 2020: D+13.3 2016: D+12.4 2012: D+0.1 2008: D+1.6
Not yet ingested
- Civics
- —
Market trends
- HPI YoY
- ▼ -103.81%
- Current HPI
- 255.0768
- Rent YoY
- ▲ 2.81%
- Metro
- Houston-The Woodlands-Sugar Land, TX
- State GDP YoY
- ▲ 3.95%
- F500 in state
- 110
Industry mix (Fortune 500 HQ in TX)
| Industry | F500 HQs | Revenue |
|---|---|---|
| Energy | 16 | $1,198B |
|
||
| Technology | 5 | $198B |
|
||
| Engineering / Construction | 4 | $72B |
|
||
| Energy Services | 3 | $60B |
|
||
| Utilities | 3 | $41B |
|
||
| Healthcare | 2 | $330B |
|
||
Price history
3 events — show timeline
- 2026-06-04 Listed $197,900 HARMLS
- 2025-07-29 Sold (Public Records) — Public Records
- 1988-01-02 Sold (Public Records) — Public Records
Property tax history
+3.2%/yrLatest (2025): $3,264 · +15.0% YoY. Source: county tax records.
Cash-flow waterfall
monthlySold comps — $/sqft
last 12 mo · ≤1 miLoading sold comps…