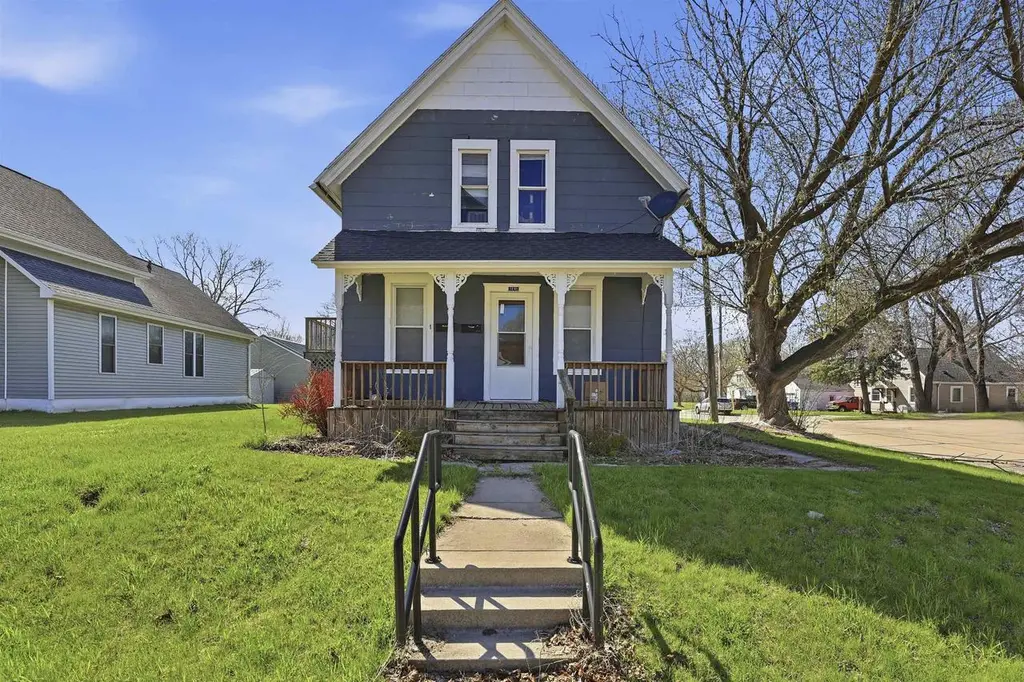
1201 Crooks Ave · Kaukauna, WI
Flood risk 1/10 · Minimal
- FEMA flood zone
- X (unshaded)
- Chance of flooding over 30 yrs
- 0.0%
- Est. flood insurance / yr
- $473 – $860
Fire risk 1/10 · Minimal
- Est. fire insurance / yr
- $636 – $1,182
Heat risk 2/10 · Minimal
- Hot days now (above 97°F)
- 7 days/yr
- Hot days in 30 yrs
- 12 days/yr
Wind risk 2/10 · Minimal
- Chance of severe wind over 30 yrs
- —
Air-quality risk 2/10 · Minimal
- Unhealthy air days now
- 0 days/yr
- Unhealthy air days in 30 yrs
- 1 days/yr
Risk factors via First Street. Map © Google.
Why this score? — see what drove the C grade
The composite is a weighted blend of 9 inputs, each scored 0–100. Each bar is that input's sub-score; the figure is the points it added to the 100-point composite (weight × sub-score).
- Cash flow +23.7/30.0
- DSCR +7.6/10.0
- ARV discount +7.5/15.0
- 1% rule +5.9/10.0
- Livability +4.5/5.0
- Schools +3.9/10.0
- Rent growth +2.5/5.0
- Condition / age +2.5/5.0
- Appreciation +0.0/10.0
$175,000
🖨 Deal sheet (PDF) 📄 Offer letter ✓ Due diligence
Listing remarks
Welcome to 1201 Crooks Ave in Kaukauna! This upper/lower duplex presents a great opportunity for both owner-occupants and investors alike. Whether you're looking to start building your investment portfolio or expand an existing one, this property offers solid potential. 1 upper BR has electric heat. Exterior features a durable asbestos/asphalt exterior. Showing Requirements: 24-hour notice required for all showings 48-hour response time for all offers
Key facts
- 6,098 sq ft lot
- Built 1908
- Listed 46 days
Property features AI
Finance
- Other: Lot size approximately 0.14 acre (< 1/2 acre)
Exterior
- Parking: No parking
- Utilities: Municipal water; Municipal sewer; Electric service; Natural gas service
- Home design: Multi-family property; 1.5-story / Bi-level design; 2 units in the building; Zoned for 2-family/duplex
- Construction: Assessor/public record used for year built
- Exterior features: Other exterior finish
Interior
- Kitchen: Unit 2 kitchen ~8 x 13; Includes 2 stoves and 2 refrigerators (included with the property)
- Bedrooms: Unit 1: 1 bedroom; Unit 2: 2 bedrooms (master ~8 x 11; second bedroom ~11 x 15)
- Bathrooms: Unit 1: 1 full bathroom; Unit 2: 1 full bathroom
- Heating & cooling: Electric heating/utility available; Natural gas heating/utility available
- Interior features: Full stone basement
Neighborhood map
What this means for you Summary
Snapshot
- This is a 6-bed/4.0-bath single-family listed at $175k.
Deal economics
- At list price, monthly cash flow is $332 ($4k/yr) — positive.
- The deal already cash-flows at list — no discount required.
- Meets the 1% rule at list price ($2k rent vs $175k).
- Recommended offer: $170k (3.0% below list) — sets the bar for market timing.
- Cap rate 8.6% vs local median 2.9% in Kaukauna — top-decile yield for the area; either an underpriced asset or a hidden risk that comps aren't pricing in. Stress-test before assuming the spread holds.
Location & tenants
- Location reads 89/100 on livability (#9 in WI, #120 nationally) — a professional / high-income tenant draw. Strengths: crime A+, commute A+, cost of living A+.
- Kaukauna Area School District (suburban): math 46% / reading 42% proficiency, ranked #98 of 342 in WI (top 29%) — families likely to look elsewhere, expect single-tenant / working-renter base with shorter leases.
- Zoned schools: Dr H B Tanner Elementary (502 students, 26% FRL); River View School (math 48% / reading 45%, grade D+, #85 of 383 statewide, top 23%, 1,148 students, 26% FRL); Kaukauna High (math 22% / reading 33%, grade F, #256 of 483 statewide, top 54%, 1,261 students, 21% FRL) — zoned schools at 24% FRL track the district average.
- Market conditions: 61 active listings in the ZIP; solid renter incomes; 460 units permitted in Outagamie County in 2024 (30 in 5+ unit buildings).
Forward outlook
- Local home prices are declining (-3.0%/yr); year-one equity from $1k of loan paydown is wiped out by about $5k of value loss. Plan a longer hold.
- Outagamie County population projected at +8% by 2050 — modest demand growth; plan on rents tracking national, not racing it.
Negotiation context
- It's been on market 46 days — a 3% lower offer ($170k) is reasonable based on typical stale-listing flexibility.
- Current owner paid $64k; list at $175k implies a 171% gain — meaningful room to come down on a strong offer.
Risks & watch-outs
- Watch-outs: built in 1908 — expect roof / HVAC / electrical / plumbing capex.
Questions for the listing agent
- It's been on market 46 days. Have you received any prior offers? Is the seller open to a 3% concession, seller financing, or rate buy-down credit?
- Built in 1908 — when were the roof, HVAC, electrical panel, plumbing, and water heater last replaced?
- Is there a deadline driving the sale (1031 exchange, divorce, estate, relocation)? That informs how much negotiation room exists.
- Schools are B-rated — typically a magnet for longer-tenancy family renters. What's the average tenant stay here, and is there a school-zone premium baked into asking?
- What's the average days-on-market for RENTAL listings here right now (not sales)? A rising rental-DOM trend means longer vacancies and softer asking-rent achievability than the comps imply.
- What's the recent tenant-quality profile in this submarket — average credit score on applications, eviction rate, late-payment / NSF rate, and stable-employment percentage? A property-management company in the area should have these aggregated.
- How much new for-sale + rental construction is in the pipeline within 1–3 miles? Heavy new supply typically softens prices + rents 12–24 months out; constrained supply supports both.
Investment metrics
- 1% rule
- 1.09% ✓
- Cap rate
- 8.57%
- Cash-on-cash
- 8.12%
- DSCR
- 1.36
- GRM
- 7.6
CMA / ARV
No comps found within radius.
Projected returns pro-forma
-3.0% appreciation · 3.0% rent growth · sell at horizon
- IRR
- -3.9%
- Equity multiple
- 0.85×
- Total profit
- $-7,231
- Equity at exit
- $26,093
- IRR
- 5.8%
- Equity multiple
- 1.43×
- Total profit
- $20,931
- Equity at exit
- $15,131
Cash invested: $49,000 (down + closing). Projections, not guarantees.
Landlord ↔ Tenant lean methodology
- Overall (STATE)
- 73 Landlord-Friendly
- State Wisconsin
- 73 Landlord-Friendly · R+2
- County
- — inherits STATE
- City
- — inherits STATE
ZIP-level market 54130
- Active inventory
- 61
- Price-to-rent
- 7.6×
Monthly cashflow live
- Estimated rent
- $1,909 medium interval (Pro) →
- Mortgage (P&I)
- −$918
- Tax from tax record
- −$186 /mo · $2,227/yr
- Insurance
- −$73
- HOA
- −$0
- Lot rent
- −$0
- Vacancy / Maint / Mgmt
- −$401
- Net cashflow
- $332
Break-even live
Sensitivity live
| Price | -10% $431 | -5% $381 | +0% $332 | +5% $282 | +10% $233 |
|---|---|---|---|---|---|
| Rent | -10% $181 | -5% $256 | +0% $332 | +5% $407 | +10% $482 |
| Rate | -1.0pp $420 | -0.5pp $376 | base $332 | +0.5pp $286 | +1.0pp $240 |
UW: 25.0% down · 7.5% · 30yr · 1.5% tax · 5.0% vac · 8.0% maint · 8.0% mgmt
Financing live
Cash to close
- Down payment
- $43,750
- Closing costs
- $5,250
- Reserves months
- —
- Total cash needed
- —
Loan-product check · same deal, 3 products live
Conventional
25% down · 7.5% · 30yr
- Down + closing
- —
- Monthly P&I
- —
- Monthly cashflow
- —
- DSCR
- —
- Eligible?
- —
Personal DTI + credit; lowest rate.
DSCR
20% down · 8.5% · 30yr
- Down + closing
- —
- Monthly P&I
- —
- Monthly cashflow
- —
- DSCR
- —
- Eligible?
- —
No personal income docs; deal must DSCR.
Hard money
10% down · 12.0% · 12mo
- Down + closing
- —
- Monthly P&I
- —
- Monthly cashflow
- —
- DSCR
- —
- Eligible?
- —
Short-term bridge; refi at stabilization.
Listing history 14 events
-
2026-06-10status $175,000 Pending 46 DOM
-
2026-06-09days on market $175,000 Active w/ Contract 46 DOM
-
2026-06-08days on market $175,000 Active w/ Contract 45 DOM
-
2026-06-07days on market $175,000 Active w/ Contract 44 DOM
-
2026-06-05days on market $175,000 Active w/ Contract 41 DOM
-
2026-06-03days on market $175,000 Active w/ Contract 40 DOM
-
2026-06-02days on market $175,000 Active w/ Contract 39 DOM
-
2026-06-01days on market $175,000 Active w/ Contract 38 DOM
-
2026-05-31days on market $175,000 Active w/ Contract 37 DOM
-
2026-05-30days on market $175,000 Active w/ Contract 36 DOM
-
2026-04-29historical Active w/ Contract
-
2026-04-22$175,000 Active
-
2019-07-23soldstatus $64,500
-
2002-10-21soldstatus $69,000
ⓘ Source: listings_history table (triggers on properties + properties_extension) + one-shot
backfill from property_details.listing_events for pre-trigger history.
Tax reassessment forecast WI · Partial reset (capped growth)
- Current annual tax
- $2,227 · $186/mo
- Projected year-2 tax
- $2,732 · $228/mo
- Expected delta
- +$505/yr (+$42/mo · 22.7%)
ⓘ Screening estimate from a state-policy table — verify with the county assessor before closing.
Climate risk First Street
- Flood 1/10 Low FEMA zone X (unshaded) · 0% chance over 30 yrs
- Wildfire 1/10 Low
- Heat 2/10 Low 7 d/yr ≥97°F today · 12 d/yr by 30 yrs out
- Wind 2/10 Low
- Air quality 2/10 Low 0 unhealthy d/yr today · 1 by 30 yrs out
Nearby sold comps map
Loading sold comps map…
Walkable amenities ~0.75 mi
Loading nearby amenities…
Taxation est. · year 1
- Rental income
- $22,903
- − Mortgage interest
- −$9,803
- − Property taxes
- −$2,227
- − Insurance
- −$875
- − Repairs & maintenance
- −$1,832
- − Management
- −$1,832
- − Depreciation
- −$5,091
- Taxable income
- $1,243
- Est. tax owed @ 24.0%
- −$298
- After-tax cash flow
- $3,681/yr
For passive investors: Depreciation is non-cash, so a rental often shows a tax loss while cash-flowing — sheltering income. Rental losses are passive: they offset passive income freely, and up to $25,000/yr can offset ordinary (W-2) income if you actively participate and your MAGI is under $100k (phasing out to $0 by $150k); unused losses carry forward. On sale, claimed depreciation is recaptured at up to 25%, and gains may owe capital-gains tax (a 1031 exchange can defer both). Figures are a year-1 estimate at your 24.0% rate — not tax advice; consult a CPA.
Schools (NCES district)
- District
- Kaukauna Area School District
- NCES district ID
- 5507290
- Math proficiency
- 46% ▼ -6.00%
- Reading proficiency
- 42% ▼ -6.00%
- Median HH income
- $60,141
- Composite
- 38.81/100
- National rank
- #4118
- State rank
- #98 of 342 in WI
Livability — Kaukauna
- Score
- 89/100
- State rank
- #9
- US rank
- #120
Category grades
Schools grade is shown separately in the Schools card above.
Census & demographics
- Census place
- Kaukauna, WI
- County
- Outagamie County · 155,051 people
- City population
- 28,380
- Metro
- Appleton, WI
- Population (ZIP)
- 28,380
- Household income
- $89,131
- Rent vs Own
- Severe rent burden
- 504.0
Population outlook (Outagamie County) Hauer SSP2
- Today (2025)
- 195,863 people
- By 2030
- 201,154 · +2.7%
- By 2040
- 209,053 · +6.7%
- By 2050
- 211,957 · +8.2%
- By 2075
- 214,299 · +9.4%
- By 2100
- 200,825 · +2.5%
Race, ethnicity, and origin ACS 2023
- Neighborhood character
- Predominantly White (92%)
- Race & ethnicity
- White 92% Two or more races 4% Hispanic / Latino 3% Asian 2%
- Common ancestry
- Iranian 15% Romanian 4% Lithuanian 3%
- Foreign-born
- 2% · Canada
- Languages at home
- 97% English-only · Spanish 1% Other Asian/Pacific 1%
Political lean MEDSL · Outagamie
- 2024 margin
- R (+10.2) · D 44.2% · R 54.4% · Other 1.5%
- 2008→2024 swing
- -21.8pp toward R · 2008: 11.6pp · 2024: -10.2pp
- All cycles
- 2024: R+10.2 2020: R+9.9 2016: R+12.6 2012: R+1.8 2008: D+11.6
Not yet ingested
- Civics
- —
Market trends
- HPI YoY
- ▼ -125.51%
- Current HPI
- 213.4207
- Rent YoY
- —
- Metro
- Appleton, WI
- State GDP YoY
- ▲ 2.10%
- F500 in state
- 20
Industry mix (Fortune 500 HQ in WI)
| Industry | F500 HQs | Revenue |
|---|---|---|
| Industrial Machinery | 4 | $23B |
|
||
| Industrial Technology | 2 | $36B |
|
||
| Insurance | 1 | $36B |
|
||
| Professional Services | 1 | $19B |
|
||
| Utilities | 1 | $9B |
|
||
| Consumer Goods | 1 | $3B |
|
||
Price history
+153.6% since first listed4 events — show timeline
- 2026-04-29 Contingent — RANW
- 2026-04-22 Listed $175,000 RANW
- 2019-07-23 Sold (Public Records) $64,500 Public Records
- 2002-10-21 Sold (Public Records) $69,000 Public Records
Property tax history
+2.3%/yrLatest (2025): $2,227 · +54.6% YoY. Source: county tax records.
Cash-flow waterfall
monthlySold comps — $/sqft
last 12 mo · ≤1 miLoading sold comps…