 🏷️ Likely Rental
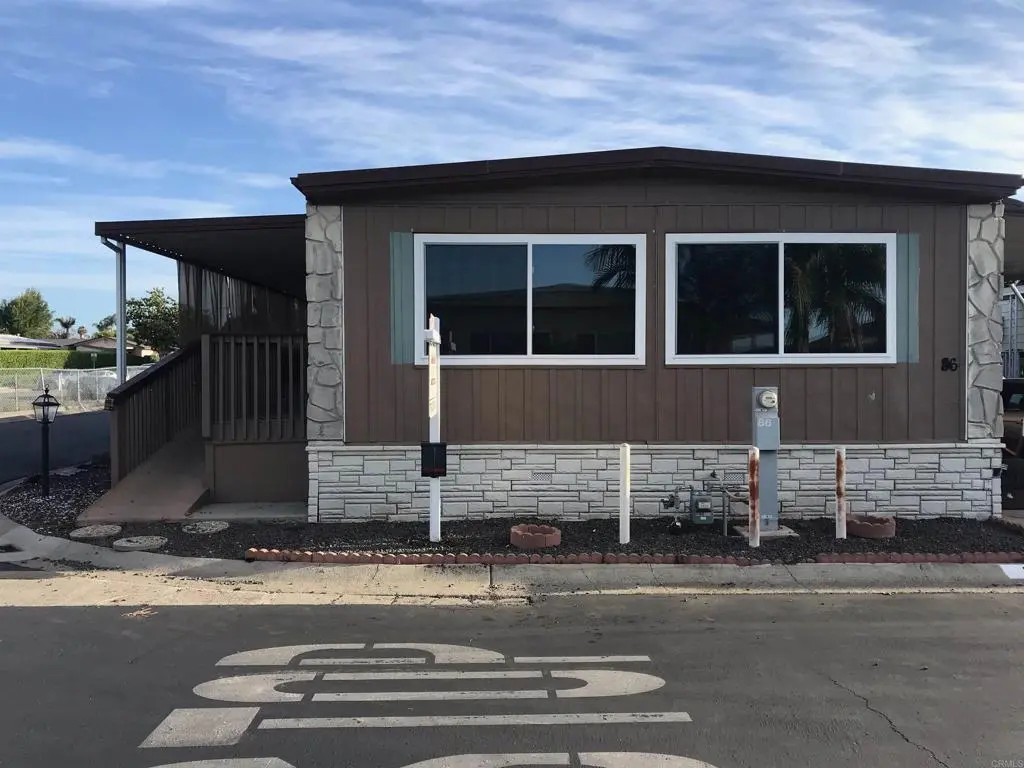
1010 E Bobier Dr E #86 · Vista, CA
Flood risk 4/10 · Minor
- FEMA flood zone
- X (shaded)
- Chance of flooding over 30 yrs
- 0.2%
- Est. flood insurance / yr
- $507 – $1,088
Fire risk 3/10 · Minor
- Est. fire insurance / yr
- $659 – $1,223
Heat risk 5/10 · Moderate
- Hot days now (above 90°F)
- 7 days/yr
- Hot days in 30 yrs
- 22 days/yr
Wind risk 1/10 · Minimal
- Chance of severe wind over 30 yrs
- —
Air-quality risk 3/10 · Minor
- Unhealthy air days now
- 4 days/yr
- Unhealthy air days in 30 yrs
- 4 days/yr
Risk factors via First Street. Map © Google.
Why this score? — see what drove the B+ grade
The composite is a weighted blend of 9 inputs, each scored 0–100. Each bar is that input's sub-score; the figure is the points it added to the 100-point composite (weight × sub-score).
- Cash flow +30.0/30.0
- ARV discount +15.0/15.0
- 1% rule +10.0/10.0
- DSCR +10.0/10.0
- Schools +4.0/10.0
- Livability +3.0/5.0
- Rent growth +2.9/5.0
- Condition / age +2.5/5.0
- Appreciation +0.0/10.0
$132,000
🖨 Deal sheet (PDF) 📄 Offer letter ✓ Due diligence
Listing remarks MLS
Lovely 1,392 sq. ft. mobile home situated on a spacious corner lot in the sought-after 55+ Vista Royal Lodge community. This home features a bright and open floor plan, providing plenty of living space and easy access to shopping and public transportation. The windows are upgraded to vinyl. The property boasts mature grapefruit, orange, and lemon trees, enhancing its charm. The park is city rent-controlled, with a monthly space rent of $1,138.45. Approval from the park is necessary, requiring residents to be 55/45 years old, have a credit score of 700 or above, earn at least three times the space rent monthly, and have no history of evictions or bankruptcy. Additionally, there are no yearly property taxes.
Key facts
- Mature orange trees
- Mature lemon trees
- Large corner lot
Tags
Neighborhood map
What this means for you Summary
Snapshot
- This is a 2-bed/2.0-bath manufactured listed at $132k.
Deal economics
- At list price, monthly cash flow is $1k ($17k/yr) — positive.
- The deal already cash-flows at list — no discount required.
- Meets the 1% rule at list price ($3k rent vs $132k).
- Recommended offer: $124k (6.0% below list) — sets the bar for market timing.
- Cap rate 19.1% vs local median 2.4% in Vista — top-decile yield for the area; either an underpriced asset or a hidden risk that comps aren't pricing in. Stress-test before assuming the spread holds.
Location & tenants
- Location reads 60/100 on livability (#584 in CA) — a middle-class / working-renter tenant base. Strengths: commute A+, employment A-; Watch: schools F, amenities F, cost of living F.
- Vista Unified (suburban): math 32% / reading 59% proficiency, ranked #175 of 517 in CA (top 34%) — families likely to look elsewhere, expect single-tenant / working-renter base with shorter leases.
- Market conditions: Rents rising (+1.6%/yr); 133 active listings in the ZIP; 40 comparable units currently listed for rent nearby; rentals at typical pace (median 18d on market — plan ~3-4 weeks tenant-placement turnaround); solid renter incomes; 11,759 units permitted in San Diego County in 2024 (7,244 in 5+ unit buildings).
- This rent runs 36% of the median local income ($99k/yr) — at the standard rent-burdened threshold; future hikes will face affordability resistance.
Forward outlook
- Local home prices are declining (-3.0%/yr); year-one equity from $913 of loan paydown is wiped out by about $4k of value loss. Plan a longer hold.
- San Diego County population projected at +20% by 2050 — long-run rental-demand tailwind backs the buy-and-hold thesis.
- At projected returns (-3.0% appreciation + 1.6% rent growth), your $37k cash investment doubles in ~3 years — after that, you're playing with house money.
Negotiation context
- It's been on market 63 days — a 6% lower offer ($124k) is reasonable based on typical stale-listing flexibility.
- 4 sale attempts since 19y ago; this cycle's ask has dropped $13k (9%) from the opening price — seller is motivated, your offer sets the floor, not the list.
- Current owner paid $90k; 47% above their basis — modest negotiation headroom, anchor on the comps not their cost.
Risks & watch-outs
- Climate carrying-cost: extreme-heat days projected 7→22/yr by 2055 (HVAC capex compounding) — expect insurance premiums to compound above CPI over the hold.
Questions for the listing agent
- It's been on market 63 days. Have you received any prior offers? Is the seller open to a 6% concession, seller financing, or rate buy-down credit?
- Built in 1973 — when were the roof, HVAC, electrical panel, plumbing, and water heater last replaced?
- Why hasn't it sold? Are there any deal-killer items the seller is aware of (foundation, flood, title, zoning, code violations)?
- Is there a deadline driving the sale (1031 exchange, divorce, estate, relocation)? That informs how much negotiation room exists.
- Schools are F-rated, which usually means shorter tenancies and higher turnover. Who's the typical renter profile here, and what's been the actual vacancy rate?
- What's the average days-on-market for RENTAL listings here right now (not sales)? A rising rental-DOM trend means longer vacancies and softer asking-rent achievability than the comps imply.
- What's the recent tenant-quality profile in this submarket — average credit score on applications, eviction rate, late-payment / NSF rate, and stable-employment percentage? A property-management company in the area should have these aggregated.
- How much new for-sale + rental construction is in the pipeline within 1–3 miles? Heavy new supply typically softens prices + rents 12–24 months out; constrained supply supports both.
Investment metrics
- 1% rule
- 2.22% ✓
- Cap rate
- 19.09%
- Cash-on-cash
- 45.69%
- DSCR
- 3.03
- GRM
- 3.7
CMA / ARV
- ARV (median comp)
- $245,000
- List price
- $132,000
- Delta
- -46.12%
- Verdict
- UNDERPRICED
- Comps
- 19 within 1.0 mi
Show comp detail 12 sales within ~0.75 mi
| Address | Dist | Beds/Ba | Sqft | Sold | Price | $/sf | Match |
|---|---|---|---|---|---|---|---|
| 1010 E Bobier Dr #46 | 0.02mi | 3/2.0 (+1) | 1,392 (0%) | 10mo | $225,000 | $162 | 86 |
| 1010 East Bobier Dr #51 | 0.00mi | 2/2.0 | 1,248 (-10%) | 3mo | $130,000 | $104 | 80 |
| 1501 Anza Ave #3 | 0.17mi | 2/2.0 | 1,344 (-3%) | 7mo | $275,000 | $205 | 80 |
| 1010 E Bobier #89 | 0.00mi | 2/2.0 | 1,272 (-9%) | 7mo | $210,000 | $165 | 80 |
| 1501 Anza Ave #70 | 0.17mi | 2/2.0 | 1,440 (+3%) | 9mo | $290,000 | $201 | 79 |
| 1506 Oak Dr #4 | 0.31mi | 2/2.0 | 1,440 (+3%) | 2mo | $245,000 | $170 | 78 |
| 1010 E Bobier Dr #137 | 0.00mi | 3/2.0 (+1) | 1,568 (+13%) | 1mo | $200,000 | $128 | 73 |
| 1506 Oak #67 | 0.31mi | 3/2.0 (+1) | 1,369 (-2%) | 9mo | $349,500 | $255 | 70 |
| 1501 Anza Ave #79 | 0.17mi | 3/2.0 (+1) | 1,248 (-10%) | 1mo | $357,900 | $287 | 69 |
| 1600 E Vista Way #40 | 0.26mi | 2/2.0 | 1,539 (+11%) | 4mo | $353,000 | $229 | 66 |
| 1600 E Vista Way #81 | 0.35mi | 2/2.0 | 1,200 (-14%) | 2mo | $330,000 | $275 | 59 |
| 1506 Oak Dr #55 | 0.31mi | 2/2.0 | 1,578 (+13%) | 8mo | $360,000 | $228 | 57 |
Match score weights: distance 35% · size 25% · config 20% · recency 20%. Top-matched comps best support the ARV.
Projected returns pro-forma
-3.0% appreciation · 1.59% rent growth · sell at horizon
- IRR
- 41.3%
- Equity multiple
- 2.74×
- Total profit
- $64,182
- Equity at exit
- $19,682
- IRR
- 46.8%
- Equity multiple
- 5.20×
- Total profit
- $155,102
- Equity at exit
- $11,413
Cash invested: $36,960 (down + closing). Projections, not guarantees.
Landlord ↔ Tenant lean methodology
- Overall (STATE)
- 18 Strongly Tenant-Friendly
- State California
- 18 Strongly Tenant-Friendly · D+13
- County
- — inherits STATE
- City
- — inherits STATE
ZIP-level market 92084
- Rents YoY
- 1.6%
- Active inventory
- 133
- Price-to-rent
- 3.7×
Monthly cashflow live
- Estimated rent
- $2,936 high interval (Pro) →
- Mortgage (P&I)
- −$692
- Tax est. 1.5%
- −$165 /mo · $1,980/yr
- Insurance
- −$55
- HOA
- −$0
- Vacancy / Maint / Mgmt
- −$617
- Net cashflow
- $1,407
Break-even live
Sensitivity live
| Price | -10% $1,499 | -5% $1,453 | +0% $1,407 | +5% $1,362 | +10% $1,316 |
|---|---|---|---|---|---|
| Rent | -10% $1,175 | -5% $1,291 | +0% $1,407 | +5% $1,523 | +10% $1,639 |
| Rate | -1.0pp $1,474 | -0.5pp $1,441 | base $1,407 | +0.5pp $1,373 | +1.0pp $1,338 |
UW: 25.0% down · 7.5% · 30yr · 1.5% tax · 5.0% vac · 8.0% maint · 8.0% mgmt
Financing live
Cash to close
- Down payment
- $33,000
- Closing costs
- $3,960
- Reserves months
- —
- Total cash needed
- —
Loan-product check · same deal, 3 products live
Conventional
25% down · 7.5% · 30yr
- Down + closing
- —
- Monthly P&I
- —
- Monthly cashflow
- —
- DSCR
- —
- Eligible?
- —
Personal DTI + credit; lowest rate.
DSCR
20% down · 8.5% · 30yr
- Down + closing
- —
- Monthly P&I
- —
- Monthly cashflow
- —
- DSCR
- —
- Eligible?
- —
No personal income docs; deal must DSCR.
Hard money
10% down · 12.0% · 12mo
- Down + closing
- —
- Monthly P&I
- —
- Monthly cashflow
- —
- DSCR
- —
- Eligible?
- —
Short-term bridge; refi at stabilization.
Rent comps 40 comps
| Address | Beds | Baths | Sqft | Rent | $/sqft | DOM | Units | Dist |
|---|---|---|---|---|---|---|---|---|
| 1370 Calle Jules Apt 202 Vista, CA | 2.0 | 2.0 | 1080 | $2,600 | $2.41 | 44d | 1 | 0.07mi |
| 1370 Calle Jules Vista, CA | 1.0–2.0 | 1.0–2.0 | 935 | $2,500 | $2.67 | 17d | 3 | 0.08mi |
| 1370 Calle Jules Unit 215 Vista, CA | 2.0 | 2.0 | 1060 | $2,500 | $2.36 | 44d | 1 | 0.09mi |
| 1501 Anza Ave Vista, CA | 2.0 | 2.0 | 1345 | $2,999 | $2.23 | 6d | 1 | 0.16mi |
| 1234 Calle Jules Apt 2 Vista, CA | 3.0 | 1.0 | 900 | $2,500 | $2.78 | 44d | 1 | 0.26mi |
| 1107 Delpy View Pt Vista, CA | 3.0 | 2.0 | 1472 | $3,718 | $2.53 | 44d | 1 | 0.34mi |
| 1109 Delpy View Pt Vista, CA | 3.0 | 2.5 | 1472 | $3,500 | $2.38 | 15d | 1 | 0.34mi |
| 1701 Calle Jules Unit 1707 Vista, CA | 3.0 | 2.0 | 1595 | $3,500 | $2.19 | 44d | 1 | 0.35mi |
| 1194 Madera Ln Vista, CA | 2.0 | 1.5 | 1044 | $2,850 | $2.73 | 44d | 1 | 0.37mi |
| 1164 Madera Ln Vista, CA | 2.0 | 1.5 | 974 | $2,850 | $2.93 | 44d | 1 | 0.39mi |
| 950 Arcadia Ave Vista, CA | 2.0 | 1.0 | 825 | $2,495 | $3.02 | 0d | 2 | 0.42mi |
| 1134 Anza Ave Vista, CA | 3.0 | 2.0 | 1300 | $4,000 | $3.08 | 44d | 1 | 0.43mi |
| 1349 Isabella Way Vista, CA | 3.0 | 2.5 | 1356 | $3,895 | $2.87 | 6d | 1 | 0.49mi |
| 1349 Isabella Way Vista, CA | 3.0 | 2.5 | 1356 | $3,895 | $2.87 | 0d | 1 | 0.49mi |
| 1351 Isabella Way Vista, CA | 2.0 | 2.0 | 1274 | $2,950 | $2.32 | 17d | 1 | 0.49mi |
| 1575 Oak Dr Vista, CA | 1.0–2.0 | 1.0 | 800 | $2,435 | $3.04 | 0d | 6 | 0.50mi |
| 1304 Palomar Pl Unit 1 Vista, CA | 3.0 | 2.0 | 1396 | $3,695 | $2.65 | 0d | 1 | 0.51mi |
| 810 Daybreak Pl Vista, CA | 3.0 | 2.5 | 1458 | $3,995 | $2.74 | 13d | 1 | 0.58mi |
| 1060 Meadow Lake Dr Vista, CA | 2.0 | 1.0 | 963 | $2,495 | $2.59 | 45d | 1 | 0.64mi |
| 1130 Meadow Lake Dr Unit 06 Vista, CA | 2.0 | 1.0 | 1000 | $2,695 | $2.69 | 44d | 1 | 0.64mi |
| 1025 Meadow Lake Dr Apt 12A Vista, CA | 1.0 | 1.0 | 960 | $2,195 | $2.29 | 44d | 1 | 0.65mi |
| 1025 Meadow Lake Dr Apt 20 Vista, CA | 1.0 | 1.0 | 960 | $2,195 | $2.29 | 12d | 1 | 0.65mi |
| 510 Townsite Dr Vista, CA | 1.0–2.0 | 1.0–1.5 | 775 | $2,195 | $2.83 | 0d | 2 | 0.72mi |
| 1060 Vale Terrace Dr Vista, CA | 1.0–2.0 | 1.0–2.0 | 866 | $2,425 | $2.80 | 6d | 1 | 0.75mi |
| 1520 Independence Way Unit 3 Vista, CA | 2.0 | 2.0 | 1130 | $3,400 | $3.01 | 11d | 1 | 0.77mi |
| 1509 Goodwin Dr Vista, CA | 3.0 | 2.0 | 1200 | $3,500 | $2.92 | 44d | 1 | 0.78mi |
| 1122 Geronimo Pl Vista, CA | 3.0–4.0 | 2.5–3.0 | 1354 | $3,579 | $2.64 | 0d | 1 | 0.80mi |
| 801 Hillside Ter Vista, CA | 2.0 | 2.0 | 1150 | $2,550 | $2.22 | 24d | 1 | 0.81mi |
| 2073 White Alder Ln Vista, CA | 1.0 | 1.0 | 1857 | $2,000 | $1.08 | 18d | 1 | 0.81mi |
| 1333 N Santa Fe Ave Vista, CA | 2.0 | 1.0–2.0 | 886 | $3,456 | $3.90 | 0d | 11 | 0.85mi |
| 1280 N Citrus Ave Vista, CA | 1.0–2.0 | 1.0–2.0 | 979 | $2,705 | $2.76 | 0d | 4 | 0.87mi |
| 740 Paseo Buena Vis Vista, CA | 1.0–3.0 | 1.0–2.0 | 1038 | $3,337 | $3.21 | 0d | 7 | 0.88mi |
| 1559 N Santa Fe Ave Vista, CA | 2.0 | 1.0–2.0 | 699 | $3,145 | $4.50 | 20d | 4 | 0.97mi |
| 1559 N Santa Fe Ave Vista, CA | 1.0–2.0 | 1.0–2.0 | 827 | $3,195 | $3.86 | 25d | 10 | 0.97mi |
| 318 Hillside Ct Vista, CA | 2.0 | 1.5 | 925 | $2,595 | $2.81 | 3d | 1 | 0.99mi |
| 1024 Bonnie Brae Pl Vista, CA | 3.0 | 2.0 | 1684 | $3,800 | $2.26 | 25d | 1 | 1.00mi |
| 291 Weston Cir Apt 4 Vista, CA | 2.0 | 2.0 | 890 | $2,650 | $2.98 | 0d | 1 | 1.13mi |
| 123 Taylor St Vista, CA | 2.0 | 2.0 | 947 | $2,700 | $2.85 | 6d | 2 | 1.16mi |
| 311 Weston Cir Vista, CA | 2.0 | 1.5–2.0 | 890 | $2,645 | $2.97 | 25d | 5 | 1.19mi |
| 271 Weston Cir Apt 21 Vista, CA | 2.0 | 2.0 | 890 | $2,695 | $3.03 | 25d | 1 | 1.21mi |
Listing history 26 events
-
2026-06-21days on market $132,000 Active 63 DOM
-
2026-06-18days on market $132,000 Active 60 DOM
-
2026-06-17days on market $132,000 Active 59 DOM
-
2026-06-16days on market $132,000 Active 58 DOM
-
2026-06-15days on market $132,000 Active 57 DOM
-
2026-06-13days on market $132,000 Active 55 DOM
-
2026-06-13days on market $132,000 Active 54 DOM
-
2026-06-09days on market $132,000 Active 51 DOM
-
2026-06-08days on market $132,000 Active 50 DOM
-
2026-06-07days on market $132,000 Active 49 DOM
-
2026-06-04days on market $132,000 Active 46 DOM
-
2026-06-03days on market $132,000 Active 45 DOM
-
2026-06-02days on market $132,000 Active 44 DOM
-
2026-06-01days on market $132,000 Active 43 DOM
-
2026-05-31days on market $132,000 Active 42 DOM
-
2026-05-07price $132,000 715-char remark
Show marketing remark (715 chars)
Lovely 1,392 sq. ft. mobile home situated on a spacious corner lot in the sought-after 55+ Vista Royal Lodge community. This home features a bright and open floor plan, providing plenty of living space and easy access to shopping and public transportation. The windows are upgraded to vinyl. The property boasts mature grapefruit, orange, and lemon trees, enhancing its charm. The park is city rent-controlled, with a monthly space rent of $1,138.45. Approval from the park is necessary, requiring residents to be 55/45 years old, have a credit score of 700 or above, earn at least three times the space rent monthly, and have no history of evictions or bankruptcy. Additionally, there are no yearly property taxes.
-
2026-04-27price $137,999 715-char remark
Show marketing remark (715 chars)
Lovely 1,392 sq. ft. mobile home situated on a spacious corner lot in the sought-after 55+ Vista Royal Lodge community. This home features a bright and open floor plan, providing plenty of living space and easy access to shopping and public transportation. The windows are upgraded to vinyl. The property boasts mature grapefruit, orange, and lemon trees, enhancing its charm. The park is city rent-controlled, with a monthly space rent of $1,138.45. Approval from the park is necessary, requiring residents to be 55/45 years old, have a credit score of 700 or above, earn at least three times the space rent monthly, and have no history of evictions or bankruptcy. Additionally, there are no yearly property taxes.
-
2026-04-17$145,000 Active 715-char remark
Show marketing remark (715 chars)
Lovely 1,392 sq. ft. mobile home situated on a spacious corner lot in the sought-after 55+ Vista Royal Lodge community. This home features a bright and open floor plan, providing plenty of living space and easy access to shopping and public transportation. The windows are upgraded to vinyl. The property boasts mature grapefruit, orange, and lemon trees, enhancing its charm. The park is city rent-controlled, with a monthly space rent of $1,138.45. Approval from the park is necessary, requiring residents to be 55/45 years old, have a credit score of 700 or above, earn at least three times the space rent monthly, and have no history of evictions or bankruptcy. Additionally, there are no yearly property taxes.
-
2021-10-13soldstatus $90,000 Sold 539-char remark
Show marketing remark (539 chars)
1400 sq. ft. Mobile Home on large corner lot. Home is located in popular 55 and up, Vista Royal Lodge mobile home community. Enjoy the convenience of being so close to all your shopping and transportation needs. This mobile home has plenty of living space and is large and open. Three fruit trees on the property bear the best Grapefruit, Oranges and Lemons. Mobile home community is under rent control through the city of Vista. Must be park approved before completing the purchase process. Space rent is $753.13 monthly. No yearly taxes!
-
2021-09-25status Pending 539-char remark
Show marketing remark (539 chars)
1400 sq. ft. Mobile Home on large corner lot. Home is located in popular 55 and up, Vista Royal Lodge mobile home community. Enjoy the convenience of being so close to all your shopping and transportation needs. This mobile home has plenty of living space and is large and open. Three fruit trees on the property bear the best Grapefruit, Oranges and Lemons. Mobile home community is under rent control through the city of Vista. Must be park approved before completing the purchase process. Space rent is $753.13 monthly. No yearly taxes!
-
2021-08-25price $92,500 539-char remark
Show marketing remark (539 chars)
1400 sq. ft. Mobile Home on large corner lot. Home is located in popular 55 and up, Vista Royal Lodge mobile home community. Enjoy the convenience of being so close to all your shopping and transportation needs. This mobile home has plenty of living space and is large and open. Three fruit trees on the property bear the best Grapefruit, Oranges and Lemons. Mobile home community is under rent control through the city of Vista. Must be park approved before completing the purchase process. Space rent is $753.13 monthly. No yearly taxes!
-
2021-08-05$99,500 Active 539-char remark
Show marketing remark (539 chars)
1400 sq. ft. Mobile Home on large corner lot. Home is located in popular 55 and up, Vista Royal Lodge mobile home community. Enjoy the convenience of being so close to all your shopping and transportation needs. This mobile home has plenty of living space and is large and open. Three fruit trees on the property bear the best Grapefruit, Oranges and Lemons. Mobile home community is under rent control through the city of Vista. Must be park approved before completing the purchase process. Space rent is $753.13 monthly. No yearly taxes!
-
2007-12-31historical
-
2007-12-31historical
-
2007-06-20$54,000
-
2007-06-20$54,000
ⓘ Source: listings_history table (triggers on properties + properties_extension) + one-shot
backfill from property_details.listing_events for pre-trigger history.
Climate risk First Street
- Flood 4/10 Moderate FEMA zone X (shaded) · 20% chance over 30 yrs
- Wildfire 3/10 Moderate
- Heat 5/10 Major 7 d/yr ≥90°F today · 22 d/yr by 30 yrs out
- Wind 1/10 Low
- Air quality 3/10 Moderate 4 unhealthy d/yr today · 4 by 30 yrs out
Nearby sold comps map
Loading sold comps map…
Walkable amenities ~0.75 mi
Loading nearby amenities…
Taxation est. · year 1
- Rental income
- $35,234
- − Mortgage interest
- −$7,394
- − Property taxes
- −$1,980
- − Insurance
- −$660
- − Repairs & maintenance
- −$2,819
- − Management
- −$2,819
- − Depreciation
- −$3,840
- Taxable income
- $15,723
- Est. tax owed @ 24.0%
- −$3,773
- After-tax cash flow
- $13,115/yr
For passive investors: Depreciation is non-cash, so a rental often shows a tax loss while cash-flowing — sheltering income. Rental losses are passive: they offset passive income freely, and up to $25,000/yr can offset ordinary (W-2) income if you actively participate and your MAGI is under $100k (phasing out to $0 by $150k); unused losses carry forward. On sale, claimed depreciation is recaptured at up to 25%, and gains may owe capital-gains tax (a 1031 exchange can defer both). Figures are a year-1 estimate at your 24.0% rate — not tax advice; consult a CPA.
Schools (NCES district)
- District
- Vista Unified
- NCES district ID
- 0641190
- Math proficiency
- 32% ▼ -5.00%
- Reading proficiency
- 59% ▲ 9.00%
- Median HH income
- $60,067
- Composite
- 39.91/100
- National rank
- #3850
- State rank
- #175 of 517 in CA
Livability — Vista
- Score
- 60/100
- State rank
- #584
- US rank
- #18990
Category grades
Schools grade is shown separately in the Schools card above.
Census & demographics
- Census place
- Vista, CA
- County
- San Diego County · 3,178,799 people
- City population
- 117,104
- Metro
- San Diego-Chula Vista-Carlsbad, CA
- Population (ZIP)
- 49,727
- Household income
- $98,577
- Rent vs Own
- Severe rent burden
- 1904.0
Population outlook (San Diego County) Hauer SSP2
- Today (2025)
- 3,678,185 people
- By 2030
- 3,856,546 · +4.8%
- By 2040
- 4,171,407 · +13.4%
- By 2050
- 4,421,607 · +20.2%
- By 2075
- 4,831,599 · +31.4%
- By 2100
- 4,832,502 · +31.4%
Race, ethnicity, and origin ACS 2023
- Neighborhood character
- Diverse neighborhood (Simpson 0.61)
- Race & ethnicity
- Hispanic / Latino 49% White 38% Two or more races 26% Asian 4% Black 2% Native American 1% Pacific Islander 1%
- Hispanic origin (detail)
- Mexican 46%
- Common ancestry
- Lithuanian 2% Italian 2% Romanian 1%
- Foreign-born
- 22% · Canada, Vietnam
- Languages at home
- 62% English-only · Spanish 34% Tagalog/Filipino 1% Other Indo-European 1%
Political lean MEDSL · San Diego
- 2024 margin
- D (+16.8) · D 56.9% · R 40.1% · Other 2.9%
- 2008→2024 swing
- +6.6pp toward D · 2008: 10.2pp · 2024: 16.8pp
- All cycles
- 2024: D+16.8 2020: D+22.8 2016: D+17.8 2012: D+5.1 2008: D+10.2
Not yet ingested
- Civics
- —
Market trends
- HPI YoY
- ▼ -649.36%
- Current HPI
- 366.7772
- Rent YoY
- ▲ 1.59%
- Metro
- San Diego-Chula Vista-Carlsbad, CA
- State GDP YoY
- ▲ 3.21%
- F500 in state
- 116
Industry mix (Fortune 500 HQ in CA)
| Industry | F500 HQs | Revenue |
|---|---|---|
| Technology | 27 | $1,492B |
|
||
| Financial Services | 3 | $174B |
|
||
| Retail | 3 | $44B |
|
||
| Insurance | 3 | $26B |
|
||
| Media / Entertainment | 2 | $115B |
|
||
| Pharmaceuticals / Biotech | 2 | $62B |
|
||
Price history
+144.4% since first listed11 events — show timeline
- 2026-05-07 Price Changed $132,000 CRMLS
- 2026-04-27 Price Changed $137,999 CRMLS
- 2026-04-17 Listed $145,000 CRMLS
- 2021-10-13 Sold (MLS) $90,000 SDMLS
- 2021-09-25 Pending — SDMLS
- 2021-08-25 Price Changed $92,500 SDMLS
- 2021-08-05 Listed $99,500 SDMLS
- 2007-12-31 Listing Removed — SDMLS
- 2007-12-31 Listing Removed — CRMLS
- 2007-06-20 Listed $54,000 SDMLS
- 2007-06-20 Listed $54,000 CRMLS
Cash-flow waterfall
monthlySold comps — $/sqft
last 12 mo · ≤1 miLoading sold comps…