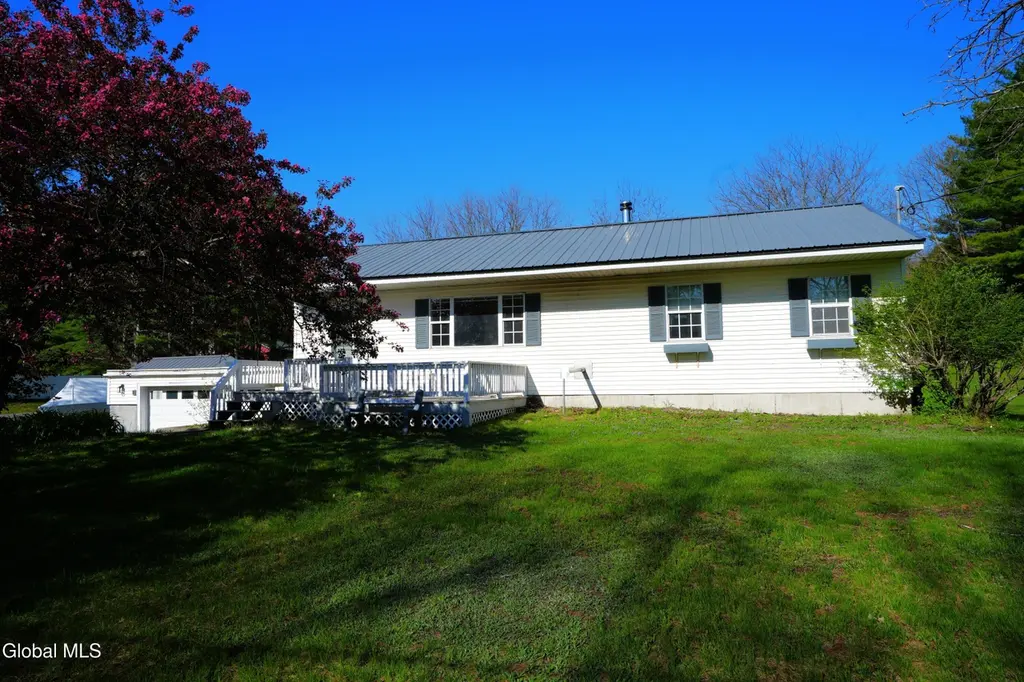
301 Bemis Rd · Mayfield, NY
Flood risk 1/10 · Minimal
- FEMA flood zone
- X
- Chance of flooding over 30 yrs
- 0.0%
- Est. flood insurance / yr
- $473 – $860
Fire risk 2/10 · Minimal
- Est. fire insurance / yr
- $691 – $1,283
Heat risk 2/10 · Minimal
- Hot days now (above 94°F)
- 7 days/yr
- Hot days in 30 yrs
- 17 days/yr
Wind risk 2/10 · Minimal
- Chance of severe wind over 30 yrs
- 3.0%
Air-quality risk 1/10 · Minimal
- Unhealthy air days now
- 0 days/yr
- Unhealthy air days in 30 yrs
- 0 days/yr
Risk factors via First Street. Map © Google.
Why this score? — see what drove the D grade
The composite is a weighted blend of 9 inputs, each scored 0–100. Each bar is that input's sub-score; the figure is the points it added to the 100-point composite (weight × sub-score).
- ARV discount +15.0/15.0
- Appreciation +10.0/10.0
- Schools +4.2/10.0
- Cash flow +3.9/30.0
- Livability +3.3/5.0
- Rent growth +2.5/5.0
- Condition / age +2.5/5.0
- 1% rule +0.2/10.0
- DSCR +0.0/10.0
$240,000
🖨 Deal sheet (PDF) 📄 Offer letter ✓ Due diligence
Listing remarks MLS
You can move right into this well maintained ranch in the sought after Mayfield area. Clean & bright with an open living area. Large eat in kitchen with pantry and laundry room. Formal dining, living room with pellet stove...very efficient. 2 bedrooms, full bath plus partial bath coming in from garage & back door. The garage has plenty of room and the lower level basement has room for expansion...previously a large family room...needs some updating. Very Good Condition
Key facts
- Quiet road
- Recent updates
- Extra storage
Tags
Property features AI
Exterior
- Parking: Two-car garage; Space for up to 6 vehicles total
- Utilities: Septic tank
- Home design: Single-family residence; 1,200 living area
- Construction: Vinyl siding; Metal roof; Full basement
- Exterior features: Deck; Patio; Shed(s)
Interior
- Kitchen: Microwave; Range; Refrigerator
- Bedrooms: Two first-floor bedrooms
- Bathrooms: One full bathroom on the first floor; One half bathroom on the first floor
- Heating & cooling: Forced air heating; Electric heating; Oil heating; Pellet stove supplemental heat; Central air conditioning
- Interior features: Pellet stove; Water softener; 5 total rooms
- Laundry & utility: Laundry closet; Washer/Dryer included
Neighborhood map
What this means for you Summary
Snapshot
- This is a 2-bed/1.0-bath single-family listed at $240k.
Deal economics
- At list price, monthly cash flow is $-688 ($-8k/yr) — negative.
- To cash-flow at today's rent, offer at most $118k (50.6% below list).
- To meet the 1% rule (rent ≥ 1% of price), the offer needs to be $125k (48.0% below list).
- Recommended offer: $118k (50.6% below list) — sets the bar for cash-flow.
Location & tenants
- Location reads 66/100 on livability (#634 in NY) — a middle-class / working-renter tenant base. Strengths: housing A+, health & safety A, cost of living A-; Watch: crime F, amenities F, commute F.
- Mayfield Central School District (town): math 42% / reading 56% proficiency, ranked #400 of 590 in NY (top 68%) — families likely to look elsewhere, expect single-tenant / working-renter base with shorter leases.
- Zoned schools: Mayfield Elementary School (math 36% / reading 62%, grade D, #1,177 of 2,108 statewide, top 56%, 430 students, 0% FRL); Mayfield Jr/Sr High School (math 52% / reading 42%, grade D-, #1,007 of 1,100 statewide, top 93%, 400 students, 48% FRL).
- Market conditions: 173 active listings in the ZIP; 112 units permitted in Fulton County in 2024 (50 in 5+ unit buildings).
Forward outlook
- In year one you build about $26k of equity ($2k loan paydown + $24k appreciation (10.0% local appreciation)).
- Fulton County population projected at -23% by 2050 — secular population decline; favor cash flow + early exit over multi-decade hold.
- By year 2, paydown + projected appreciation supports a ~$41k cash-out refi (75% LTV) — recoverable capital for the next deal without selling this one.
Negotiation context
- Only 13 days on market — expect competitive offers; lowballing is unlikely to land.
- 2 sale attempts since 10y ago with the ask held roughly flat each time — persistent listings suggest the price (not the market) is what's stuck; bring a comps-based counter.
- Current owner paid $135k; list at $240k implies a 78% gain — meaningful room to come down on a strong offer.
Questions for the listing agent
- What do current leases actually rent for vs. the listed asking? Can we see a recent rent roll and the last 12 months of T-12 income?
- Built in 1979 — when were the roof, HVAC, electrical panel, plumbing, and water heater last replaced?
- Is there a deadline driving the sale (1031 exchange, divorce, estate, relocation)? That informs how much negotiation room exists.
- Crime grade is F in this area — have there been break-ins, vandalism, or insurance claims at this property in the last 3 years? What carrier currently insures it and at what premium?
- The area grade is low — what's the realistic commute time and amenity access for the typical tenant pool here? Any planned neighborhood developments (good or bad) we should know about?
- What's the average days-on-market for RENTAL listings here right now (not sales)? A rising rental-DOM trend means longer vacancies and softer asking-rent achievability than the comps imply.
- What's the recent tenant-quality profile in this submarket — average credit score on applications, eviction rate, late-payment / NSF rate, and stable-employment percentage? A property-management company in the area should have these aggregated.
- How much new for-sale + rental construction is in the pipeline within 1–3 miles? Heavy new supply typically softens prices + rents 12–24 months out; constrained supply supports both.
Investment metrics
- 1% rule
- 0.52% ✗
- Cap rate
- 2.85%
- Cash-on-cash
- -12.28%
- DSCR
- 0.45
- GRM
- 16.0
CMA / ARV
- ARV (median comp)
- $291,000
- List price
- $240,000
- Delta
- -17.53%
- Verdict
- UNDERPRICED
- Comps
- 3 within 1.0 mi
Projected returns pro-forma
10.0% appreciation · 3.0% rent growth · sell at horizon
- IRR
- 15.7%
- Equity multiple
- 2.29×
- Total profit
- $86,929
- Equity at exit
- $216,211
- IRR
- 15.2%
- Equity multiple
- 5.32×
- Total profit
- $290,499
- Equity at exit
- $466,267
Cash invested: $67,200 (down + closing). Projections, not guarantees.
Landlord ↔ Tenant lean methodology
- Overall (STATE)
- 15 Strongly Tenant-Friendly
- State New York
- 15 Strongly Tenant-Friendly · D+10
- County
- — inherits STATE
- City
- — inherits STATE
ZIP-level market 12078
- Home prices YoY
- 12.2%
- Active inventory
- 173
- Price-to-rent
- 16.0×
Monthly cashflow live
- Estimated rent
- $1,249 medium interval (Pro) →
- Mortgage (P&I)
- −$1,259
- Tax from tax record
- −$316 /mo · $3,789/yr
- Insurance
- −$100
- HOA
- −$0
- Vacancy / Maint / Mgmt
- −$262
- Net cashflow
- $-688
Break-even live
Sensitivity live
| Price | -10% $-552 | -5% $-620 | +0% $-688 | +5% $-756 | +10% $-824 |
|---|---|---|---|---|---|
| Rent | -10% $-787 | -5% $-737 | +0% $-688 | +5% $-639 | +10% $-589 |
| Rate | -1.0pp $-567 | -0.5pp $-627 | base $-688 | +0.5pp $-750 | +1.0pp $-813 |
UW: 25.0% down · 7.5% · 30yr · 1.5% tax · 5.0% vac · 8.0% maint · 8.0% mgmt
Financing live
Cash to close
- Down payment
- $60,000
- Closing costs
- $7,200
- Reserves months
- —
- Total cash needed
- —
Loan-product check · same deal, 3 products live
Conventional
25% down · 7.5% · 30yr
- Down + closing
- —
- Monthly P&I
- —
- Monthly cashflow
- —
- DSCR
- —
- Eligible?
- —
Personal DTI + credit; lowest rate.
DSCR
20% down · 8.5% · 30yr
- Down + closing
- —
- Monthly P&I
- —
- Monthly cashflow
- —
- DSCR
- —
- Eligible?
- —
No personal income docs; deal must DSCR.
Hard money
10% down · 12.0% · 12mo
- Down + closing
- —
- Monthly P&I
- —
- Monthly cashflow
- —
- DSCR
- —
- Eligible?
- —
Short-term bridge; refi at stabilization.
Listing history 7 events
-
2026-05-08$240,000 Active 489-char remark
-
2016-07-20soldstatus $135,000
-
2016-07-01soldstatus $135,000 Closed (Final Sale) 486-char remark
Show marketing remark (486 chars)
You can move right into this well maintained ranch in the sought after Mayfield area. Clean & bright with an open living area. Large eat in kitchen with pantry and laundry room. Formal dining, living room with pellet stove...very efficient. 2 bedrooms, full bath plus partial bath coming in from garage & back door. The garage has plenty of room and the lower level basement has room for expansion...previously a large family room...needs some updating. Very Good Condition
-
2016-05-12status Pend (Under Cntr) 486-char remark
Show marketing remark (486 chars)
You can move right into this well maintained ranch in the sought after Mayfield area. Clean & bright with an open living area. Large eat in kitchen with pantry and laundry room. Formal dining, living room with pellet stove...very efficient. 2 bedrooms, full bath plus partial bath coming in from garage & back door. The garage has plenty of room and the lower level basement has room for expansion...previously a large family room...needs some updating. Very Good Condition
-
2016-03-28$145,000 New 486-char remark
Show marketing remark (486 chars)
You can move right into this well maintained ranch in the sought after Mayfield area. Clean & bright with an open living area. Large eat in kitchen with pantry and laundry room. Formal dining, living room with pellet stove...very efficient. 2 bedrooms, full bath plus partial bath coming in from garage & back door. The garage has plenty of room and the lower level basement has room for expansion...previously a large family room...needs some updating. Very Good Condition
-
2005-10-17soldstatus $102,000
-
1999-07-27soldstatus $76,000
ⓘ Source: listings_history table (triggers on properties + properties_extension) + one-shot
backfill from property_details.listing_events for pre-trigger history.
Tax reassessment forecast NY · Partial reset (capped growth)
- Current annual tax
- $3,789 · $316/mo
- Projected year-2 tax
- $3,922 · $327/mo
- Expected delta
- +$134/yr (+$11/mo · 3.5%)
ⓘ Screening estimate from a state-policy table — verify with the county assessor before closing.
Climate risk First Street
- Flood 1/10 Low FEMA zone X · 0% chance over 30 yrs
- Wildfire 2/10 Low
- Heat 2/10 Low 7 d/yr ≥94°F today · 17 d/yr by 30 yrs out
- Wind 2/10 Low 3% chance of damaging wind over 30 yrs
- Air quality 1/10 Low 0 unhealthy d/yr today · 0 by 30 yrs out
Nearby sold comps map
Loading sold comps map…
Walkable amenities ~0.75 mi
Loading nearby amenities…
Taxation est. · year 1
- Rental income
- $14,984
- − Mortgage interest
- −$13,444
- − Property taxes
- −$3,789
- − Insurance
- −$1,200
- − Repairs & maintenance
- −$1,199
- − Management
- −$1,199
- − Depreciation
- −$6,982
- Taxable loss
- −$12,828
- Est. tax savings @ 24.0%
- +$3,079
- After-tax cash flow
- $-5,176/yr
For passive investors: Depreciation is non-cash, so a rental often shows a tax loss while cash-flowing — sheltering income. Rental losses are passive: they offset passive income freely, and up to $25,000/yr can offset ordinary (W-2) income if you actively participate and your MAGI is under $100k (phasing out to $0 by $150k); unused losses carry forward. On sale, claimed depreciation is recaptured at up to 25%, and gains may owe capital-gains tax (a 1031 exchange can defer both). Figures are a year-1 estimate at your 24.0% rate — not tax advice; consult a CPA.
Schools (NCES district)
- District
- Mayfield Central School District
- NCES district ID
- 3618750
- Math proficiency
- 42% ▼ -11.00%
- Reading proficiency
- 56% ▲ 5.00%
- Median HH income
- $51,922
- Composite
- 42.08/100
- National rank
- #3322
- State rank
- #400 of 590 in NY
Livability — Mayfield
- Score
- 66/100
- State rank
- #634
- US rank
- #11697
Category grades
Schools grade is shown separately in the Schools card above.
Census & demographics
- Population (ZIP)
- 23,087
Population outlook (Fulton County) Hauer SSP2
- Today (2025)
- 51,132 people
- By 2030
- 49,114 · -3.9%
- By 2040
- 44,373 · -13.2%
- By 2050
- 39,321 · -23.1%
- By 2075
- 28,503 · -44.3%
- By 2100
- 19,268 · -62.3%
Race, ethnicity, and origin ACS 2023
- Neighborhood character
- Predominantly White (86%)
- Race & ethnicity
- White 86% Two or more races 8% Hispanic / Latino 5% Black 2% Asian 1%
- Hispanic origin (detail)
- Puerto Rican 3%
- Common ancestry
- Lithuanian 5% Romanian 4% Iranian 4%
- Foreign-born
- 2% · Canada, China
- Languages at home
- 97% English-only · Spanish 2%
Political lean MEDSL · Fulton
- 2024 margin
- Solid R (+35.9) · D 32.1% · R 67.9%
- 2008→2024 swing
- -26.6pp toward R · 2008: -9.2pp · 2024: -35.9pp
- All cycles
- 2024: R+35.9 2020: R+31.4 2016: R+35.5 2012: R+10.5 2008: R+9.2
Not yet ingested
- Civics
- —
Market trends
- HPI YoY
- ▲ 34.22%
- Current HPI
- 315.1368
- Rent YoY
- —
- Metro
- —
- State GDP YoY
- ▲ 2.60%
- F500 in state
- 92
Industry mix (Fortune 500 HQ in NY)
| Industry | F500 HQs | Revenue |
|---|---|---|
| Financial Services | 10 | $950B |
|
||
| Consumer Goods | 9 | $162B |
|
||
| Insurance | 4 | $225B |
|
||
| Telecommunications | 2 | $144B |
|
||
| Pharmaceuticals | 2 | $112B |
|
||
| Media / Entertainment | 2 | $69B |
|
||
Price history
+215.8% since first listed8 events — show timeline
- 2026-05-21 Pending — Global MLS
- 2026-05-08 Listed $240,000 Global MLS
- 2016-07-20 Sold (Public Records) $135,000 Public Records
- 2016-07-01 Sold (MLS) $135,000 Global MLS
- 2016-05-12 Pending — Global MLS
- 2016-03-28 Listed $145,000 Global MLS
- 2005-10-17 Sold (Public Records) $102,000 Public Records
- 1999-07-27 Sold (Public Records) $76,000 Public Records
Property tax history
+6.1%/yrLatest (2025): $3,789 · +5.1% YoY. Source: county tax records.
Cash-flow waterfall
monthlySold comps — $/sqft
last 12 mo · ≤1 miLoading sold comps…