 Multi-family
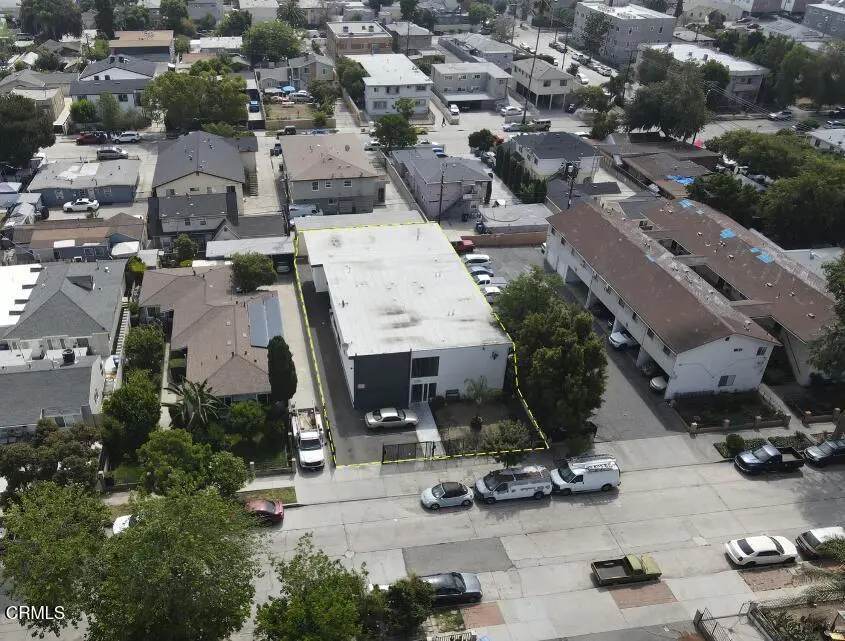
6722 Troost Ave · Los Angeles, CA
Flood risk 4/10 · Minor
- FEMA flood zone
- X (unshaded)
- Chance of flooding over 30 yrs
- 0.22%
- Est. flood insurance / yr
- $507 – $1,088
Fire risk 1/10 · Minimal
- Est. fire insurance / yr
- $659 – $1,223
Heat risk 6/10 · Moderate
- Hot days now (above 96°F)
- 7 days/yr
- Hot days in 30 yrs
- 21 days/yr
Wind risk 1/10 · Minimal
- Chance of severe wind over 30 yrs
- —
Air-quality risk 5/10 · Moderate
- Unhealthy air days now
- 7 days/yr
- Unhealthy air days in 30 yrs
- 9 days/yr
Risk factors via First Street. Map © Google.
Why this score? — see what drove the C+ grade
The composite is a weighted blend of 9 inputs, each scored 0–100. Each bar is that input's sub-score; the figure is the points it added to the 100-point composite (weight × sub-score).
- Cash flow +27.4/30.0
- DSCR +9.6/10.0
- 1% rule +7.2/10.0
- ARV discount +5.0/15.0
- Schools +3.6/10.0
- Livability +3.4/5.0
- Condition / age +2.5/5.0
- Rent growth +1.7/5.0
- Appreciation +0.0/10.0
$1,750,000
🖨 Deal sheet 📄 Offer letter ✓ Due diligence
Multi-family units
County records classify this as Multi-Family (5+ Unit). Listing-text estimate: 1 unit. estimate disagrees with records
5+ unit building — per-unit beds/baths from public records are typically unavailable; the breakdown below (if shown) is an estimate from the listing text.
Listing remarks MLS
Ten-unit value-add opportunity in the heart of North Hollywood with approximately 42% loss-to-lease achievable through renovations. Built in 1964, the property features a 6,766 SF building situated on a 7,801 SF lot. The unit mix consists of (3) 2 Bed / 2 Bath, (3) 1 Bed / 1 Bath, (2) Studio / 1 Bath, and (2) Single / 1 Bath -- providing diverse rental price points and broad tenant demand. The seismic retrofit has been completed with a certificate of compliance issued, removing a major capital and compliance hurdle for incoming ownership. The property includes nine parking spaces in the front and rear, plus an on-site laundry room and parking rent that generate additional ancillary income. Located on a great street within walking distance of the NoHo Arts District, Metro B Line, and the Burbank media employment corridor, 6722 Troost Avenue offers strong in-place fundamentals with substantial mark-to-market upside in one of the San Fernando Valley's most active rental submarkets. North Hollywood is one of the most dynamic rental submarkets in the San Fernando Valley, anchored by the NoHo Arts District -- a cultural hub home to more than 20 professional theaters, galleries, restaurants, breweries, and boutique retail along Lankershim and Magnolia Boulevards. Transit access is a defining advantage of the area. The North Hollywood Metro Station is the terminus of the B Line (Red Line) subway, offering direct service to Hollywood, Universal City, and Downtown Los Angeles, and connects to the G Line (Orange) busway across the Valley. The forthcoming East San Fernando Valley Light Rail and the transformative District NoHo -- a 15-acre transit-oriented development bringing 1,500+ residential units, office, and retail to the station -- are expected to materially lift values and rental demand throughout the trade area. The submarket also benefits from its proximity to the Burbank Media District -- home to Warner Bros. , Disney, and NBCUniversal -- and quick access to the 170, 134, 101, and 5 freeways, placing tenants within a short commute of Downtown LA, the Westside, Glendale, and Pasadena. Strong renter demographics and a persistent supply-demand imbalance have supported consistent rent growth across both renovated and classic product.
Key facts
- Nine parking spaces
- On-site laundry room
- Transit access
Tags
Neighborhood map
What this means for you Summary
Snapshot
- This is a 9-bed/13.0-bath multifamily listed at $1.75M.
Deal economics
- At list price, monthly cash flow is $5k ($62k/yr) — positive.
- The deal already cash-flows at list — no discount required.
- Meets the 1% rule at list price ($21k rent vs $1.75M).
- Recommended offer: $1.70M (3.0% below list) — sets the bar for market timing.
- Cap rate 9.8% vs local median 2.1% in Los Angeles — top-decile yield for the area; either an underpriced asset or a hidden risk that comps aren't pricing in. Stress-test before assuming the spread holds.
Location & tenants
- Location reads 68/100 on livability (#273 in CA) — a middle-class / working-renter tenant base. Strengths: amenities A+, commute A+, employment B; Watch: health & safety C-, schools D+, crime F.
- Los Angeles Unified (urban): math 29% / reading 54% proficiency, ranked #223 of 517 in CA (top 43%) — families likely to look elsewhere, expect single-tenant / working-renter base with shorter leases; 67% free/reduced lunch — lower-income household profile, screen leases tightly.
- Market conditions: Rents falling (-3.1%/yr); 98 active listings in the ZIP; 19,697 units permitted in Los Angeles County in 2024 (9,426 in 5+ unit buildings).
- At $21,309/mo this rent would consume 386% of the median local household income ($66k/yr) (locally 3946% of renters already pay >50% of income on rent) — very limited rent-growth headroom before tenants either downsize or default.
Forward outlook
- Local home prices are declining (-3.0%/yr); year-one equity from $12k of loan paydown is wiped out by about $52k of value loss. Plan a longer hold.
- Los Angeles County population projected at +9% by 2050 — modest demand growth; plan on rents tracking national, not racing it.
Negotiation context
- It's been on market 38 days — a 3% lower offer ($1.70M) is reasonable based on typical stale-listing flexibility.
- 3 sale attempts since 9y ago with the ask held roughly flat each time — persistent listings suggest the price (not the market) is what's stuck; bring a comps-based counter.
- Current owner paid $1.50M; 17% above their basis — modest negotiation headroom, anchor on the comps not their cost.
Risks & watch-outs
- Climate carrying-cost: extreme-heat days projected 7→21/yr by 2055 (HVAC capex compounding) — expect insurance premiums to compound above CPI over the hold.
Questions for the listing agent
- It's been on market 38 days. Have you received any prior offers? Is the seller open to a 3% concession, seller financing, or rate buy-down credit?
- Built in 1964 — when were the roof, HVAC, electrical panel, plumbing, and water heater last replaced?
- Is there a deadline driving the sale (1031 exchange, divorce, estate, relocation)? That informs how much negotiation room exists.
- Schools are D-rated, which usually means shorter tenancies and higher turnover. Who's the typical renter profile here, and what's been the actual vacancy rate?
- Crime grade is F in this area — have there been break-ins, vandalism, or insurance claims at this property in the last 3 years? What carrier currently insures it and at what premium?
- What's the average days-on-market for RENTAL listings here right now (not sales)? A rising rental-DOM trend means longer vacancies and softer asking-rent achievability than the comps imply.
- What's the recent tenant-quality profile in this submarket — average credit score on applications, eviction rate, late-payment / NSF rate, and stable-employment percentage? A property-management company in the area should have these aggregated.
- How much new apartment / multifamily construction is in the pipeline within 1–3 miles? Heavy new supply (>2% of stock underway) typically softens rents 12–24 months out; light construction supports rent growth.
Investment metrics
- 1% rule
- 1.22% ✓
- Cap rate
- 9.81%
- Cash-on-cash
- 12.55%
- DSCR
- 1.56
- GRM
- 6.8
CMA / ARV
- ARV (median comp)
- $1,657,436
- List price
- $1,750,000
- Delta
- 5.58%
- Verdict
- FAIR
- Comps
- 20 within 1.0 mi
Show comp detail 1 sale within ~0.75 mi
| Address | Dist | Beds/Ba | Sqft | Sold | Price | $/sf | Match |
|---|---|---|---|---|---|---|---|
| 11763 Hamlin St | 0.33mi | 10/10.0 (+1) | 6,467 (-4%) | 3mo | $1,995,000 | $308 | 58 |
Match score weights: distance 35% · size 25% · config 20% · recency 20%. Top-matched comps best support the ARV.
Projected returns pro-forma
-3.0% appreciation · 0.0% rent growth · sell at horizon
- IRR
- -1.1%
- Equity multiple
- 0.96×
- Total profit
- $-19,454
- Equity at exit
- $260,931
- IRR
- 5.2%
- Equity multiple
- 1.33×
- Total profit
- $162,465
- Equity at exit
- $151,308
Cash invested: $490,000 (down + closing). Projections, not guarantees.
Landlord ↔ Tenant lean methodology
- Overall (CITY)
- 0 Strongly Tenant-Friendly
- State California
- 18 Strongly Tenant-Friendly · D+13
- County
- — inherits STATE
- City Los Angeles
- 0 Strongly Tenant-Friendly · D+22
ZIP-level market 91606
- Rents YoY
- -3.1%
- Active inventory
- 98
- Price-to-rent
- 65.0×
Monthly cashflow live
- Estimated rent
- $21,309 high interval (Pro) →
- Mortgage (P&I)
- −$9,177
- Tax from tax record
- −$1,802 /mo · $21,620/yr
- Insurance
- −$729
- HOA
- −$0
- Vacancy / Maint / Mgmt
- −$4,475
- Net cashflow
- $5,126
Break-even live
10-unit breakdown (identical units grouped — click to expand)
| Units | Beds | Baths | Est. rent |
|---|---|---|---|
| 3× units | 2 | 2 | $6,735 |
| #1 | 2 | 2 | $2,245 |
| #2 | 2 | 2 | $2,245 |
| #3 | 2 | 2 | $2,245 |
| 7× units | 1 | 1 | $14,574 |
| #4 | 1 | 1 | $2,082 |
| #5 | 1 | 1 | $2,082 |
| #6 | 1 | 1 | $2,082 |
| #7 | 1 | 1 | $2,082 |
| #8 | 1 | 1 | $2,082 |
| #9 | 1 | 1 | $2,082 |
| #10 | 1 | 1 | $2,082 |
| Total (10 units) | $21,309 | ||
UW: 25.0% down · 7.5% · 30yr · 1.5% tax · 5.0% vac · 8.0% maint · 8.0% mgmt
Financing live
Cash to close
- Down payment
- $437,500
- Closing costs
- $52,500
- Reserves months
- —
- Total cash needed
- —
Loan-product check · same deal, 3 products live
Conventional
25% down · 7.5% · 30yr
- Down + closing
- —
- Monthly P&I
- —
- Monthly cashflow
- —
- DSCR
- —
- Eligible?
- —
Personal DTI + credit; lowest rate.
DSCR
20% down · 8.5% · 30yr
- Down + closing
- —
- Monthly P&I
- —
- Monthly cashflow
- —
- DSCR
- —
- Eligible?
- —
No personal income docs; deal must DSCR.
Hard money
10% down · 12.0% · 12mo
- Down + closing
- —
- Monthly P&I
- —
- Monthly cashflow
- —
- DSCR
- —
- Eligible?
- —
Short-term bridge; refi at stabilization.
Listing history 27 events
-
2026-06-18days on market $1,750,000 Active 38 DOM
-
2026-06-17pricedays on market $1,750,000 Active 37 DOM
-
2026-06-16days on market $1,800,000 Active 36 DOM
-
2026-06-15days on market $1,800,000 Active 35 DOM
-
2026-06-13days on market $1,800,000 Active 33 DOM
-
2026-06-09days on market $1,800,000 Active 29 DOM
-
2026-06-08days on market $1,800,000 Active 28 DOM
-
2026-06-07days on market $1,800,000 Active 27 DOM
-
2026-06-04days on market $1,800,000 Active 24 DOM
-
2026-06-03days on market $1,800,000 Active 23 DOM
-
2026-06-02days on market $1,800,000 Active 22 DOM
-
2026-06-01days on market $1,800,000 Active 21 DOM
-
2026-05-31days on market $1,800,000 Active 20 DOM
-
2026-05-11$1,800,000 Active 2268-char remark
Show marketing remark (2268 chars)
Ten-unit value-add opportunity in the heart of North Hollywood with approximately 42% loss-to-lease achievable through renovations. Built in 1964, the property features a 6,766 SF building situated on a 7,801 SF lot. The unit mix consists of (3) 2 Bed / 2 Bath, (3) 1 Bed / 1 Bath, (2) Studio / 1 Bath, and (2) Single / 1 Bath -- providing diverse rental price points and broad tenant demand. The seismic retrofit has been completed with a certificate of compliance issued, removing a major capital and compliance hurdle for incoming ownership. The property includes nine parking spaces in the front and rear, plus an on-site laundry room and parking rent that generate additional ancillary income. Located on a great street within walking distance of the NoHo Arts District, Metro B Line, and the Burbank media employment corridor, 6722 Troost Avenue offers strong in-place fundamentals with substantial mark-to-market upside in one of the San Fernando Valley's most active rental submarkets. North Hollywood is one of the most dynamic rental submarkets in the San Fernando Valley, anchored by the NoHo Arts District -- a cultural hub home to more than 20 professional theaters, galleries, restaurants, breweries, and boutique retail along Lankershim and Magnolia Boulevards. Transit access is a defining advantage of the area. The North Hollywood Metro Station is the terminus of the B Line (Red Line) subway, offering direct service to Hollywood, Universal City, and Downtown Los Angeles, and connects to the G Line (Orange) busway across the Valley. The forthcoming East San Fernando Valley Light Rail and the transformative District NoHo -- a 15-acre transit-oriented development bringing 1,500+ residential units, office, and retail to the station -- are expected to materially lift values and rental demand throughout the trade area. The submarket also benefits from its proximity to the Burbank Media District -- home to Warner Bros. , Disney, and NBCUniversal -- and quick access to the 170, 134, 101, and 5 freeways, placing tenants within a short commute of Downtown LA, the Westside, Glendale, and Pasadena. Strong renter demographics and a persistent supply-demand imbalance have supported consistent rent growth across both renovated and classic product.
-
2018-06-26soldstatus $1,500,000
-
2018-06-25soldstatus $1,500,000 513-char remark
Show marketing remark (513 chars)
BEST $/UNIT, GRM & CAP IN THIS MARKET! Troost Apartments is a well built 10-unit apartment building located in North Hollywood, California. Set on a 7,802 square foot lot, the 6,766 square foot property offers studio, singles, one- and two-bedroom apartment homes. Built in 1964, the property offers great rental upside, in an excellent rental market, low maintenance, and easy freeway access. Troost Apartments is located along the east side of Troost Avenue between Vanowen Street north and Kittridge Street
-
2018-06-25soldstatus $1,500,000 Closed Sale
Show marketing remark (513 chars)
BEST $/UNIT, GRM & CAP IN THIS MARKET! Troost Apartments is a well built 10-unit apartment building located in North Hollywood, California. Set on a 7,802 square foot lot, the 6,766 square foot property offers studio, singles, one- and two-bedroom apartment homes. Built in 1964, the property offers great rental upside, in an excellent rental market, low maintenance, and easy freeway access. Troost Apartments is located along the east side of Troost Avenue between Vanowen Street north and Kittridge Street
-
2018-04-24status Pending Sale
-
2018-04-05price $1,550,000
-
2018-02-14price $1,595,000
-
2017-11-20$1,550,000 513-char remark
Show marketing remark (513 chars)
BEST $/UNIT, GRM & CAP IN THIS MARKET! Troost Apartments is a well built 10-unit apartment building located in North Hollywood, California. Set on a 7,802 square foot lot, the 6,766 square foot property offers studio, singles, one- and two-bedroom apartment homes. Built in 1964, the property offers great rental upside, in an excellent rental market, low maintenance, and easy freeway access. Troost Apartments is located along the east side of Troost Avenue between Vanowen Street north and Kittridge Street
-
2017-11-20$1,650,000 Active
Show marketing remark (513 chars)
BEST $/UNIT, GRM & CAP IN THIS MARKET! Troost Apartments is a well built 10-unit apartment building located in North Hollywood, California. Set on a 7,802 square foot lot, the 6,766 square foot property offers studio, singles, one- and two-bedroom apartment homes. Built in 1964, the property offers great rental upside, in an excellent rental market, low maintenance, and easy freeway access. Troost Apartments is located along the east side of Troost Avenue between Vanowen Street north and Kittridge Street
-
2015-11-24soldstatus $1,277,000
-
2009-03-31soldstatus $835,000
-
2007-01-08soldstatus $935,000
-
1996-07-22soldstatus $335,000
-
1985-11-01soldstatus $360,000
ⓘ Source: listings_history table (triggers on properties + properties_extension) + one-shot
backfill from property_details.listing_events for pre-trigger history.
Tax reassessment forecast CA · Resets to sale price
- Current annual tax
- $21,620 · $1,802/mo
- Projected year-2 tax
- $21,620 · $1,802/mo
- Expected delta
- $0/yr ($0/mo · 0.0%)
ⓘ Screening estimate from a state-policy table — verify with the county assessor before closing.
Climate risk First Street
- Flood 4/10 Moderate FEMA zone X (unshaded) · 22% chance over 30 yrs
- Wildfire 1/10 Low
- Heat 6/10 Major 7 d/yr ≥96°F today · 21 d/yr by 30 yrs out
- Wind 1/10 Low
- Air quality 5/10 Major 7 unhealthy d/yr today · 9 by 30 yrs out
Nearby sold comps map
Loading sold comps map…
Walkable amenities ~0.75 mi
Loading nearby amenities…
Taxation est. · year 1
- Rental income
- $255,708
- − Mortgage interest
- −$98,027
- − Property taxes
- −$21,620
- − Insurance
- −$8,750
- − Repairs & maintenance
- −$20,457
- − Management
- −$20,457
- − Depreciation
- −$50,909
- Taxable income
- $35,489
- Est. tax owed @ 24.0%
- −$8,517
- After-tax cash flow
- $52,996/yr
For passive investors: Depreciation is non-cash, so a rental often shows a tax loss while cash-flowing — sheltering income. Rental losses are passive: they offset passive income freely, and up to $25,000/yr can offset ordinary (W-2) income if you actively participate and your MAGI is under $100k (phasing out to $0 by $150k); unused losses carry forward. On sale, claimed depreciation is recaptured at up to 25%, and gains may owe capital-gains tax (a 1031 exchange can defer both). Figures are a year-1 estimate at your 24.0% rate — not tax advice; consult a CPA.
Schools (NCES district)
- District
- Los Angeles Unified
- NCES district ID
- 0622710
- Math proficiency
- 29% ▼ -4.00%
- Reading proficiency
- 54% ▲ 10.00%
- Median HH income
- $50,403
- Composite
- 35.67/100
- National rank
- #4875
- State rank
- #223 of 517 in CA
Livability — Los Angeles
- Score
- 68/100
- State rank
- #273
- US rank
- #9237
Category grades
Schools grade is shown separately in the Schools card above.
Census & demographics
- Census place
- Los Angeles, CA
- County
- Los Angeles County · 9,444,647 people
- City population
- 3,838,149
- Metro
- Los Angeles-Long Beach-Anaheim, CA
- Population (ZIP)
- 43,559
- Household income
- $66,200
- Rent vs Own
- Severe rent burden
- 3946.0
Population outlook (Los Angeles County) Hauer SSP2
- Today (2025)
- 10,940,515 people
- By 2030
- 11,256,481 · +2.9%
- By 2040
- 11,729,929 · +7.2%
- By 2050
- 11,948,407 · +9.2%
- By 2075
- 11,818,114 · +8.0%
- By 2100
- 10,842,928 · -0.9%
Race, ethnicity, and origin ACS 2023
- Neighborhood character
- Diverse neighborhood (Simpson 0.60)
- Race & ethnicity
- Hispanic / Latino 53% White 33% Two or more races 19% Asian 5% Black 5% Native American 1%
- Hispanic origin (detail)
- Mexican 28%
- Common ancestry
- Scotch-Irish 2% Romanian 1% Subsaharan African 1%
- Foreign-born
- 43% · Canada, Vietnam, Jamaica
- Languages at home
- 32% English-only · Spanish 47% Other Indo-European 12% Russian/Polish/Slavic 3%
Political lean MEDSL · Los Angeles
- 2024 margin
- Solid D (+32.9) · D 64.8% · R 31.9% · Other 3.3%
- 2008→2024 swing
- -7.4pp toward R · 2008: 40.4pp · 2024: 32.9pp
- All cycles
- 2024: D+32.9 2020: D+44.2 2016: D+48.0 2012: D+40.0 2008: D+40.4
Not yet ingested
- Civics
- —
Market trends
- HPI YoY
- ▼ -1100.02%
- Current HPI
- 493.8996
- Rent YoY
- ▼ -3.12%
- Metro
- Los Angeles-Long Beach-Anaheim, CA
- State GDP YoY
- ▲ 3.21%
- F500 in state
- 116
Industry mix (Fortune 500 HQ in CA)
| Industry | F500 HQs | Revenue |
|---|---|---|
| Technology | 27 | $1,492B |
|
||
| Financial Services | 3 | $174B |
|
||
| Retail | 3 | $44B |
|
||
| Insurance | 3 | $26B |
|
||
| Media / Entertainment | 2 | $115B |
|
||
| Pharmaceuticals / Biotech | 2 | $62B |
|
||
Price history
+400.0% since first listed14 events — show timeline
- 2026-05-11 Listed $1,800,000 CRMLS
- 2018-06-26 Sold (Public Records) $1,500,000 Public Records
- 2018-06-25 Sold (MLS) $1,500,000 CRMLS
- 2018-06-25 Sold (MLS) $1,500,000 SDMLS
- 2018-04-24 Pending — CRMLS
- 2018-04-05 Price Changed $1,550,000 CRMLS
- 2018-02-14 Price Changed $1,595,000 CRMLS
- 2017-11-20 Listed $1,650,000 CRMLS
- 2017-11-20 Listed $1,550,000 SDMLS
- 2015-11-24 Sold (Public Records) $1,277,000 Public Records
- 2009-03-31 Sold (Public Records) $835,000 Public Records
- 2007-01-08 Sold (Public Records) $935,000 Public Records
- 1996-07-22 Sold (Public Records) $335,000 Public Records
- 1985-11-01 Sold (Public Records) $360,000 Public Records
Property tax history
+3.4%/yrLatest (2025): $21,620 · +1.3% YoY. Source: county tax records.
Cash-flow waterfall
monthlySold comps — $/sqft
last 12 mo · ≤1 miLoading sold comps…