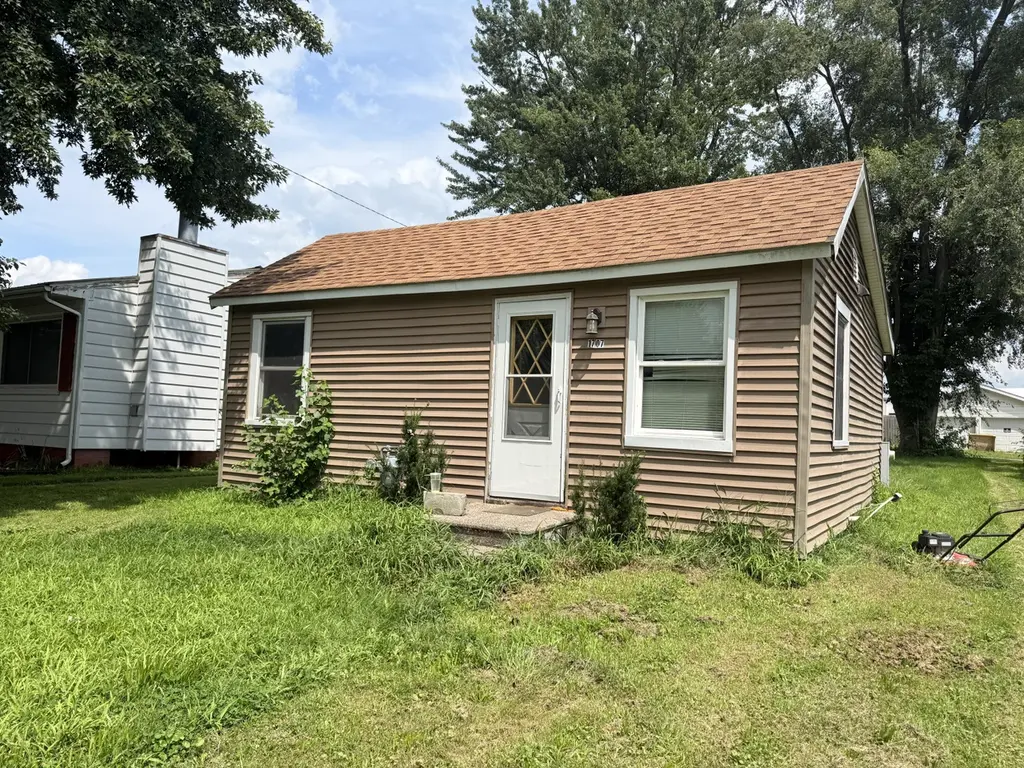
1707 Lincoln Blvd · Muscatine, IA
Flood risk 1/10 · Minimal
- FEMA flood zone
- X (unshaded)
- Chance of flooding over 30 yrs
- 0.0%
- Est. flood insurance / yr
- $473 – $860
Fire risk 3/10 · Minor
- Est. fire insurance / yr
- $902 – $1,676
Heat risk 3/10 · Minor
- Hot days now (above 105°F)
- 7 days/yr
- Hot days in 30 yrs
- 16 days/yr
Wind risk 2/10 · Minimal
- Chance of severe wind over 30 yrs
- —
Air-quality risk 2/10 · Minimal
- Unhealthy air days now
- 2 days/yr
- Unhealthy air days in 30 yrs
- 2 days/yr
Risk factors via First Street. Map © Google.
Why this score? — see what drove the C grade
The composite is a weighted blend of 9 inputs, each scored 0–100. Each bar is that input's sub-score; the figure is the points it added to the 100-point composite (weight × sub-score).
- Cash flow +23.8/30.0
- DSCR +7.7/10.0
- ARV discount +7.5/15.0
- 1% rule +6.9/10.0
- Schools +4.9/10.0
- Livability +3.5/5.0
- Rent growth +2.5/5.0
- Condition / age +2.5/5.0
- Appreciation +0.0/10.0
$74,999
🖨 Deal sheet 📄 Offer letter ✓ Due diligence
Listing remarks MLS
2 bedroom, 1 bath home selling AS-IS. Main floor laundry. Large yard with alley access. Convenient location near schools and shopping.
Key facts
- 5,663 sq ft lot
- Built 1940
- Listed 87 days
Neighborhood map
What this means for you Summary
Snapshot
- This is a 2-bed/1.0-bath single-family listed at $75k.
Deal economics
- At list price, monthly cash flow is $144 ($2k/yr) — positive.
- The deal already cash-flows at list — no discount required.
- Meets the 1% rule at list price ($895 rent vs $75k).
- Recommended offer: $70k (6.0% below list) — sets the bar for market timing.
Location & tenants
- Location reads 70/100 on livability (#358 in IA) — a middle-class / working-renter tenant base. Strengths: cost of living A+, housing A+, crime B; Watch: health & safety D+, amenities F, commute F.
- Muscatine Community School District (town): math 55% / reading 59% proficiency, ranked #257 of 289 in IA (top 89%) — acceptable for families but not a draw, mixed tenant base, ~2y average lease.
- Market conditions: 188 active listings in the ZIP; 4 comparable units currently listed for rent nearby; rentals leasing fast (median 14d on market — plan ~1-2 weeks tenant-placement turnaround); 65 units permitted in Muscatine County in 2024 (45 in 5+ unit buildings).
Forward outlook
- Local home prices are declining (-3.0%/yr); year-one equity from $518 of loan paydown is wiped out by about $2k of value loss. Plan a longer hold.
- Muscatine County population projected at +8% by 2050 — modest demand growth; plan on rents tracking national, not racing it.
Negotiation context
- It's been on market 87 days — a 6% lower offer ($70k) is reasonable based on typical stale-listing flexibility.
- Current owner paid $32k; list at $75k implies a 134% gain — meaningful room to come down on a strong offer.
Risks & watch-outs
- Watch-outs: built in 1940 — expect roof / HVAC / electrical / plumbing capex.
Questions for the listing agent
- It's been on market 87 days. Have you received any prior offers? Is the seller open to a 6% concession, seller financing, or rate buy-down credit?
- Built in 1940 — when were the roof, HVAC, electrical panel, plumbing, and water heater last replaced?
- Why hasn't it sold? Are there any deal-killer items the seller is aware of (foundation, flood, title, zoning, code violations)?
- Is there a deadline driving the sale (1031 exchange, divorce, estate, relocation)? That informs how much negotiation room exists.
- What's the average days-on-market for RENTAL listings here right now (not sales)? A rising rental-DOM trend means longer vacancies and softer asking-rent achievability than the comps imply.
- What's the recent tenant-quality profile in this submarket — average credit score on applications, eviction rate, late-payment / NSF rate, and stable-employment percentage? A property-management company in the area should have these aggregated.
- How much new for-sale + rental construction is in the pipeline within 1–3 miles? Heavy new supply typically softens prices + rents 12–24 months out; constrained supply supports both.
Investment metrics
- 1% rule
- 1.19% ✓
- Cap rate
- 8.59%
- Cash-on-cash
- 8.22%
- DSCR
- 1.37
- GRM
- 7.0
CMA / ARV
No comps found within radius.
Projected returns pro-forma
-3.0% appreciation · 3.0% rent growth · sell at horizon
- IRR
- -3.7%
- Equity multiple
- 0.86×
- Total profit
- $-2,949
- Equity at exit
- $11,183
- IRR
- 6.0%
- Equity multiple
- 1.45×
- Total profit
- $9,398
- Equity at exit
- $6,485
Cash invested: $21,000 (down + closing). Projections, not guarantees.
Landlord ↔ Tenant lean methodology
- Overall (STATE)
- 83 Strongly Landlord-Friendly
- State Iowa
- 83 Strongly Landlord-Friendly · R+6
- County
- — inherits STATE
- City
- — inherits STATE
ZIP-level market 52761
- Active inventory
- 188
- Price-to-rent
- 7.0×
Monthly cashflow live
- Estimated rent
- $895 medium interval (Pro) →
- Mortgage (P&I)
- −$393
- Tax from tax record
- −$138 /mo · $1,659/yr
- Insurance
- −$31
- HOA
- −$0
- Vacancy / Maint / Mgmt
- −$188
- Net cashflow
- $144
Break-even live
UW: 25.0% down · 7.5% · 30yr · 1.5% tax · 5.0% vac · 8.0% maint · 8.0% mgmt
Financing live
Cash to close
- Down payment
- $18,750
- Closing costs
- $2,250
- Reserves months
- —
- Total cash needed
- —
Loan-product check · same deal, 3 products live
Conventional
25% down · 7.5% · 30yr
- Down + closing
- —
- Monthly P&I
- —
- Monthly cashflow
- —
- DSCR
- —
- Eligible?
- —
Personal DTI + credit; lowest rate.
DSCR
20% down · 8.5% · 30yr
- Down + closing
- —
- Monthly P&I
- —
- Monthly cashflow
- —
- DSCR
- —
- Eligible?
- —
No personal income docs; deal must DSCR.
Hard money
10% down · 12.0% · 12mo
- Down + closing
- —
- Monthly P&I
- —
- Monthly cashflow
- —
- DSCR
- —
- Eligible?
- —
Short-term bridge; refi at stabilization.
Rent comps 4 comps
| Address | Beds | Baths | Sqft | Rent | $/sqft | DOM | Units | Dist |
|---|---|---|---|---|---|---|---|---|
| 158 Colorado St Muscatine, IA | 2.0–4.0 | 2.0–4.0 | 625 | $1,075 | $1.72 | 13d | 14 | 0.45mi |
| 2111 Bidwell Rd Muscatine, IA | 2.0 | 1.0 | 564 | $835 | $1.48 | 13d | 1 | 0.72mi |
| 108 Park Ave Muscatine, IA | 1.0 | 1.0 | 628 | $650 | $1.04 | 13d | 1 | 1.23mi |
| 1218 Cedar St #2 Muscatine, IA | 1.0 | 1.0 | 672 | $720 | $1.07 | 44d | 1 | 1.42mi |
Listing history 4 events
-
2026-05-18status Pending 134-char remark
Show marketing remark (134 chars)
2 bedroom, 1 bath home selling AS-IS. Main floor laundry. Large yard with alley access. Convenient location near schools and shopping.
-
2026-02-20status Active 134-char remark
Show marketing remark (134 chars)
2 bedroom, 1 bath home selling AS-IS. Main floor laundry. Large yard with alley access. Convenient location near schools and shopping.
-
2000-04-13soldstatus $32,000
-
1995-04-25soldstatus $26,000 276-char remark
Show marketing remark (276 chars)
126 SQ FT IS LAUNDRY RM W/ CEMENT FLOOR & BSMT STEPS EXPOSED. SHED STAYS. OFF STREET PARKING FRONT & BACK PER COURTHOUSE RECORDS. PORTION OF ROOF REPLACED '93. SOLD ''AS IS''. 1 EXCLUDED BUYER. * APPLIANCES NOT GUARANTEED. 0 POINTS AND CLOSING COSTS PAID BY SELLER
ⓘ Source: listings_history table (triggers on properties + properties_extension) + one-shot
backfill from property_details.listing_events for pre-trigger history.
Tax reassessment forecast IA · Partial reset (capped growth)
- Current annual tax
- $1,659 · $138/mo
- Projected year-2 tax
- $1,659 · $138/mo
- Expected delta
- $0/yr ($0/mo · 0.0%)
ⓘ Screening estimate from a state-policy table — verify with the county assessor before closing.
Climate risk First Street
- Flood 1/10 Low FEMA zone X (unshaded) · 0% chance over 30 yrs
- Wildfire 3/10 Moderate
- Heat 3/10 Moderate 7 d/yr ≥105°F today · 16 d/yr by 30 yrs out
- Wind 2/10 Low
- Air quality 2/10 Low 2 unhealthy d/yr today · 2 by 30 yrs out
Nearby sold comps map
Loading sold comps map…
Walkable amenities ~0.75 mi
Loading nearby amenities…
Taxation est. · year 1
- Rental income
- $10,734
- − Mortgage interest
- −$4,201
- − Property taxes
- −$1,659
- − Insurance
- −$375
- − Repairs & maintenance
- −$859
- − Management
- −$859
- − Depreciation
- −$2,182
- Taxable income
- $600
- Est. tax owed @ 24.0%
- −$144
- After-tax cash flow
- $1,583/yr
For passive investors: Depreciation is non-cash, so a rental often shows a tax loss while cash-flowing — sheltering income. Rental losses are passive: they offset passive income freely, and up to $25,000/yr can offset ordinary (W-2) income if you actively participate and your MAGI is under $100k (phasing out to $0 by $150k); unused losses carry forward. On sale, claimed depreciation is recaptured at up to 25%, and gains may owe capital-gains tax (a 1031 exchange can defer both). Figures are a year-1 estimate at your 24.0% rate — not tax advice; consult a CPA.
Schools (NCES district)
- District
- Muscatine Community School District
- NCES district ID
- 1920130
- Math proficiency
- 55% ▼ -7.00%
- Reading proficiency
- 59% ▲ 2.00%
- Median HH income
- $50,193
- Composite
- 48.6/100
- National rank
- #2110
- State rank
- #257 of 289 in IA
Livability — Muscatine
- Score
- 70/100
- State rank
- #358
- US rank
- #7508
Category grades
Schools grade is shown separately in the Schools card above.
Census & demographics
- Census place
- Muscatine, IA
- City population
- 29,800
- Population (ZIP)
- 29,800
Population outlook (Muscatine County) Hauer SSP2
- Today (2025)
- 44,820 people
- By 2030
- 45,461 · +1.4%
- By 2040
- 46,765 · +4.3%
- By 2050
- 48,609 · +8.5%
- By 2075
- 56,014 · +25.0%
- By 2100
- 63,513 · +41.7%
Race, ethnicity, and origin ACS 2023
- Neighborhood character
- Predominantly White (76%)
- Race & ethnicity
- White 76% Hispanic / Latino 17% Two or more races 5% Black 4%
- Hispanic origin (detail)
- Mexican 13%
- Common ancestry
- Portuguese 2% Romanian 2% Iranian 2%
- Foreign-born
- 7% · Canada
- Languages at home
- 86% English-only · Spanish 11% French/Haitian/Cajun 1% Other Indo-European 1%
Political lean MEDSL · Muscatine
- 2024 margin
- R (+14.9) · D 41.7% · R 56.6% · Other 1.7%
- 2008→2024 swing
- -30.6pp toward R · 2008: 15.7pp · 2024: -14.9pp
- All cycles
- 2024: R+14.9 2020: R+7.0 2016: R+6.6 2012: D+15.5 2008: D+15.7
Not yet ingested
- Civics
- —
Market trends
- HPI YoY
- ▼ -130.30%
- Current HPI
- 182.4493
- Rent YoY
- —
- Metro
- —
- State GDP YoY
- ▲ 2.48%
- F500 in state
- 4
Industry mix (Fortune 500 HQ in IA)
| Industry | F500 HQs | Revenue |
|---|---|---|
| Financial Services | 1 | $16B |
|
||
| Retail / Convenience | 1 | $15B |
|
||
Price history
+23.1% since first listed4 events — show timeline
- 2026-05-18 Pending — Muscatine BOR
- 2026-02-20 Relisted — Muscatine BOR
- 2000-04-13 Sold (Public Records) $32,000 Public Records
- 1995-04-25 Sold (MLS) $26,000 Muscatine BOR
Property tax history
+5.3%/yrLatest (2025): $1,659 · +29.4% YoY. Source: county tax records.
Cash-flow waterfall
monthlySold comps — $/sqft
last 12 mo · ≤1 miLoading sold comps…