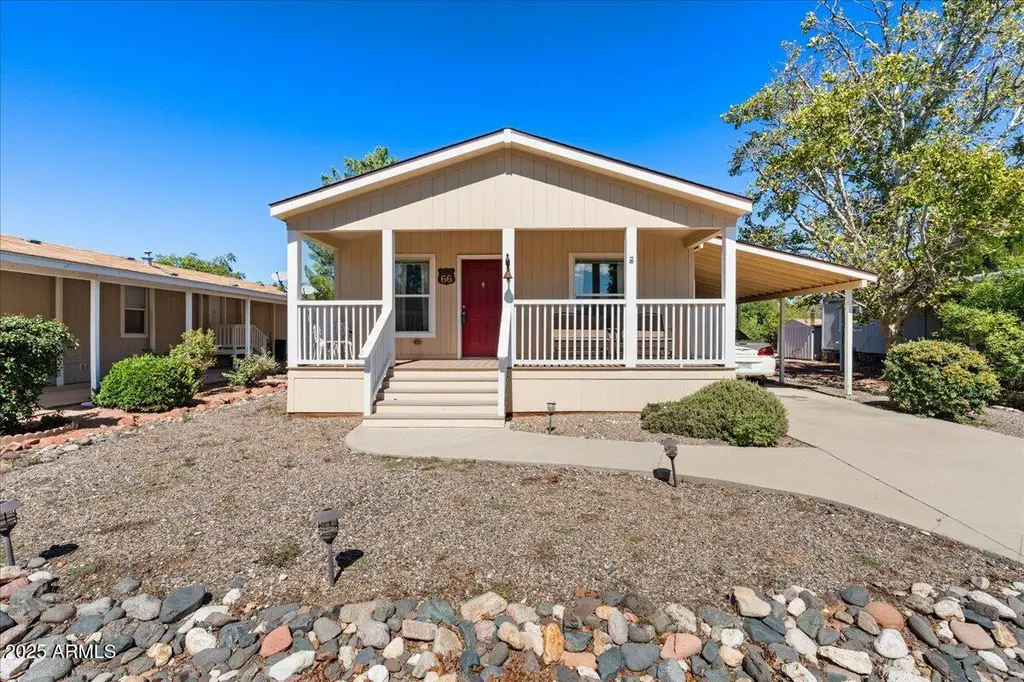
1487 W Horseshoe Bend Dr #66 · Camp Verde, AZ
Flood risk 5/10 · Moderate
- FEMA flood zone
- X (unshaded)
- Chance of flooding over 30 yrs
- 0.65%
- Est. flood insurance / yr
- $507 – $1,088
Fire risk 5/10 · Moderate
- Est. fire insurance / yr
- $610 – $1,132
Heat risk 7/10 · Major
- Hot days now (above 104°F)
- 7 days/yr
- Hot days in 30 yrs
- 18 days/yr
Wind risk 1/10 · Minimal
- Chance of severe wind over 30 yrs
- —
Air-quality risk 1/10 · Minimal
- Unhealthy air days now
- 0 days/yr
- Unhealthy air days in 30 yrs
- 0 days/yr
Risk factors via First Street. Map © Google.
Why this score? — see what drove the B- grade
The composite is a weighted blend of 9 inputs, each scored 0–100. Each bar is that input's sub-score; the figure is the points it added to the 100-point composite (weight × sub-score).
- Cash flow +28.2/30.0
- DSCR +10.0/10.0
- 1% rule +7.8/10.0
- ARV discount +7.7/15.0
- Condition / age +4.0/5.0
- Livability +3.3/5.0
- Rent growth +2.5/5.0
- Schools +1.9/10.0
- Appreciation +0.0/10.0
$115,000
🖨 Deal sheet 📄 Offer letter ✓ Due diligence
Listing remarks MLS
Well-maintained 2014 manufactured home featuring 2 bedrooms, 2 baths, open floor plan, and gas plumbed to the home. Move-in ready with pride of ownership throughout.
Key facts
- Open floor plan
- Gas plumbed
- Parking
Tags
Neighborhood map
What this means for you Summary
Snapshot
- This is a 2-bed/2.0-bath manufactured listed at $115k. Condition is rated good.
Deal economics
- At list price, monthly cash flow is $365 ($4k/yr) — positive.
- The deal already cash-flows at list — no discount required.
- Meets the 1% rule at list price ($1k rent vs $115k).
- Recommended offer: $101k (12.0% below list) — sets the bar for market timing.
- Cap rate 10.1% vs local median 2.8% in Camp Verde — top-decile yield for the area; either an underpriced asset or a hidden risk that comps aren't pricing in. Stress-test before assuming the spread holds.
Location & tenants
- Location reads 66/100 on livability (#77 in AZ) — a middle-class / working-renter tenant base. Strengths: cost of living A, housing A, crime A-; Watch: schools D-, amenities F, commute F.
- Camp Verde Unified District (4470) (rural): math 20% / reading 25% proficiency, ranked #176 of 249 in AZ (top 71%) — low school quality limits family demand, transient renter base, plan for 1-2y turnover; 63% free/reduced lunch — lower-income household profile, screen leases tightly.
- Market conditions: 140 active listings in the ZIP; 1 comparable units currently listed for rent nearby; 2,062 units permitted in Yavapai County in 2024 (98 in 5+ unit buildings).
Forward outlook
- Local home prices are declining (-3.0%/yr); year-one equity from $795 of loan paydown is wiped out by about $3k of value loss. Plan a longer hold.
- Yavapai County population projected at +10% by 2050 — modest demand growth; plan on rents tracking national, not racing it.
- At projected returns (-3.0% appreciation + 3.0% rent growth), your $32k cash investment doubles in ~9 years — after that, you're playing with house money.
Negotiation context
- It's been on market 258 days — a 12% lower offer ($101k) is reasonable based on typical stale-listing flexibility.
Risks & watch-outs
- Climate carrying-cost: moderate flood risk; moderate wildfire risk; extreme-heat days projected 7→18/yr by 2055 (HVAC capex compounding) — expect insurance premiums to compound above CPI over the hold.
Questions for the listing agent
- It's been on market 258 days. Have you received any prior offers? Is the seller open to a 12% concession, seller financing, or rate buy-down credit?
- Why hasn't it sold? Are there any deal-killer items the seller is aware of (foundation, flood, title, zoning, code violations)?
- Is there a deadline driving the sale (1031 exchange, divorce, estate, relocation)? That informs how much negotiation room exists.
- Schools are D-rated, which usually means shorter tenancies and higher turnover. Who's the typical renter profile here, and what's been the actual vacancy rate?
- What's the average days-on-market for RENTAL listings here right now (not sales)? A rising rental-DOM trend means longer vacancies and softer asking-rent achievability than the comps imply.
- What's the recent tenant-quality profile in this submarket — average credit score on applications, eviction rate, late-payment / NSF rate, and stable-employment percentage? A property-management company in the area should have these aggregated.
- How much new for-sale + rental construction is in the pipeline within 1–3 miles? Heavy new supply typically softens prices + rents 12–24 months out; constrained supply supports both.
Investment metrics
- 1% rule
- 1.28% ✓
- Cap rate
- 10.10%
- Cash-on-cash
- 13.61%
- DSCR
- 1.61
- GRM
- 6.5
CMA / ARV
- ARV (median comp)
- $115,465
- List price
- $115,000
- Delta
- -0.40%
- Verdict
- FAIR
- Comps
- 7 within 1.0 mi
Show comp detail 7 sales within ~0.75 mi
| Address | Dist | Beds/Ba | Sqft | Sold | Price | $/sf | Match |
|---|---|---|---|---|---|---|---|
| 1487 W Horseshoe Bend Dr #44 | 0.06mi | 2/2.0 | 1,056 (+6%) | 4mo | $89,000 | $84 | 84 |
| 1487 W Horseshoe Bend Dr #43 | 0.07mi | 2/2.0 | 960 (-4%) | 14mo | $115,000 | $120 | 78 |
| 1487 W Horseshoe Bend Dr #48 | 0.06mi | 2/2.0 | 1,040 (+4%) | 17mo | $60,000 | $58 | 76 |
| 1487 W Horseshoe Bend Dr #59 | 0.06mi | 2/1.0 | 886 (-11%) | 8mo | $84,000 | $95 | 67 |
| 1487 W Horseshoe Bend Dr Lot 20 | 0.07mi | 2/2.0 | 1,144 (+14%) | 8mo | $119,900 | $105 | 66 |
| 1487 Horseshoe Bend Dr #86 | 0.10mi | 2/1.0 | 900 (-10%) | 14mo | $97,000 | $108 | 63 |
| 2428 N La Grande Dr | 0.46mi | 2/2.0 | 960 (-4%) | 22mo | $199,777 | $208 | 53 |
Match score weights: distance 35% · size 25% · config 20% · recency 20%. Top-matched comps best support the ARV.
Projected returns pro-forma
-3.0% appreciation · 3.0% rent growth · sell at horizon
- IRR
- 3.7%
- Equity multiple
- 1.14×
- Total profit
- $4,650
- Equity at exit
- $17,147
- IRR
- 13.3%
- Equity multiple
- 2.06×
- Total profit
- $34,094
- Equity at exit
- $9,943
Cash invested: $32,200 (down + closing). Projections, not guarantees.
Landlord ↔ Tenant lean methodology
- Overall (STATE)
- 87 Strongly Landlord-Friendly
- State Arizona
- 87 Strongly Landlord-Friendly · R+3
- County
- — inherits STATE
- City
- — inherits STATE
ZIP-level market 86322
- Home prices YoY
- -8.6%
- Active inventory
- 140
- Price-to-rent
- 6.5×
Monthly cashflow live
- Estimated rent
- $1,468 medium interval (Pro) →
- Mortgage (P&I)
- −$603
- Tax est. 1.5%
- −$144 /mo · $1,725/yr
- Insurance
- −$48
- HOA
- −$0
- Vacancy / Maint / Mgmt
- −$308
- Net cashflow
- $365
Break-even live
UW: 25.0% down · 7.5% · 30yr · 1.5% tax · 5.0% vac · 8.0% maint · 8.0% mgmt
Financing live
Cash to close
- Down payment
- $28,750
- Closing costs
- $3,450
- Reserves months
- —
- Total cash needed
- —
Loan-product check · same deal, 3 products live
Conventional
25% down · 7.5% · 30yr
- Down + closing
- —
- Monthly P&I
- —
- Monthly cashflow
- —
- DSCR
- —
- Eligible?
- —
Personal DTI + credit; lowest rate.
DSCR
20% down · 8.5% · 30yr
- Down + closing
- —
- Monthly P&I
- —
- Monthly cashflow
- —
- DSCR
- —
- Eligible?
- —
No personal income docs; deal must DSCR.
Hard money
10% down · 12.0% · 12mo
- Down + closing
- —
- Monthly P&I
- —
- Monthly cashflow
- —
- DSCR
- —
- Eligible?
- —
Short-term bridge; refi at stabilization.
Rent comps 1 comps
| Address | Beds | Baths | Sqft | Rent | $/sqft | DOM | Units | Dist |
|---|---|---|---|---|---|---|---|---|
| 1855 N Badger Ln Camp Verde, AZ | 2.0 | 1.0 | 740 | $1,550 | $2.09 | 21d | 1 | 0.46mi |
Listing history 19 events
-
2026-06-18days on market $115,000 Active 258 DOM
-
2026-06-17days on market $115,000 Active 257 DOM
-
2026-06-16days on market $115,000 Active 256 DOM
-
2026-06-15days on market $115,000 Active 255 DOM
-
2026-06-14days on market $115,000 Active 253 DOM
-
2026-06-13days on market $115,000 Active 252 DOM
-
2026-06-10days on market $115,000 Active 250 DOM
-
2026-06-09days on market $115,000 Active 249 DOM
-
2026-06-08days on market $115,000 Active 248 DOM
-
2026-06-07days on market $115,000 Active 247 DOM
-
2026-06-05days on market $115,000 Active 244 DOM
-
2026-06-03days on market $115,000 Active 243 DOM
-
2026-06-02days on market $115,000 Active 242 DOM
-
2026-06-01days on market $115,000 Active 241 DOM
-
2026-05-31days on market $115,000 Active 240 DOM
-
2026-05-30days on market $115,000 Active 239 DOM
-
2026-02-01price $120,000 165-char remark
Show marketing remark (165 chars)
Well-maintained 2014 manufactured home featuring 2 bedrooms, 2 baths, open floor plan, and gas plumbed to the home. Move-in ready with pride of ownership throughout.
-
2025-10-23price $123,000 165-char remark
Show marketing remark (165 chars)
Well-maintained 2014 manufactured home featuring 2 bedrooms, 2 baths, open floor plan, and gas plumbed to the home. Move-in ready with pride of ownership throughout.
-
2025-10-03$125,000 Active 165-char remark
Show marketing remark (165 chars)
Well-maintained 2014 manufactured home featuring 2 bedrooms, 2 baths, open floor plan, and gas plumbed to the home. Move-in ready with pride of ownership throughout.
ⓘ Source: listings_history table (triggers on properties + properties_extension) + one-shot
backfill from property_details.listing_events for pre-trigger history.
Climate risk First Street
- Flood 5/10 Major FEMA zone X (unshaded) · 65% chance over 30 yrs
- Wildfire 5/10 Major
- Heat 7/10 Severe 7 d/yr ≥104°F today · 18 d/yr by 30 yrs out
- Wind 1/10 Low
- Air quality 1/10 Low 0 unhealthy d/yr today · 0 by 30 yrs out
Nearby sold comps map
Loading sold comps map…
Walkable amenities ~0.75 mi
Loading nearby amenities…
Taxation est. · year 1
- Rental income
- $17,620
- − Mortgage interest
- −$6,442
- − Property taxes
- −$1,725
- − Insurance
- −$575
- − Repairs & maintenance
- −$1,410
- − Management
- −$1,410
- − Depreciation
- −$3,345
- Taxable income
- $2,714
- Est. tax owed @ 24.0%
- −$651
- After-tax cash flow
- $3,732/yr
For passive investors: Depreciation is non-cash, so a rental often shows a tax loss while cash-flowing — sheltering income. Rental losses are passive: they offset passive income freely, and up to $25,000/yr can offset ordinary (W-2) income if you actively participate and your MAGI is under $100k (phasing out to $0 by $150k); unused losses carry forward. On sale, claimed depreciation is recaptured at up to 25%, and gains may owe capital-gains tax (a 1031 exchange can defer both). Figures are a year-1 estimate at your 24.0% rate — not tax advice; consult a CPA.
Condition & rehab AI · 12 photos
A well-maintained 2014 manufactured home with cosmetic updates needed to enhance its resale and rental value.
Repairs flagged
- Minor Kitchen cabinets — Aesthetic update needed
- Minor Bathtub and shower curtain — Cleanliness improvement needed
Value-add opportunities
- Both Paint freshening — Enhances curb appeal and interior aesthetics
- Both New flooring — Improves comfort and resale value
- Both Kitchen cabinet refresh — Modernizes kitchen and adds value
Renovation cost estimate screening
| Repair item | Severity | Est. cost |
|---|---|---|
| Kitchen cabinets · Aesthetic update needed | Minor | $500–3,000 |
| Bathtub and shower curtain · Cleanliness improvement needed | Minor | $500–3,000 |
| Total estimated repair cost · 2 items | $1,000–6,000 |
Value-add ROI direction
- Both Paint freshening — Enhances curb appeal and interior aesthetics ↑
- Both New flooring — Improves comfort and resale value ↑
- Both Kitchen cabinet refresh — Modernizes kitchen and adds value ↑
ⓘ Cost ranges are severity-bucket heuristics (US national rule-of-thumb). Get contractor quotes + a written scope before underwriting a rehab budget.
Schools (NCES district)
- District
- Camp Verde Unified District (4470)
- NCES district ID
- 0401600
- Math proficiency
- 20% ▼ -6.00%
- Reading proficiency
- 25% ▼ -5.00%
- Median HH income
- $39,042
- Composite
- 18.92/100
- National rank
- #8856
- State rank
- #176 of 249 in AZ
Livability — Camp Verde
- Score
- 66/100
- State rank
- #77
- US rank
- #12185
Category grades
Schools grade is shown separately in the Schools card above.
Census & demographics
- Census place
- Camp Verde, AZ
- County
- Yavapai County · 190,406 people
- City population
- 13,020
- Metro
- Prescott Valley-Prescott, AZ
- Population (ZIP)
- 13,020
- Household income
- $69,411
- Rent vs Own
- Severe rent burden
- 215.0
Population outlook (Yavapai County) Hauer SSP2
- Today (2025)
- 241,389 people
- By 2030
- 249,523 · +3.4%
- By 2040
- 259,966 · +7.7%
- By 2050
- 264,736 · +9.7%
- By 2075
- 269,334 · +11.6%
- By 2100
- 256,505 · +6.3%
Race, ethnicity, and origin ACS 2023
- Neighborhood character
- Predominantly White (72%)
- Race & ethnicity
- White 72% Hispanic / Latino 16% Native American 9% Two or more races 6%
- Hispanic origin (detail)
- Mexican 12%
- Common ancestry
- Portuguese 4% Serbian 3% Slovak 3%
- Foreign-born
- 5% · Canada
- Languages at home
- 88% English-only · Spanish 10%
Political lean MEDSL · Yavapai
- 2024 margin
- Solid R (+33.9) · D 32.6% · R 66.5%
- 2008→2024 swing
- -9.5pp toward R · 2008: -24.4pp · 2024: -33.9pp
- All cycles
- 2024: R+33.9 2020: R+29.3 2016: R+31.4 2012: R+30.7 2008: R+24.4
Not yet ingested
- Civics
- —
Market trends
- HPI YoY
- ▼ -39.38%
- Current HPI
- 419.2107
- Rent YoY
- —
- Metro
- Prescott Valley-Prescott, AZ
- State GDP YoY
- ▲ 4.54%
- F500 in state
- 20
Industry mix (Fortune 500 HQ in AZ)
| Industry | F500 HQs | Revenue |
|---|---|---|
| Technology | 2 | $13B |
|
||
| Mining / Metals | 1 | $23B |
|
||
| Environmental Services | 1 | $16B |
|
||
| Metals / Steel | 1 | $14B |
|
||
| Technology Distribution | 1 | $9B |
|
||
| Homebuilding | 1 | $8B |
|
||
Price history
-4.0% since first listed3 events — show timeline
- 2026-02-01 Price Changed $120,000 ARMLS
- 2025-10-23 Price Changed $123,000 ARMLS
- 2025-10-03 Listed $125,000 ARMLS
Cash-flow waterfall
monthlySold comps — $/sqft
last 12 mo · ≤1 miLoading sold comps…