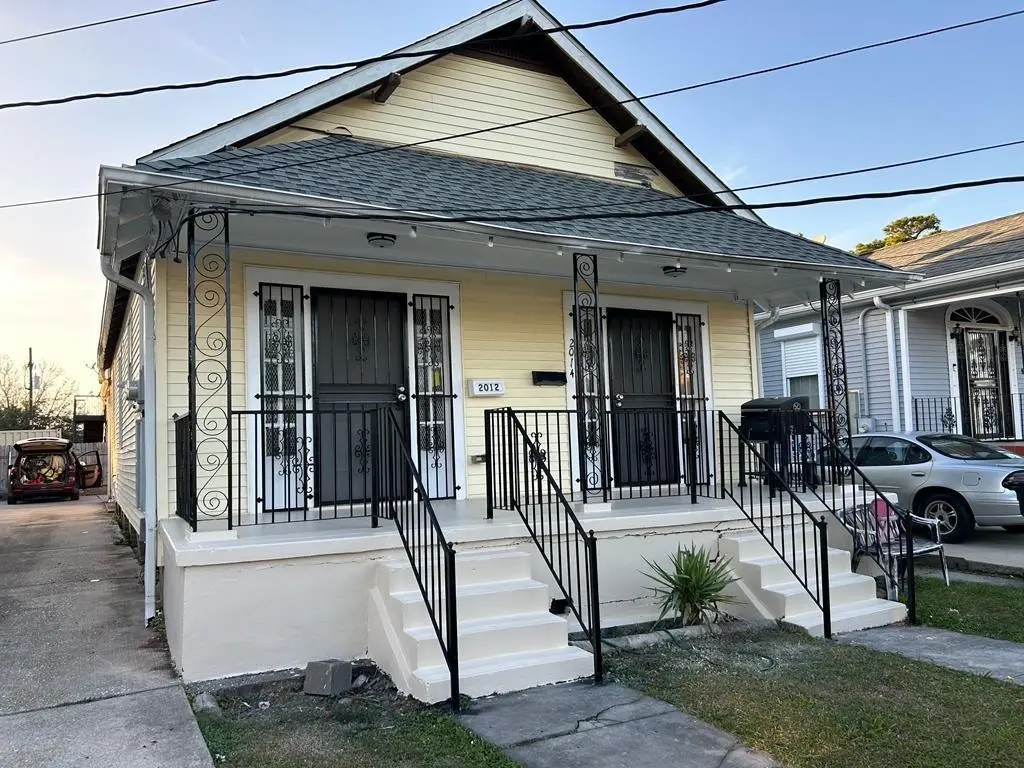
2012-14 Congress St · New Orleans, LA
Flood risk 9/10 · Severe
- FEMA flood zone
- X (shaded)
- Chance of flooding over 30 yrs
- 0.99%
- Est. flood insurance / yr
- $507 – $1,088
Fire risk 3/10 · Minor
- Est. fire insurance / yr
- $1,269 – $2,357
Heat risk 10/10 · Severe
- Hot days now (above 108°F)
- 7 days/yr
- Hot days in 30 yrs
- 22 days/yr
Wind risk 10/10 · Severe
- Chance of severe wind over 30 yrs
- 99.0%
Air-quality risk 3/10 · Minor
- Unhealthy air days now
- 3 days/yr
- Unhealthy air days in 30 yrs
- 3 days/yr
Risk factors via First Street. Map © Google.
Why this score? — see what drove the D- grade
The composite is a weighted blend of 9 inputs, each scored 0–100. Each bar is that input's sub-score; the figure is the points it added to the 100-point composite (weight × sub-score).
- ARV discount +10.3/15.0
- Cash flow +9.7/30.0
- Livability +4.0/5.0
- Condition / age +4.0/5.0
- Rent growth +3.1/5.0
- 1% rule +2.9/10.0
- DSCR +2.8/10.0
- Schools +1.6/10.0
- Appreciation +0.0/10.0
$209,900
🖨 Deal sheet 📄 Offer letter ✓ Due diligence
Listing remarks MLS
TURNKEY INCOME PRODUCING DOUBLE IN THE LONGSTANDING ST CLAUDE & MUSICIANS' VILLAGE NEIGHBORHOOD. TWO 2B1B UNITS, BLOCKS FROM CLAIBORNE AVE, MINUTES FROM FRENCH QUARTER, MARIGNY, BYWATER, LOWER 9TH, HOLY CROSS. DON'T MISS OUT ON THIS GREAT OPPORTUNITY. BOTH UNITS ARE OCCUPIED BY TENANTS ON MONTH-TO-MONTH LEASES.
Key facts
- Income producing
- Upper ninth ward
- 3,049 sq ft lot
Tags
Neighborhood map
What this means for you Summary
Snapshot
- This is a single-family listed at $210k. Condition is rated good.
Deal economics
- At list price, monthly cash flow is $-203 ($-2k/yr) — negative.
- To cash-flow at today's rent, offer at most $181k (14.0% below list).
- To meet the 1% rule (rent ≥ 1% of price), the offer needs to be $166k (20.8% below list).
- Recommended offer: $166k (20.8% below list) — sets the bar for 1% rule.
- Cap rate 5.5% vs local median 4.4% in New Orleans — meaningfully above typical; check what's discounted (condition, days-on-market, listing class) to confirm the premium yield is real.
Location & tenants
- Location reads 81/100 on livability (#3 in LA, #1,383 nationally) — a professional / high-income tenant draw. Strengths: amenities A+, commute A+, health & safety A+; Watch: crime C-, employment D.
- Orleans Parish (urban): math 11% / reading 27% proficiency, ranked #69 of 98 in LA (top 70%) — low school quality limits family demand, transient renter base, plan for 1-2y turnover; 68% free/reduced lunch — lower-income household profile, screen leases tightly.
- Market conditions: Rents rising (+2.5%/yr); 581 active listings in the ZIP; 40 comparable units currently listed for rent nearby; rentals at typical pace (median 24d on market — plan ~3-4 weeks tenant-placement turnaround); 710 units permitted in Orleans Parish in 2024 (244 in 5+ unit buildings).
- This rent runs 44% of the median local income ($46k/yr) — at the standard rent-burdened threshold; future hikes will face affordability resistance.
Forward outlook
- Local home prices are declining (-3.0%/yr); year-one equity from $1k of loan paydown is wiped out by about $6k of value loss. Plan a longer hold.
- Orleans County population projected at +61% by 2050 — long-run rental-demand tailwind backs the buy-and-hold thesis.
Negotiation context
- It's been on market 592 days — a 12% lower offer ($185k) is reasonable based on typical stale-listing flexibility.
- 3 sale attempts since 7y ago; this cycle's ask has dropped $30k (13%) from the opening price — seller is motivated, your offer sets the floor, not the list.
Risks & watch-outs
- Watch-outs: flood insurance adds $66/mo.
- Climate carrying-cost: severe flood risk; severe wind risk, 99% chance of damaging wind over 30y; extreme-heat days projected 7→22/yr by 2055 (HVAC capex compounding) — expect insurance premiums to compound above CPI over the hold.
Questions for the listing agent
- What do current leases actually rent for vs. the listed asking? Can we see a recent rent roll and the last 12 months of T-12 income?
- It's been on market 592 days. Have you received any prior offers? Is the seller open to a 21% concession, seller financing, or rate buy-down credit?
- What's the actual annual flood-insurance premium (NFIP or private), and is the property in a SFHA with mandatory coverage?
- Why hasn't it sold? Are there any deal-killer items the seller is aware of (foundation, flood, title, zoning, code violations)?
- Is there a deadline driving the sale (1031 exchange, divorce, estate, relocation)? That informs how much negotiation room exists.
- The area grade is low — what's the realistic commute time and amenity access for the typical tenant pool here? Any planned neighborhood developments (good or bad) we should know about?
- What's the average days-on-market for RENTAL listings here right now (not sales)? A rising rental-DOM trend means longer vacancies and softer asking-rent achievability than the comps imply.
- What's the recent tenant-quality profile in this submarket — average credit score on applications, eviction rate, late-payment / NSF rate, and stable-employment percentage? A property-management company in the area should have these aggregated.
- How much new for-sale + rental construction is in the pipeline within 1–3 miles? Heavy new supply typically softens prices + rents 12–24 months out; constrained supply supports both.
Investment metrics
- 1% rule
- 0.79% ✗
- Cap rate
- 5.51%
- Cash-on-cash
- -2.79%
- DSCR
- 0.88
- GRM
- 10.5
CMA / ARV
- ARV (median comp)
- $223,623
- List price
- $209,900
- Delta
- -6.14%
- Verdict
- FAIR
- Comps
- 20 within 1.0 mi
Show comp detail 12 sales within ~0.75 mi
| Address | Dist | Beds/Ba | Sqft | Sold | Price | $/sf | Match |
|---|---|---|---|---|---|---|---|
| 1704 Desire St | 0.25mi | 3/2.0 | 1,500 (-1%) | 7mo | $200,000 | $133 | 81 |
| 1713 Desire St | 0.23mi | 4/2.0 | 1,654 (+9%) | 2mo | $235,000 | $142 | 72 |
| 1336 Congress St | 0.48mi | 3/3.0 | 1,500 (-1%) | 6mo | $332,000 | $221 | 71 |
| 1431 Clouet St | 0.51mi | 3/2.0 | 1,404 (-7%) | 1mo | $307,000 | $219 | 64 |
| 2334 Louisa St | 0.34mi | 3/2.5 | 1,645 (+9%) | 7mo | $215,000 | $131 | 63 |
| 1639 Independence St | 0.26mi | 3/2.0 | 1,340 (-11%) | 7mo | $220,000 | $164 | 63 |
| 1833 Saint Ferdinand St | 0.57mi | 4/2.5 | 1,551 (+3%) | 8mo | $130,000 | $84 | 63 |
| 1331 Bartholomew St | 0.54mi | 3/2.0 | 1,628 (+8%) | 1mo | $320,000 | $197 | 61 |
| 2218 Feliciana St | 0.42mi | 3/2.5 | 1,645 (+9%) | 8mo | $210,000 | $128 | 59 |
| 1027 Louisa St | 0.75mi | 2/2.0 | 1,460 (-3%) | 1mo | $450,000 | $308 | 59 |
| 2730 N Prieur St | 0.59mi | 3/2.0 | 1,685 (+11%) | 6mo | $237,650 | $141 | 48 |
| 3028 Marais St | 0.73mi | 3/1.5 | 1,391 (-8%) | 9mo | $328,000 | $236 | 45 |
Match score weights: distance 35% · size 25% · config 20% · recency 20%. Top-matched comps best support the ARV.
Projected returns pro-forma
-3.0% appreciation · 2.49% rent growth · sell at horizon
- IRR
- -23.8%
- Equity multiple
- 0.19×
- Total profit
- $-47,727
- Equity at exit
- $31,297
- IRR
- -20.3%
- Equity multiple
- -0.04×
- Total profit
- $-61,391
- Equity at exit
- $18,148
Cash invested: $58,772 (down + closing). Projections, not guarantees.
Landlord ↔ Tenant lean methodology
- Overall (STATE)
- 90 Strongly Landlord-Friendly
- State Louisiana
- 90 Strongly Landlord-Friendly · R+12
- County
- — inherits STATE
- City
- — inherits STATE
ZIP-level market 70117
- Rents YoY
- 2.5%
- Active inventory
- 581
- Price-to-rent
- 10.5×
Monthly cashflow live
- Estimated rent
- $1,663 high interval (Pro) →
- Mortgage (P&I)
- −$1,101
- Tax est. 1.5%
- −$262 /mo · $3,148/yr
- Insurance
- −$87
- Flood insurance flood zone
- −$66 /mo · $798/yr
- HOA
- −$0
- Vacancy / Maint / Mgmt
- −$349
- Net cashflow
- $-203
Break-even live
UW: 25.0% down · 7.5% · 30yr · 1.5% tax · 5.0% vac · 8.0% maint · 8.0% mgmt
Financing live
Cash to close
- Down payment
- $52,475
- Closing costs
- $6,297
- Reserves months
- —
- Total cash needed
- —
Loan-product check · same deal, 3 products live
Conventional
25% down · 7.5% · 30yr
- Down + closing
- —
- Monthly P&I
- —
- Monthly cashflow
- —
- DSCR
- —
- Eligible?
- —
Personal DTI + credit; lowest rate.
DSCR
20% down · 8.5% · 30yr
- Down + closing
- —
- Monthly P&I
- —
- Monthly cashflow
- —
- DSCR
- —
- Eligible?
- —
No personal income docs; deal must DSCR.
Hard money
10% down · 12.0% · 12mo
- Down + closing
- —
- Monthly P&I
- —
- Monthly cashflow
- —
- DSCR
- —
- Eligible?
- —
Short-term bridge; refi at stabilization.
Rent comps 40 comps
| Address | Beds | Baths | Sqft | Rent | $/sqft | DOM | Units | Dist |
|---|---|---|---|---|---|---|---|---|
| 2028 Desire St New Orleans, LA | 3.0 | 1.0 | 1300 | $1,300 | $1.00 | 23d | 1 | 0.12mi |
| 2129 Desire St Unit 1B New Orleans, LA | 3.0 | 1.0 | 1105 | $1,200 | $1.09 | 3d | 1 | 0.14mi |
| 2129 Desire St Unit 1B New Orleans, LA | 3.0 | 1.0 | 1105 | $1,200 | $1.09 | 2d | 1 | 0.14mi |
| 1904 Desire St New Orleans, LA | 3.0 | 1.0 | 1200 | $1,400 | $1.17 | 10d | 1 | 0.14mi |
| 1942 Piety St New Orleans, LA | 3.0 | 1.0 | 1100 | $1,500 | $1.36 | 23d | 1 | 0.18mi |
| 1822 Piety St New Orleans, LA | 3.0 | 1.5 | 1200 | $1,500 | $1.25 | 15d | 1 | 0.23mi |
| 1839 Louisa St New Orleans, LA | 3.0 | 2.0 | 1500 | $2,095 | $1.40 | 15d | 1 | 0.24mi |
| 1835 Louisa St New Orleans, LA | 3.0 | 2.5 | 1800 | $2,350 | $1.31 | 3d | 1 | 0.24mi |
| 1628 Bartholomew St New Orleans, LA | 3.0 | 2.0 | 1050 | $1,600 | $1.52 | 23d | 1 | 0.34mi |
| 3125 Industrial Ct New Orleans, LA | 2.0 | 2.5 | 1100 | $1,450 | $1.32 | 23d | 1 | 0.35mi |
| 4222 N Johnson St New Orleans, LA | 3.0 | 2.0 | 1100 | $1,895 | $1.72 | 23d | 1 | 0.37mi |
| 2423 Louisa St New Orleans, LA | 2.0 | 1.0 | 1050 | $1,300 | $1.24 | 11d | 1 | 0.37mi |
| 2027 Feliciana St New Orleans, LA | 2.0 | 1.0 | 1104 | $1,100 | $1.00 | 15d | 1 | 0.37mi |
| 2421 Louisa St New Orleans, LA | 2.0 | 1.0 | 1050 | $1,300 | $1.24 | 11d | 1 | 0.37mi |
| 2509 Piety St New Orleans, LA | 2.0 | 2.0 | 1056 | $1,450 | $1.37 | 23d | 1 | 0.39mi |
| 2114 Feliciana St Unit A New Orleans, LA | 3.0 | 2.0 | 1134 | $1,500 | $1.32 | 15d | 1 | 0.41mi |
| 2114 Feliciana St Unit A New Orleans, LA | 3.0 | 2.0 | 1134 | $1,500 | $1.32 | 23d | 1 | 0.41mi |
| 1437 Gallier St New Orleans, LA | 3.0 | 2.0 | 1451 | $1,875 | $1.29 | 21d | 1 | 0.41mi |
| 2331 Feliciana St New Orleans, LA | 3.0 | 2.0 | 1250 | $1,850 | $1.48 | 23d | 1 | 0.44mi |
| 4230 N Claiborne Ave New Orleans, LA | 3.0 | 2.5 | 1296 | $1,750 | $1.35 | 23d | 1 | 0.50mi |
| 1325 Pauline St New Orleans, LA | 3.0 | 2.0 | 1792 | $2,250 | $1.26 | 2d | 1 | 0.51mi |
| 1325 Pauline St New Orleans, LA | 3.0 | 2.0 | 1792 | $2,250 | $1.26 | 3d | 1 | 0.51mi |
| 1323 Pauline St New Orleans, LA | 3.0 | 2.0 | 1792 | $2,250 | $1.26 | 3d | 1 | 0.52mi |
| 1411 France St New Orleans, LA | 3.0 | 2.0 | 1525 | $2,000 | $1.31 | 23d | 1 | 0.57mi |
| 4318 N Robertson St New Orleans, LA | 3.0 | 1.0 | 1250 | $1,150 | $0.92 | 3d | 1 | 0.59mi |
| 4318 1/2 N Robertson St New Orleans, LA | 3.0 | 1.0 | 1250 | $1,150 | $0.92 | 2d | 1 | 0.59mi |
| 1403 Lesseps St New Orleans, LA | 3.0 | 3.0 | 1700 | $1,800 | $1.06 | 11d | 1 | 0.61mi |
| 1320 Feliciana St New Orleans, LA | 2.0 | 2.0 | 1200 | $2,000 | $1.67 | 23d | 1 | 0.64mi |
| 4317 Urquhart St New Orleans, LA | 3.0 | 2.0 | 1300 | $1,650 | $1.27 | 23d | 1 | 0.67mi |
| 1119 Bartholomew St Unit 1119 New Orleans, LA | 2.0 | 2.0 | 1410 | $2,500 | $1.77 | 43d | 1 | 0.68mi |
| 1231 Feliciana St New Orleans, LA | 3.0 | 2.5 | 1869 | $2,750 | $1.47 | 43d | 1 | 0.68mi |
| 3221 Saint Claude Ave New Orleans, LA | 3.0 | 1.0 | 1900 | $1,650 | $0.87 | 23d | 1 | 0.68mi |
| 1233 Poland Ave New Orleans, LA | 2.0 | 2.0 | 1200 | $2,250 | $1.88 | 23d | 1 | 0.73mi |
| 3025 Saint Claude Ave New Orleans, LA | 2.0 | 2.0 | 1224 | $1,950 | $1.59 | 23d | 1 | 0.78mi |
| 3421 Burgundy St New Orleans, LA | 2.0 | 2.0 | 1120 | $3,000 | $2.68 | 23d | 1 | 0.83mi |
| 1038 Montegut St New Orleans, LA | 3.0 | 2.5 | 2250 | $4,200 | $1.87 | 43d | 1 | 0.84mi |
| 1038 Montegut St New Orleans, LA | 3.0 | 2.5 | 2250 | $4,200 | $1.87 | 23d | 1 | 0.84mi |
| 1034 Montegut St Unit 1034 New Orleans, LA | 2.0 | 2.0 | 1415 | $3,400 | $2.40 | 43d | 1 | 0.84mi |
| 2524 N Galvez St New Orleans, LA | 3.0 | 2.5 | 1102 | $1,800 | $1.63 | 16d | 1 | 0.86mi |
| 2522 N Galvez St New Orleans, LA | 3.0 | 2.0 | 1105 | $1,675 | $1.52 | 23d | 1 | 0.86mi |
Listing history 8 events
-
2026-05-31days on market $209,900 Active 592 DOM
-
2026-04-03price $209,900 316-char remark
Show marketing remark (316 chars)
TURNKEY INCOME PRODUCING DOUBLE IN THE LONGSTANDING ST CLAUDE & MUSICIANS' VILLAGE NEIGHBORHOOD. TWO 2B1B UNITS, BLOCKS FROM CLAIBORNE AVE, MINUTES FROM FRENCH QUARTER, MARIGNY, BYWATER, LOWER 9TH, HOLY CROSS. DON'T MISS OUT ON THIS GREAT OPPORTUNITY. BOTH UNITS ARE OCCUPIED BY TENANTS ON MONTH-TO-MONTH LEASES.
-
2026-03-31price $210,000 316-char remark
Show marketing remark (316 chars)
TURNKEY INCOME PRODUCING DOUBLE IN THE LONGSTANDING ST CLAUDE & MUSICIANS' VILLAGE NEIGHBORHOOD. TWO 2B1B UNITS, BLOCKS FROM CLAIBORNE AVE, MINUTES FROM FRENCH QUARTER, MARIGNY, BYWATER, LOWER 9TH, HOLY CROSS. DON'T MISS OUT ON THIS GREAT OPPORTUNITY. BOTH UNITS ARE OCCUPIED BY TENANTS ON MONTH-TO-MONTH LEASES.
-
2025-03-27price $216,000 316-char remark
Show marketing remark (316 chars)
TURNKEY INCOME PRODUCING DOUBLE IN THE LONGSTANDING ST CLAUDE & MUSICIANS' VILLAGE NEIGHBORHOOD. TWO 2B1B UNITS, BLOCKS FROM CLAIBORNE AVE, MINUTES FROM FRENCH QUARTER, MARIGNY, BYWATER, LOWER 9TH, HOLY CROSS. DON'T MISS OUT ON THIS GREAT OPPORTUNITY. BOTH UNITS ARE OCCUPIED BY TENANTS ON MONTH-TO-MONTH LEASES.
-
2024-08-22$240,000 Active 316-char remark
Show marketing remark (316 chars)
TURNKEY INCOME PRODUCING DOUBLE IN THE LONGSTANDING ST CLAUDE & MUSICIANS' VILLAGE NEIGHBORHOOD. TWO 2B1B UNITS, BLOCKS FROM CLAIBORNE AVE, MINUTES FROM FRENCH QUARTER, MARIGNY, BYWATER, LOWER 9TH, HOLY CROSS. DON'T MISS OUT ON THIS GREAT OPPORTUNITY. BOTH UNITS ARE OCCUPIED BY TENANTS ON MONTH-TO-MONTH LEASES.
-
2023-09-06historical $1,150
-
2023-08-31$1,150
-
2019-12-13$143,000 346-char remark
Show marketing remark (346 chars)
Looking for a solid return on your investment? Check out this income producing double in the Upper Ninth Ward! One side has been very well maintained by the long-term tenant for the last 4 years. The other side is vacant, and ready to be fixed up for an owner/occupant; or, to be rented out for a profit. Don't miss out on this great opportunity!
ⓘ Source: listings_history table (triggers on properties + properties_extension) + one-shot
backfill from property_details.listing_events for pre-trigger history.
Climate risk First Street
- Flood 9/10 Extreme FEMA zone X (shaded) · 99% chance over 30 yrs
- Wildfire 3/10 Moderate
- Heat 10/10 Extreme 7 d/yr ≥108°F today · 22 d/yr by 30 yrs out
- Wind 10/10 Extreme 99% chance of damaging wind over 30 yrs
- Air quality 3/10 Moderate 3 unhealthy d/yr today · 3 by 30 yrs out
Nearby sold comps map
Loading sold comps map…
Walkable amenities ~0.75 mi
Loading nearby amenities…
Taxation est. · year 1
- Rental income
- $19,960
- − Mortgage interest
- −$11,758
- − Property taxes
- −$3,148
- − Insurance
- −$1,847
- − Repairs & maintenance
- −$1,597
- − Management
- −$1,597
- − Depreciation
- −$6,106
- Taxable loss
- −$6,093
- Est. tax savings @ 24.0%
- +$1,462
- After-tax cash flow
- $-974/yr
For passive investors: Depreciation is non-cash, so a rental often shows a tax loss while cash-flowing — sheltering income. Rental losses are passive: they offset passive income freely, and up to $25,000/yr can offset ordinary (W-2) income if you actively participate and your MAGI is under $100k (phasing out to $0 by $150k); unused losses carry forward. On sale, claimed depreciation is recaptured at up to 25%, and gains may owe capital-gains tax (a 1031 exchange can defer both). Figures are a year-1 estimate at your 24.0% rate — not tax advice; consult a CPA.
Condition & rehab AI · 12 photos
This turnkey income-producing double is in good condition with recent renovations, making it a solid investment opportunity.
Value-add opportunities
- Both landscaping — enhances curb appeal and adds value
- Both new lighting fixtures — improves safety and aesthetics
- Both new flooring in bathrooms — enhances functionality and appearance
Renovation cost estimate screening
Value-add ROI direction
- Both landscaping — enhances curb appeal and adds value ↑
- Both new lighting fixtures — improves safety and aesthetics ↑
- Both new flooring in bathrooms — enhances functionality and appearance ↑
ⓘ Cost ranges are severity-bucket heuristics (US national rule-of-thumb). Get contractor quotes + a written scope before underwriting a rehab budget.
Schools (NCES district)
- District
- Orleans Parish
- NCES district ID
- 2201170
- Math proficiency
- 11% ▼ -52.00%
- Reading proficiency
- 27% ▼ -46.00%
- Median HH income
- $37,011
- Composite
- 15.78/100
- National rank
- #9271
- State rank
- #69 of 98 in LA
Livability — New Orleans
- Score
- 81/100
- State rank
- #3
- US rank
- #1383
Category grades
Schools grade is shown separately in the Schools card above.
Census & demographics
- Census place
- New Orleans, LA
- County
- Orleans Parish · 338,817 people
- City population
- 338,817
- Metro
- New Orleans-Metairie, LA
- Population (ZIP)
- 25,652
- Household income
- $45,764
- Rent vs Own
- Severe rent burden
- 1988.0
Population outlook (Orleans County) Hauer SSP2
- Today (2025)
- 513,025 people
- By 2030
- 575,781 · +12.2%
- By 2040
- 700,174 · +36.5%
- By 2050
- 826,541 · +61.1%
- By 2075
- 1,123,374 · +119.0%
- By 2100
- 1,355,609 · +164.2%
Race, ethnicity, and origin ACS 2023
- Neighborhood character
- Majority Black (60%)
- Race & ethnicity
- Black 60% White 30% Two or more races 6% Hispanic / Latino 5%
- Common ancestry
- Lithuanian 5% Italian 1% Romanian 1%
- Foreign-born
- 5% · Canada, South Korea
- Languages at home
- 93% English-only · Spanish 3% Other Indo-European 1% French/Haitian/Cajun 1%
Political lean MEDSL · Orleans
- 2024 margin
- Solid D (+67.0) · D 82.2% · R 15.2% · Other 2.7%
- 2008→2024 swing
- +6.7pp toward D · 2008: 60.3pp · 2024: 67.0pp
- All cycles
- 2024: D+67.0 2020: D+68.2 2016: D+66.2 2012: D+62.5 2008: D+60.3
Not yet ingested
- Civics
- —
Market trends
- HPI YoY
- ▼ -177.22%
- Current HPI
- 184.6061
- Rent YoY
- ▲ 2.49%
- Metro
- New Orleans-Metairie, LA
- State GDP YoY
- ▲ 3.29%
- F500 in state
- 10
Industry mix (Fortune 500 HQ in LA)
| Industry | F500 HQs | Revenue |
|---|---|---|
| Telecommunications | 2 | $23B |
|
||
| Utilities | 1 | $12B |
|
||
| Wholesale / Distribution | 1 | $5B |
|
||
| Advertising | 1 | $2B |
|
||
Price history
+46.8% since first listed7 events — show timeline
- 2026-04-03 Price Changed $209,900 AcadianaMLS
- 2026-03-31 Price Changed $210,000 AcadianaMLS
- 2025-03-27 Price Changed $216,000 AcadianaMLS
- 2024-08-22 Listed $240,000 AcadianaMLS
- 2023-09-06 Rental Removed $1,150 GSREIN
- 2023-08-31 Listed for Rent $1,150 GSREIN
- 2019-12-13 Listed $143,000 AcadianaMLS
Cash-flow waterfall
monthlySold comps — $/sqft
last 12 mo · ≤1 miLoading sold comps…