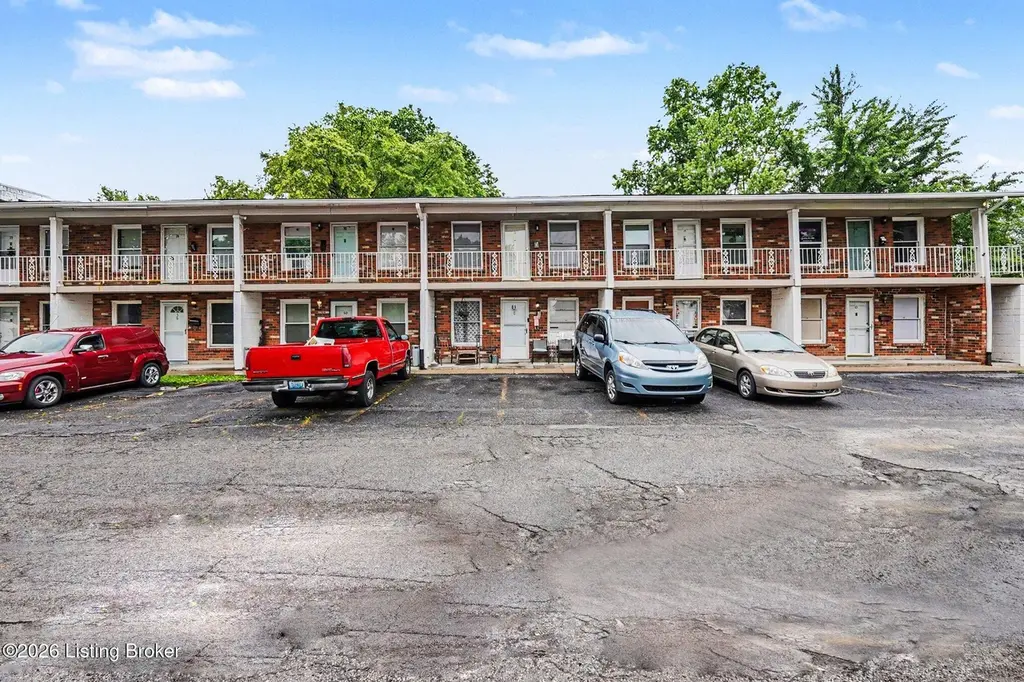
4501 S 6th St Apt 76 · Louisville, KY
Flood risk 1/10 · Minimal
- FEMA flood zone
- X (unshaded)
- Chance of flooding over 30 yrs
- 0.0%
- Est. flood insurance / yr
- $507 – $1,088
Fire risk 1/10 · Minimal
- Est. fire insurance / yr
- $839 – $1,559
Heat risk 5/10 · Moderate
- Hot days now (above 105°F)
- 7 days/yr
- Hot days in 30 yrs
- 20 days/yr
Wind risk 2/10 · Minimal
- Chance of severe wind over 30 yrs
- 2.0%
Air-quality risk 2/10 · Minimal
- Unhealthy air days now
- 1 days/yr
- Unhealthy air days in 30 yrs
- 3 days/yr
Risk factors via First Street. Map © Google.
Why this score? — see what drove the C+ grade
The composite is a weighted blend of 9 inputs, each scored 0–100. Each bar is that input's sub-score; the figure is the points it added to the 100-point composite (weight × sub-score).
- Cash flow +23.9/30.0
- 1% rule +10.0/10.0
- DSCR +7.7/10.0
- ARV discount +7.5/15.0
- Livability +3.2/5.0
- Rent growth +3.0/5.0
- Condition / age +2.5/5.0
- Schools +2.3/10.0
- Appreciation +0.0/10.0
$53,000
🖨 Deal sheet (PDF) 📄 Offer letter ✓ Due diligence
Listing remarks MLS
Newly renovated 2nd floor condominium, in lovely Southern Parkway neighborhood. See documents for recent updates. Near Airport, Churchill Downs, Watterson Prkwy, shopping, library, Iroquois Park, Colonial Inn dining and UofL. Nice green park area in center of quadrangle, with trees and picnic tables. HOA fee includes heat, water, trash pick-up, exterior and grounds maintenance and master insurance. Ownership at Innwood is more economical than renting. Also, great investor property. Listing Broker is co-owner/seller.
Key facts
- Second floor condo
- Off street parking
- Vinyl plank flooring
Tags
Property features AI
Finance
- Other: Part of the INNWOOD subdivision
- HOA & community: Condo association with monthly maintenance fee (specified); Monthly maintenance approximately $225
Exterior
- Parking: Surface parking available (subdivision provides many spaces)
- Utilities: Electricity connected; One HVAC unit
- Home design: Traditional style condominium; Single-story unit (located on a floor within a building)
- Construction: Built in 1981; Shingle roof; Poured concrete foundation
- Exterior features: Sidewalk; Level lot; See remarks for additional lot details; No fencing
Interior
- Kitchen: First-floor kitchen
- Bedrooms: One bedroom on the first floor
- Bathrooms: One full bathroom
- Heating & cooling: Radiant heating; Wall/window air conditioning unit(s)
- Interior features: Five total rooms; Three closets; Unfinished basement; Living room on the first floor; Dining area on the first floor
- Laundry & utility: No first-floor laundry
Neighborhood map
What this means for you Summary
Snapshot
- This is a 1-bed/1.0-bath condo listed at $53k.
Deal economics
- At list price, monthly cash flow is $103 ($1k/yr) — positive.
- The deal already cash-flows at list — no discount required.
- Meets the 1% rule at list price ($868 rent vs $53k).
- Recommended offer: $52k (1.5% below list) — sets the bar for market timing.
- Cap rate 8.6% vs local median 5.0% in Louisville — top-decile yield for the area; either an underpriced asset or a hidden risk that comps aren't pricing in. Stress-test before assuming the spread holds.
Location & tenants
- Location reads 63/100 on livability (#333 in KY) — a middle-class / working-renter tenant base. Strengths: cost of living A+, housing A+; Watch: employment C-, health & safety D+, crime F.
- Jefferson County (urban): math 19% / reading 35% proficiency, ranked #121 of 165 in KY (top 73%) — low school quality limits family demand, transient renter base, plan for 1-2y turnover.
- Zoned schools: Semple Elementary (math 2% / reading 12%, grade F, #662 of 676 statewide, top 99%, 574 students, 79% FRL); Frederick Law Olmsted Academy North (math 5% / reading 15%, grade F, #217 of 217 statewide, top 100%, 510 students, 74% FRL); Iroquois High (math 12% / reading 8%, grade F, #245 of 254 statewide, top 97%, 1,090 students, 74% FRL) — zoned schools average 76% FRL vs 56% district-wide (20 pts higher); higher-poverty schools than district average — tighter screening recommended.
- Zoned-school proficiency averages 9% at this address vs 27% district-wide (-18 pts) — the specific schools serving this property underperform the Jefferson County average; the district grade overstates school quality for this exact location.
- Market conditions: Rents rising (+1.9%/yr); 248 active listings in the ZIP; 22 comparable units currently listed for rent nearby; rentals at typical pace (median 19d on market — plan ~3-4 weeks tenant-placement turnaround); 2,836 units permitted in Jefferson County in 2024 (1,558 in 5+ unit buildings).
Forward outlook
- Local home prices are declining (-3.0%/yr); year-one equity from $366 of loan paydown is wiped out by about $2k of value loss. Plan a longer hold.
- Jefferson County population projected at +13% by 2050 — modest demand growth; plan on rents tracking national, not racing it.
Negotiation context
- It's been on market 20 days — a 2% lower offer ($52k) is reasonable based on typical stale-listing flexibility.
- 3 sale attempts since 27y ago with the ask held roughly flat each time — persistent listings suggest the price (not the market) is what's stuck; bring a comps-based counter.
Risks & watch-outs
- Watch-outs: HOA is 26% of rent.
- Climate carrying-cost: extreme-heat days projected 7→20/yr by 2055 (HVAC capex compounding) — expect insurance premiums to compound above CPI over the hold.
Questions for the listing agent
- What does the HOA fee cover, when was the last increase, and are there any pending special assessments or reserve-fund shortfalls?
- Any open or pending special assessments — roof, HVAC, plumbing, elevator, façade? What's the per-unit balance and payoff schedule, and is the seller paying it off at close or rolling it to the buyer?
- Is there a deadline driving the sale (1031 exchange, divorce, estate, relocation)? That informs how much negotiation room exists.
- Schools are D-rated, which usually means shorter tenancies and higher turnover. Who's the typical renter profile here, and what's been the actual vacancy rate?
- Crime grade is F in this area — have there been break-ins, vandalism, or insurance claims at this property in the last 3 years? What carrier currently insures it and at what premium?
- What's the average days-on-market for RENTAL listings here right now (not sales)? A rising rental-DOM trend means longer vacancies and softer asking-rent achievability than the comps imply.
- What's the recent tenant-quality profile in this submarket — average credit score on applications, eviction rate, late-payment / NSF rate, and stable-employment percentage? A property-management company in the area should have these aggregated.
- How much new apartment / multifamily construction is in the pipeline within 1–3 miles? Heavy new supply (>2% of stock underway) typically softens rents 12–24 months out; light construction supports rent growth.
Investment metrics
- 1% rule
- 1.64% ✓
- Cap rate
- 8.62%
- Cash-on-cash
- 8.31%
- DSCR
- 1.37
- GRM
- 5.1
CMA / ARV
No comps found within radius.
Projected returns pro-forma
-3.0% appreciation · 1.89% rent growth · sell at horizon
- IRR
- -5.2%
- Equity multiple
- 0.81×
- Total profit
- $-2,855
- Equity at exit
- $7,902
- IRR
- 2.7%
- Equity multiple
- 1.18×
- Total profit
- $2,689
- Equity at exit
- $4,582
Cash invested: $14,840 (down + closing). Projections, not guarantees.
Landlord ↔ Tenant lean methodology
- Overall (STATE)
- 83 Strongly Landlord-Friendly
- State Kentucky
- 83 Strongly Landlord-Friendly · R+16
- County
- — inherits STATE
- City
- — inherits STATE
ZIP-level market 40214
- Rents YoY
- 1.9%
- Active inventory
- 248
- Price-to-rent
- 5.1×
Monthly cashflow live
- Estimated rent
- $868 high interval (Pro) →
- Mortgage (P&I)
- −$278
- Tax from tax record
- −$58 /mo · $690/yr
- Insurance
- −$22
- HOA
- −$225
- Lot rent
- −$0
- Vacancy / Maint / Mgmt
- −$182
- Net cashflow
- $103
Break-even live
Sensitivity live
| Price | -10% $133 | -5% $118 | +0% $103 | +5% $88 | +10% $73 |
|---|---|---|---|---|---|
| Rent | -10% $34 | -5% $68 | +0% $103 | +5% $137 | +10% $171 |
| Rate | -1.0pp $129 | -0.5pp $116 | base $103 | +0.5pp $89 | +1.0pp $75 |
UW: 25.0% down · 7.5% · 30yr · 1.5% tax · 5.0% vac · 8.0% maint · 8.0% mgmt
Financing live
Cash to close
- Down payment
- $13,250
- Closing costs
- $1,590
- Reserves months
- —
- Total cash needed
- —
Loan-product check · same deal, 3 products live
Conventional
25% down · 7.5% · 30yr
- Down + closing
- —
- Monthly P&I
- —
- Monthly cashflow
- —
- DSCR
- —
- Eligible?
- —
Personal DTI + credit; lowest rate.
DSCR
20% down · 8.5% · 30yr
- Down + closing
- —
- Monthly P&I
- —
- Monthly cashflow
- —
- DSCR
- —
- Eligible?
- —
No personal income docs; deal must DSCR.
Hard money
10% down · 12.0% · 12mo
- Down + closing
- —
- Monthly P&I
- —
- Monthly cashflow
- —
- DSCR
- —
- Eligible?
- —
Short-term bridge; refi at stabilization.
Rent comps 22 comps
| Address | Beds | Baths | Sqft | Rent | $/sqft | DOM | Units | Dist |
|---|---|---|---|---|---|---|---|---|
| 4501 S 6th St #82 Louisville, KY | 1.0 | 1.0 | 538 | $775 | $1.44 | 19d | 1 | 0.02mi |
| 4600 Southern Pkwy Unit PARKWAYE1 Louisville, KY | 2.0 | 1.0 | 700 | $749 | $1.07 | 0d | 1 | 0.27mi |
| 554 Camden Ave Louisville, KY | 1.0 | 1.0 | 661 | $875 | $1.32 | 26d | 1 | 0.28mi |
| 309 W Whitney Ave Louisville, KY | 1.0 | 1.0 | 700 | $875 | $1.25 | 26d | 1 | 0.40mi |
| 4626 Southern Pkwy Louisville, KY | 1.0–2.0 | 1.0 | 809 | $825 | $1.02 | 17d | 3 | 0.42mi |
| 4619 Southern Pkwy Unit 3 Louisville, KY | 1.0 | 1.0 | 700 | $975 | $1.39 | 4d | 1 | 0.44mi |
| 4012 Southern Pkwy Unit 5 Louisville, KY | 1.0 | 1.0 | 600 | $795 | $1.32 | 26d | 1 | 0.49mi |
| 4012 Southern Pkwy Unit 8 Louisville, KY | 1.0 | 1.0 | 600 | $795 | $1.32 | 17d | 1 | 0.50mi |
| 4704 Southern Pkwy Unit A1 Louisville, KY | 1.0 | 1.0 | 750 | $775 | $1.03 | 0d | 1 | 0.54mi |
| 4704 Southern Pkwy Unit A1 Louisville, KY | 1.0 | 1.0 | 750 | $775 | $1.03 | 19d | 1 | 0.54mi |
| 1022 Stanley Ave Louisville, KY | 2.0 | 1.0 | 700 | $1,200 | $1.71 | 24d | 1 | 0.58mi |
| 4228 Allmond Ave Unit 2 Louisville, KY | 1.0 | 1.0 | 650 | $700 | $1.08 | 5d | 1 | 0.60mi |
| 623 Dresden Ave Louisville, KY | 2.0 | 1.0 | 750 | $975 | $1.30 | 18d | 1 | 0.62mi |
| 1105 Beecher St Louisville, KY | 2.0 | 1.0 | 708 | $1,150 | $1.62 | 18d | 1 | 0.63mi |
| 1111 Dresden Ave Louisville, KY | 2.0 | 1.0 | 680 | $1,100 | $1.62 | 18d | 1 | 0.83mi |
| 5011 Southside Dr Louisville, KY | 1.0–2.0 | 1.0 | 800 | $899 | $1.12 | 0d | 12 | 1.10mi |
| 5011 Southside Dr Louisville, KY | 1.0–2.0 | 1.0 | 800 | $899 | $1.12 | 26d | 1 | 1.10mi |
| 4122 Craig Ave Louisville, KY | 2.0 | 1.0 | 705 | $1,051 | $1.49 | 14d | 1 | 1.24mi |
| 1122 Larchmont Ave Unit B Louisville, KY | 1.0 | 1.0 | 700 | $750 | $1.07 | 19d | 1 | 1.31mi |
| 2805 S 4th St #1 Louisville, KY | 1.0 | 1.0 | 750 | $725 | $0.97 | 24d | 1 | 1.38mi |
| 705 M St Unit 1 Louisville, KY | 1.0 | 1.0 | 411 | $700 | $1.70 | 0d | 1 | 1.40mi |
| 1709 Valley Forge Way Unit 2 Louisville, KY | 2.0 | 1.0 | 750 | $895 | $1.19 | 24d | 1 | 1.46mi |
HOA detail condo
- Monthly dues
- $225 · $2,700/yr
- Likely covers
- watertrashlandscapinginsurance
- Assessments
- None detected in remarks — confirm with the listing agent.
Listing history 13 events
-
2026-06-22days on market $53,000 Active 20 DOM
-
2026-06-21days on market $53,000 Active 19 DOM
-
2026-06-18days on market $53,000 Active 16 DOM
-
2026-06-17days on market $53,000 Active 15 DOM
-
2026-06-16days on market $53,000 Active 14 DOM
-
2026-06-15days on market $53,000 Active 13 DOM
-
2026-06-13pricedays on market $53,000 Active 11 DOM
-
2026-06-10days on market $55,000 Active 8 DOM
-
2026-06-09days on market $55,000 Active 7 DOM
-
2026-06-08days on market $55,000 Active 6 DOM
-
2026-06-07days on market $55,000 Active 5 DOM
-
2026-06-02remarks 208-char remark
-
2026-06-02$55,000 Active 1 DOM
ⓘ Source: listings_history table (triggers on properties + properties_extension) + one-shot
backfill from property_details.listing_events for pre-trigger history.
Tax reassessment forecast KY · Resets to sale price
- Current annual tax
- $690 · $58/mo
- Projected year-2 tax
- $690 · $58/mo
- Expected delta
- $0/yr ($0/mo · 0.0%)
ⓘ Screening estimate from a state-policy table — verify with the county assessor before closing.
Climate risk First Street
- Flood 1/10 Low FEMA zone X (unshaded) · 0% chance over 30 yrs
- Wildfire 1/10 Low
- Heat 5/10 Major 7 d/yr ≥105°F today · 20 d/yr by 30 yrs out
- Wind 2/10 Low 2% chance of damaging wind over 30 yrs
- Air quality 2/10 Low 1 unhealthy d/yr today · 3 by 30 yrs out
Nearby sold comps map
Loading sold comps map…
Walkable amenities ~0.75 mi
Loading nearby amenities…
Taxation est. · year 1
- Rental income
- $10,410
- − Mortgage interest
- −$2,969
- − Property taxes
- −$690
- − Insurance
- −$265
- − Repairs & maintenance
- −$833
- − Management
- −$833
- − HOA
- −$2,700
- − Depreciation
- −$1,542
- Taxable income
- $578
- Est. tax owed @ 24.0%
- −$139
- After-tax cash flow
- $1,094/yr
For passive investors: Depreciation is non-cash, so a rental often shows a tax loss while cash-flowing — sheltering income. Rental losses are passive: they offset passive income freely, and up to $25,000/yr can offset ordinary (W-2) income if you actively participate and your MAGI is under $100k (phasing out to $0 by $150k); unused losses carry forward. On sale, claimed depreciation is recaptured at up to 25%, and gains may owe capital-gains tax (a 1031 exchange can defer both). Figures are a year-1 estimate at your 24.0% rate — not tax advice; consult a CPA.
Schools (NCES district)
- District
- Jefferson County
- NCES district ID
- 2102990
- Math proficiency
- 19% ▼ -17.00%
- Reading proficiency
- 35% ▼ -11.00%
- Median HH income
- $47,885
- Composite
- 23.45/100
- National rank
- #7884
- State rank
- #121 of 165 in KY
Livability — Louisville
- Score
- 63/100
- State rank
- #333
- US rank
- #15887
Category grades
Schools grade is shown separately in the Schools card above.
Census & demographics
- Census place
- Louisville, KY
- County
- Jefferson County · 790,184 people
- City population
- 769,292
- Metro
- Louisville/Jefferson County, KY-IN
- Population (ZIP)
- 45,405
- Household income
- $54,931
- Rent vs Own
- Severe rent burden
- 2054.0
Population outlook (Jefferson County) Hauer SSP2
- Today (2025)
- 823,112 people
- By 2030
- 849,343 · +3.2%
- By 2040
- 895,696 · +8.8%
- By 2050
- 933,630 · +13.4%
- By 2075
- 1,028,262 · +24.9%
- By 2100
- 1,072,675 · +30.3%
Race, ethnicity, and origin ACS 2023
- Neighborhood character
- Diverse neighborhood (Simpson 0.67)
- Race & ethnicity
- White 51% Black 22% Hispanic / Latino 14% Two or more races 12% Asian 7%
- Hispanic origin (detail)
- Mexican 3% Cuban 6%
- Common ancestry
- Slovak 1% Lithuanian 1% Serbian 1%
- Foreign-born
- 21% · Canada, Vietnam, Philippines
- Languages at home
- 74% English-only · Spanish 12% Vietnamese 3% Other Asian/Pacific 2%
Political lean MEDSL · Jefferson
- 2024 margin
- D (+16.6) · D 57.4% · R 40.9% · Other 1.7%
- 2008→2024 swing
- +4.5pp toward D · 2008: 12.0pp · 2024: 16.6pp
- All cycles
- 2024: D+16.6 2020: D+20.1 2016: D+13.3 2012: D+11.1 2008: D+12.0
Not yet ingested
- Civics
- —
Market trends
- HPI YoY
- ▼ -235.43%
- Current HPI
- 237.4062
- Rent YoY
- ▲ 1.89%
- Metro
- Louisville/Jefferson County, KY-IN
- State GDP YoY
- ▲ 1.81%
- F500 in state
- 4
Industry mix (Fortune 500 HQ in KY)
| Industry | F500 HQs | Revenue |
|---|---|---|
| Healthcare | 1 | $118B |
|
||
| Food / Beverage | 1 | $7B |
|
||
Price history
+112.4% since first listed8 events — show timeline
- 2026-06-02 Listed $55,000 Metro Search MLS
- 2023-01-24 Sold (Public Records) $54,800 Public Records
- 2023-01-20 Sold (MLS) $54,800 Metro Search MLS
- 2023-01-13 Pending — Metro Search MLS
- 2022-12-15 Contingent — Metro Search MLS
- 2022-11-15 Listed $55,000 Metro Search MLS
- 1999-04-15 Sold (MLS) $25,900 Metro Search MLS
- 1999-02-18 Listed $25,900 Metro Search MLS
Property tax history
+4.7%/yrLatest (2025): $690 · -1.9% YoY. Source: county tax records.
Cash-flow waterfall
monthlySold comps — $/sqft
last 12 mo · ≤1 miLoading sold comps…