140 Millers Mill Rd · Stockbridge, GA
Flood risk 6/10 · Moderate
- FEMA flood zone
- X (unshaded)
- Chance of flooding over 30 yrs
- 0.72%
- Est. flood insurance / yr
- $507 – $1,088
Fire risk 3/10 · Minor
- Est. fire insurance / yr
- $963 – $1,789
Heat risk 6/10 · Moderate
- Hot days now (above 106°F)
- 7 days/yr
- Hot days in 30 yrs
- 18 days/yr
Wind risk 6/10 · Moderate
- Chance of severe wind over 30 yrs
- 27.0%
Air-quality risk 4/10 · Minor
- Unhealthy air days now
- 4 days/yr
- Unhealthy air days in 30 yrs
- 6 days/yr
Risk factors via First Street. Map © Google.
Why this score? — see what drove the B grade
The composite is a weighted blend of 9 inputs, each scored 0–100. Each bar is that input's sub-score; the figure is the points it added to the 100-point composite (weight × sub-score).
- Cash flow +30.0/30.0
- ARV discount +12.6/15.0
- 1% rule +10.0/10.0
- DSCR +10.0/10.0
- Livability +3.0/5.0
- Rent growth +2.7/5.0
- Schools +2.6/10.0
- Condition / age +2.5/5.0
- Appreciation +0.0/10.0
$79,000
🖨 Deal sheet (PDF) 📄 Offer letter ✓ Due diligence
Listing remarks MLS
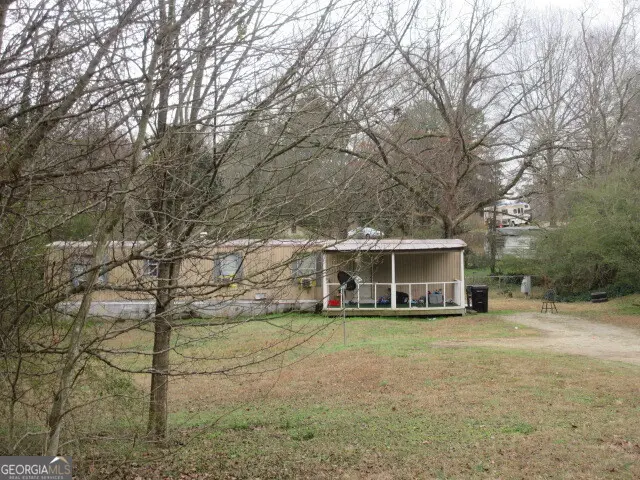
Affordable opportunity on approximately 0.42 acres. This property includes a 2 bedroom, 1 bath mobile home situated on its own land. No park. No monthly lot rent. Level lot with room for parking and outdoor use. Suitable for an owner-occupant or investor. Mobile home title is not retired. Property is being sold as-is. Property may be purchased individually or as part of a multi-property package. Additional locations available. Purchase options may be available for individual properties. All information is believed to be accurate but not guaranteed and should be independently verified.
Key facts
- Outdoor use
- Level lot
- Room for parking
Tags
Neighborhood map
What this means for you Summary
Snapshot
- This is a 2-bed/1.0-bath manufactured listed at $79k.
Deal economics
- At list price, monthly cash flow is $696 ($8k/yr) — positive.
- The deal already cash-flows at list — no discount required.
- Meets the 1% rule at list price ($2k rent vs $79k).
- Recommended offer: $70k (12.0% below list) — sets the bar for market timing.
- Cap rate 16.9% vs local median 4.2% in Stockbridge — top-decile yield for the area; either an underpriced asset or a hidden risk that comps aren't pricing in. Stress-test before assuming the spread holds.
Location & tenants
- Location reads 60/100 on livability (#389 in GA) — a middle-class / working-renter tenant base. Strengths: housing A+, cost of living A; Watch: crime D, amenities F, commute F.
- Henry County (rural): math 24% / reading 33% proficiency, ranked #89 of 174 in GA (top 51%) — low school quality limits family demand, transient renter base, plan for 1-2y turnover.
- Zoned schools: Pleasant Grove Elementary School (math 22% / reading 22%, grade F, #810 of 1,228 statewide, top 69%, 479 students, 62% FRL); Woodland Middle School (math 20% / reading 30%, grade F, #291 of 470 statewide, top 64%, 705 students, 53% FRL); Woodland High School (math 15% / reading 24%, grade F, #238 of 424 statewide, top 57%, 1,334 students, 42% FRL).
- Market conditions: Rents flat; 611 active listings in the ZIP; 3 comparable units currently listed for rent nearby; rentals leasing fast (median 1d on market — plan ~1-2 weeks tenant-placement turnaround); 1,989 units permitted in Henry County in 2024 (92 in 5+ unit buildings).
Forward outlook
- Local home prices are declining (-3.0%/yr); year-one equity from $546 of loan paydown is wiped out by about $2k of value loss. Plan a longer hold.
- Henry County population projected at +29% by 2050 — long-run rental-demand tailwind backs the buy-and-hold thesis.
- At projected returns (-3.0% appreciation + 0.9% rent growth), your $22k cash investment doubles in ~4 years — after that, you're playing with house money.
Negotiation context
- It's been on market 153 days — a 12% lower offer ($70k) is reasonable based on typical stale-listing flexibility.
- 2 sale attempts since 4y ago with the ask held roughly flat each time — persistent listings suggest the price (not the market) is what's stuck; bring a comps-based counter.
- Current owner paid $47k; list at $79k implies a 67% gain — meaningful room to come down on a strong offer.
Risks & watch-outs
- Climate carrying-cost: major flood risk; major wind risk, 27% chance of damaging wind over 30y; extreme-heat days projected 7→18/yr by 2055 (HVAC capex compounding) — expect insurance premiums to compound above CPI over the hold.
Questions for the listing agent
- It's been on market 153 days. Have you received any prior offers? Is the seller open to a 12% concession, seller financing, or rate buy-down credit?
- Built in 1979 — when were the roof, HVAC, electrical panel, plumbing, and water heater last replaced?
- Why hasn't it sold? Are there any deal-killer items the seller is aware of (foundation, flood, title, zoning, code violations)?
- Is there a deadline driving the sale (1031 exchange, divorce, estate, relocation)? That informs how much negotiation room exists.
- Schools are D-rated, which usually means shorter tenancies and higher turnover. Who's the typical renter profile here, and what's been the actual vacancy rate?
- Crime grade is D in this area — have there been break-ins, vandalism, or insurance claims at this property in the last 3 years? What carrier currently insures it and at what premium?
- What's the average days-on-market for RENTAL listings here right now (not sales)? A rising rental-DOM trend means longer vacancies and softer asking-rent achievability than the comps imply.
- What's the recent tenant-quality profile in this submarket — average credit score on applications, eviction rate, late-payment / NSF rate, and stable-employment percentage? A property-management company in the area should have these aggregated.
- How much new for-sale + rental construction is in the pipeline within 1–3 miles? Heavy new supply typically softens prices + rents 12–24 months out; constrained supply supports both.
Investment metrics
- 1% rule
- 2.02% ✓
- Cap rate
- 16.87%
- Cash-on-cash
- 37.77%
- DSCR
- 2.68
- GRM
- 4.1
CMA / ARV
- ARV (median comp)
- $89,000
- List price
- $79,000
- Delta
- -11.24%
- Verdict
- UNDERPRICED
- Comps
- 7 within 1.0 mi
Projected returns pro-forma
-3.0% appreciation · 0.87% rent growth · sell at horizon
- IRR
- 31.3%
- Equity multiple
- 2.28×
- Total profit
- $28,227
- Equity at exit
- $11,779
- IRR
- 37.3%
- Equity multiple
- 4.10×
- Total profit
- $68,657
- Equity at exit
- $6,830
Cash invested: $22,120 (down + closing). Projections, not guarantees.
Landlord ↔ Tenant lean methodology
- Overall (STATE)
- 90 Strongly Landlord-Friendly
- State Georgia
- 90 Strongly Landlord-Friendly · R+3
- County
- — inherits STATE
- City
- — inherits STATE
ZIP-level market 30281
- Home prices YoY
- -33.6%
- Rents YoY
- 0.9%
- Active inventory
- 611
- Price-to-rent
- 4.1×
Monthly cashflow live
- Estimated rent
- $1,595 medium interval (Pro) →
- Mortgage (P&I)
- −$414
- Tax from tax record
- −$117 /mo · $1,401/yr
- Insurance
- −$33
- HOA
- −$0
- Vacancy / Maint / Mgmt
- −$335
- Net cashflow
- $696
Break-even live
Sensitivity live
| Price | -10% $741 | -5% $719 | +0% $696 | +5% $674 | +10% $651 |
|---|---|---|---|---|---|
| Rent | -10% $570 | -5% $633 | +0% $696 | +5% $759 | +10% $822 |
| Rate | -1.0pp $736 | -0.5pp $716 | base $696 | +0.5pp $676 | +1.0pp $655 |
UW: 25.0% down · 7.5% · 30yr · 1.5% tax · 5.0% vac · 8.0% maint · 8.0% mgmt
Financing live
Cash to close
- Down payment
- $19,750
- Closing costs
- $2,370
- Reserves months
- —
- Total cash needed
- —
Loan-product check · same deal, 3 products live
Conventional
25% down · 7.5% · 30yr
- Down + closing
- —
- Monthly P&I
- —
- Monthly cashflow
- —
- DSCR
- —
- Eligible?
- —
Personal DTI + credit; lowest rate.
DSCR
20% down · 8.5% · 30yr
- Down + closing
- —
- Monthly P&I
- —
- Monthly cashflow
- —
- DSCR
- —
- Eligible?
- —
No personal income docs; deal must DSCR.
Hard money
10% down · 12.0% · 12mo
- Down + closing
- —
- Monthly P&I
- —
- Monthly cashflow
- —
- DSCR
- —
- Eligible?
- —
Short-term bridge; refi at stabilization.
Rent comps 3 comps
| Address | Beds | Baths | Sqft | Rent | $/sqft | DOM | Units | Dist |
|---|---|---|---|---|---|---|---|---|
| 10 Glenwood Way Stockbridge, GA | 1.0–3.0 | 1.0–2.0 | 981 | $1,496 | $1.52 | 0d | 21 | 0.34mi |
| 15 Dixie Dr Stockbridge, GA | 3.0 | 1.0 | 864 | $1,700 | $1.97 | 46d | 1 | 0.43mi |
| 1900 Waterford Lndg McDonough, GA | 1.0–3.0 | 1.5–2.0 | 1159 | $1,563 | $1.35 | 0d | 26 | 1.31mi |
Listing history 22 events
-
2026-06-21days on market $79,000 Active 153 DOM
-
2026-06-18days on market $79,000 Active 150 DOM
-
2026-06-17days on market $79,000 Active 149 DOM
-
2026-06-16days on market $79,000 Active 148 DOM
-
2026-06-15days on market $79,000 Active 147 DOM
-
2026-06-13days on market $79,000 Active 145 DOM
-
2026-06-09days on market $79,000 Active 141 DOM
-
2026-06-08days on market $79,000 Active 140 DOM
-
2026-06-07days on market $79,000 Active 139 DOM
-
2026-06-04days on market $79,000 Active 136 DOM
-
2026-06-03days on market $79,000 Active 135 DOM
-
2026-06-02days on market $79,000 Active 134 DOM
-
2026-06-01days on market $79,000 Active 133 DOM
-
2026-05-31days on market $79,000 Active 132 DOM
-
2026-01-19$79,000 New 603-char remark
Show marketing remark (603 chars)
Affordable opportunity on approximately 0.42 acres. This property includes a 2 bedroom, 1 bath mobile home situated on its own land. No park. No monthly lot rent. Level lot with room for parking and outdoor use. Suitable for an owner-occupant or investor. Mobile home title is not retired. Property is being sold as-is. Property may be purchased individually or as part of a multi-property package. Additional locations available. Purchase options may be available for individual properties. All information is believed to be accurate but not guaranteed and should be independently verified.
-
2022-09-27soldstatus $47,333
-
2022-09-22soldstatus $47,333 Sold 202-char remark
Show marketing remark (202 chars)
This will be a great investment property. Needs some repairs , Rental income for last 10 years $600 monthly. Bring all offers , very motivated seller. This property is SOLD AS IS, NO SELLER DISCLOSURE
-
2022-09-01status Under Contract 202-char remark
Show marketing remark (202 chars)
This will be a great investment property. Needs some repairs , Rental income for last 10 years $600 monthly. Bring all offers , very motivated seller. This property is SOLD AS IS, NO SELLER DISCLOSURE
-
2022-08-26$60,000 New 202-char remark
Show marketing remark (202 chars)
This will be a great investment property. Needs some repairs , Rental income for last 10 years $600 monthly. Bring all offers , very motivated seller. This property is SOLD AS IS, NO SELLER DISCLOSURE
-
1997-11-07soldstatus $23,000
-
1994-07-25soldstatus $25,000
-
1981-10-01soldstatus $6,500
ⓘ Source: listings_history table (triggers on properties + properties_extension) + one-shot
backfill from property_details.listing_events for pre-trigger history.
Tax reassessment forecast GA · Resets to sale price
- Current annual tax
- $1,401 · $117/mo
- Projected year-2 tax
- $1,401 · $117/mo
- Expected delta
- $0/yr ($0/mo · 0.0%)
ⓘ Screening estimate from a state-policy table — verify with the county assessor before closing.
Climate risk First Street
- Flood 6/10 Major FEMA zone X (unshaded) · 72% chance over 30 yrs
- Wildfire 3/10 Moderate
- Heat 6/10 Major 7 d/yr ≥106°F today · 18 d/yr by 30 yrs out
- Wind 6/10 Major 27% chance of damaging wind over 30 yrs
- Air quality 4/10 Moderate 4 unhealthy d/yr today · 6 by 30 yrs out
Nearby sold comps map
Loading sold comps map…
Walkable amenities ~0.75 mi
Loading nearby amenities…
Taxation est. · year 1
- Rental income
- $19,142
- − Mortgage interest
- −$4,425
- − Property taxes
- −$1,401
- − Insurance
- −$395
- − Repairs & maintenance
- −$1,531
- − Management
- −$1,531
- − Depreciation
- −$2,298
- Taxable income
- $7,559
- Est. tax owed @ 24.0%
- −$1,814
- After-tax cash flow
- $6,540/yr
For passive investors: Depreciation is non-cash, so a rental often shows a tax loss while cash-flowing — sheltering income. Rental losses are passive: they offset passive income freely, and up to $25,000/yr can offset ordinary (W-2) income if you actively participate and your MAGI is under $100k (phasing out to $0 by $150k); unused losses carry forward. On sale, claimed depreciation is recaptured at up to 25%, and gains may owe capital-gains tax (a 1031 exchange can defer both). Figures are a year-1 estimate at your 24.0% rate — not tax advice; consult a CPA.
Schools (NCES district)
- District
- Henry County
- NCES district ID
- 1302820
- Math proficiency
- 24% ▼ -9.00%
- Reading proficiency
- 33% ▼ -7.00%
- Median HH income
- $62,594
- Composite
- 26.13/100
- National rank
- #7279
- State rank
- #89 of 174 in GA
Livability — Stockbridge
- Score
- 60/100
- State rank
- #389
- US rank
- #19479
Category grades
Schools grade is shown separately in the Schools card above.
Census & demographics
- County
- Henry County · 316,359 people
- City population
- 71,603
- Metro
- Atlanta-Sandy Springs-Alpharetta, GA
- Population (ZIP)
- 71,603
- Household income
- $71,213
- Rent vs Own
- Severe rent burden
- 2464.0
Population outlook (Henry County) Hauer SSP2
- Today (2025)
- 249,041 people
- By 2030
- 264,369 · +6.2%
- By 2040
- 294,459 · +18.2%
- By 2050
- 322,249 · +29.4%
- By 2075
- 392,310 · +57.5%
- By 2100
- 437,836 · +75.8%
Race, ethnicity, and origin ACS 2023
- Neighborhood character
- Diverse neighborhood (Simpson 0.61)
- Race & ethnicity
- Black 55% White 28% Hispanic / Latino 11% Two or more races 6% Asian 4%
- Hispanic origin (detail)
- Mexican 7%
- Common ancestry
- Hispanic 1% Italian 1% Romanian 1%
- Foreign-born
- 9% · Canada, Vietnam
- Languages at home
- 86% English-only · Spanish 8% Vietnamese 2% French/Haitian/Cajun 1%
Political lean MEDSL · Henry
- 2024 margin
- Strong D (+29.7) · D 64.5% · R 34.9%
- 2008→2024 swing
- +37.1pp toward D · 2008: -7.5pp · 2024: 29.7pp
- All cycles
- 2024: D+29.7 2020: D+20.5 2016: D+4.3 2012: R+3.2 2008: R+7.5
Not yet ingested
- Civics
- —
Market trends
- HPI YoY
- ▼ -104.76%
- Current HPI
- 207.2332
- Rent YoY
- ▲ 0.87%
- Metro
- Atlanta-Sandy Springs-Alpharetta, GA
- State GDP YoY
- ▲ 2.66%
- F500 in state
- 28
Industry mix (Fortune 500 HQ in GA)
| Industry | F500 HQs | Revenue |
|---|---|---|
| Paper / Packaging | 2 | $29B |
|
||
| Retail | 1 | $160B |
|
||
| Transportation / Logistics | 1 | $91B |
|
||
| Airlines | 1 | $62B |
|
||
| Consumer Goods | 1 | $47B |
|
||
| Utilities | 1 | $25B |
|
||
Price history
+1115.4% since first listed8 events — show timeline
- 2026-01-19 Listed $79,000 GAMLS
- 2022-09-27 Sold (Public Records) $47,333 Public Records
- 2022-09-22 Sold (MLS) $47,333 GAMLS
- 2022-09-01 Pending — GAMLS
- 2022-08-26 Listed $60,000 GAMLS
- 1997-11-07 Sold (Public Records) $23,000 Public Records
- 1994-07-25 Sold (Public Records) $25,000 Public Records
- 1981-10-01 Sold (Public Records) $6,500 Public Records
Property tax history
+5.7%/yrLatest (2025): $1,401 · +50.4% YoY. Source: county tax records.
Cash-flow waterfall
monthlySold comps — $/sqft
last 12 mo · ≤1 miLoading sold comps…