 Duplex
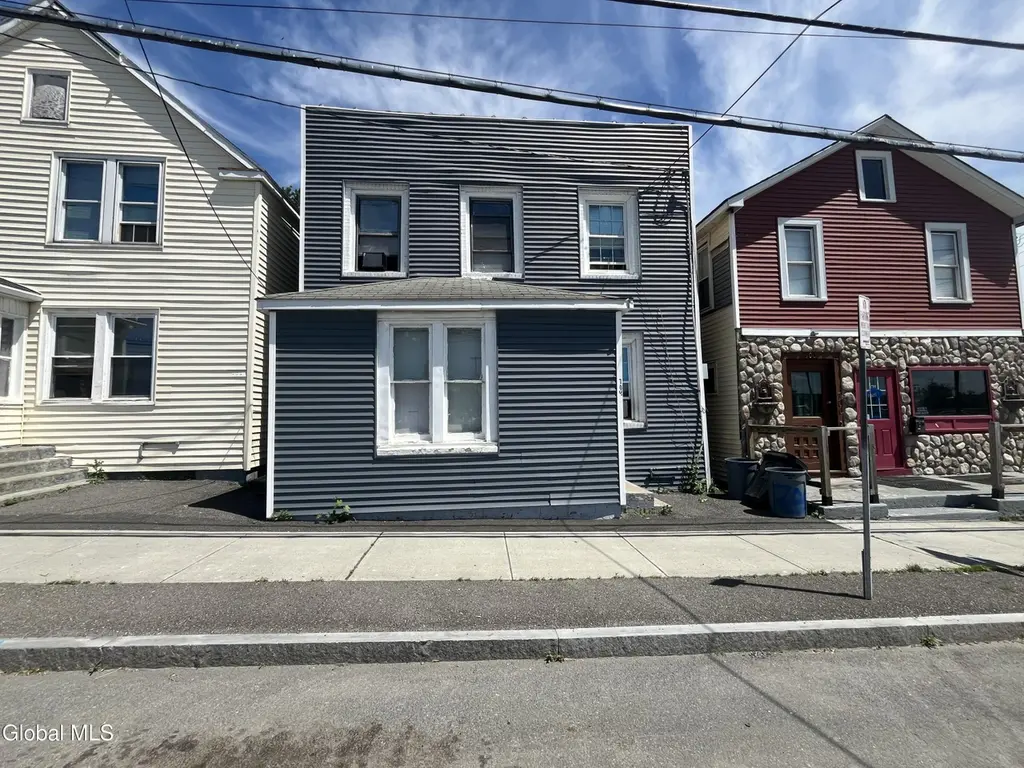
704 East St · Rensselaer, NY
Flood risk 9/10 · Severe
- FEMA flood zone
- AO
- Chance of flooding over 30 yrs
- 0.99%
- Est. flood insurance / yr
- $1,327 – $3,136
Fire risk 3/10 · Minor
- Est. fire insurance / yr
- $691 – $1,283
Heat risk 4/10 · Minor
- Hot days now (above 98°F)
- 7 days/yr
- Hot days in 30 yrs
- 17 days/yr
Wind risk 3/10 · Minor
- Chance of severe wind over 30 yrs
- 6.0%
Air-quality risk 2/10 · Minimal
- Unhealthy air days now
- 0 days/yr
- Unhealthy air days in 30 yrs
- 1 days/yr
Risk factors via First Street. Map © Google.
Why this score? — see what drove the B grade
The composite is a weighted blend of 9 inputs, each scored 0–100. Each bar is that input's sub-score; the figure is the points it added to the 100-point composite (weight × sub-score).
- Cash flow +30.0/30.0
- 1% rule +10.0/10.0
- DSCR +10.0/10.0
- ARV discount +9.2/15.0
- Livability +3.9/5.0
- Rent growth +2.7/5.0
- Schools +2.7/10.0
- Condition / age +2.5/5.0
- Appreciation +0.0/10.0
$214,900
🖨 Deal sheet 📄 Offer letter ✓ Due diligence
Multi-family units
County records classify this as Multi-Family (2-4 Unit). Listing-text estimate: 2 units. confirmed
Listing remarks MLS
Great property for rental income. Large rooms, good solid structure, 2 bedrooms, plus closed porches and rear decks, nice back yard, newer mechanicals, new electric. Possible owner financing with 50% down. lets talk!! Very Good Condition
Key facts
- Close to schools
- 2-family home
- Bright living spaces
Tags
Property features AI
Finance
- Financial info: Two-unit property; Tenants pay trash collection, internet, electricity and gas; Owner pays sewer
Exterior
- Utilities: Public water; Public sewer
- Home design: Duplex; Entry level includes main and basement levels
- Construction: Vinyl siding; Permanent foundation; Rubber roof; Built area approximately 1,996 (living area provided)
- Exterior features: Front porch; Rear porch; Deck; Wire fencing; Level lot
Interior
- Bedrooms: Unit 1: 2 bedrooms (both on 1st floor); Unit 2: 3 bedrooms
- Flooring: Vinyl; Carpet; Laminate
- Bathrooms: 2 full bathrooms (one on 1st floor, one on 2nd floor); Each unit has 1 full bath
- Heating & cooling: Baseboard heating; Hot water heating; Natural gas
- Interior features: High-speed internet available; Full basement with walk-out access
- Laundry & utility: Laundry on main level and in basement
Neighborhood map
What this means for you Summary
Snapshot
- This is a 2 × 2-bed/1.0-bath units multifamily listed at $215k.
Deal economics
- At list price, monthly cash flow is $1k ($13k/yr) — positive. Per door: $528/mo.
- The deal already cash-flows at list — no discount required.
- Meets the 1% rule at list price ($4k rent vs $215k).
- Recommended offer: $212k (1.5% below list) — sets the bar for market timing.
- Cap rate 13.2% vs local median 5.0% in Rensselaer — top-decile yield for the area; either an underpriced asset or a hidden risk that comps aren't pricing in. Stress-test before assuming the spread holds.
Location & tenants
- Location reads 77/100 on livability (#191 in NY, #2,967 nationally) — a middle-class / working-renter tenant base. Strengths: commute A+, housing A+, health & safety A+; Watch: schools C-, crime D+.
- Rensselaer City School District (suburban): math 28% / reading 34% proficiency, ranked #574 of 590 in NY (top 97%) — families likely to look elsewhere, expect single-tenant / working-renter base with shorter leases.
- Market conditions: Rents flat; 102 active listings in the ZIP; 4 comparable units currently listed for rent nearby; rentals lingering (median 44d on market — plan ~5-8 weeks vacancy on turnover, expect pricing pressure); 75% of comp listings sitting > 30 days — soft ceiling on asking rent; solid renter incomes; 405 units permitted in Rensselaer County in 2024 (224 in 5+ unit buildings).
- At $3,505/mo this rent would consume 46% of the median local household income ($91k/yr) (locally 541% of renters already pay >50% of income on rent) — very limited rent-growth headroom before tenants either downsize or default.
Forward outlook
- Local home prices are declining (-3.0%/yr); year-one equity from $1k of loan paydown is wiped out by about $6k of value loss. Plan a longer hold.
- Rensselaer County population projected to shrink 6% by 2050 — rents likely to lag national; underwrite the cash flow, not the appreciation.
- At projected returns (-3.0% appreciation + 0.9% rent growth), your $60k cash investment doubles in ~7 years — after that, you're playing with house money.
Negotiation context
- It's been on market 21 days — a 2% lower offer ($212k) is reasonable based on typical stale-listing flexibility.
- 2 sale attempts since 10y ago with the ask held roughly flat each time — persistent listings suggest the price (not the market) is what's stuck; bring a comps-based counter.
- Current owner paid $60k; list at $215k implies a 258% gain — meaningful room to come down on a strong offer.
Risks & watch-outs
- Watch-outs: flood insurance adds $186/mo; built in 1920 — expect roof / HVAC / electrical / plumbing capex.
- Climate carrying-cost: in FEMA flood zone AO (mandatory federal flood insurance) — expect insurance premiums to compound above CPI over the hold.
Questions for the listing agent
- Can we see the unit-by-unit rent roll, current vacancy, and any below-market leases? What's the average tenancy length?
- What capital expenditures (roof, boiler, parking lot, exteriors) have been made in the last 5 years, and what's planned in the next 2?
- Built in 1920 — when were the roof, HVAC, electrical panel, plumbing, and water heater last replaced?
- What's the actual annual flood-insurance premium (NFIP or private), and is the property in a SFHA with mandatory coverage?
- Is there a deadline driving the sale (1031 exchange, divorce, estate, relocation)? That informs how much negotiation room exists.
- Crime grade is D in this area — have there been break-ins, vandalism, or insurance claims at this property in the last 3 years? What carrier currently insures it and at what premium?
- What's the average days-on-market for RENTAL listings here right now (not sales)? A rising rental-DOM trend means longer vacancies and softer asking-rent achievability than the comps imply.
- What's the recent tenant-quality profile in this submarket — average credit score on applications, eviction rate, late-payment / NSF rate, and stable-employment percentage? A property-management company in the area should have these aggregated.
- How much new apartment / multifamily construction is in the pipeline within 1–3 miles? Heavy new supply (>2% of stock underway) typically softens rents 12–24 months out; light construction supports rent growth.
Investment metrics
- 1% rule
- 1.63% ✓
- Cap rate
- 13.23%
- Cash-on-cash
- 24.79%
- DSCR
- 2.10
- GRM
- 5.1
CMA / ARV
- ARV (on-the-fly)
- $223,552
- Comps found
- 11
Show comp detail 11 sales within ~0.75 mi
| Address | Dist | Beds/Ba | Sqft | Sold | Price | $/sf | Match |
|---|---|---|---|---|---|---|---|
| 76 Elm St | 0.15mi | 4/2.0 | 1,902 (-5%) | 11mo | $240,000 | $126 | 76 |
| 35 Partition St | 0.13mi | 4/2.0 | 2,150 (+8%) | 8mo | $225,000 | $105 | 74 |
| 742 East St | 0.06mi | 3/3.0 (-1) | 2,037 (+2%) | 15mo | $231,000 | $113 | 73 |
| 1001 3rd St | 0.30mi | 4/2.0 | 2,068 (+4%) | 12mo | $230,000 | $111 | 70 |
| 45 2nd Ave | 0.55mi | 4/2.0 | 2,004 (+0%) | 9mo | $170,000 | $85 | 66 |
| 820 1st St | 0.16mi | 3/2.0 (-1) | 1,764 (-12%) | 8mo | $205,000 | $116 | 62 |
| 800 3rd St | 0.16mi | 5/2.0 (+1) | 2,204 (+10%) | 14mo | $314,999 | $143 | 58 |
| 1447 Broadway | 0.70mi | 5/2.0 (+1) | 2,138 (+7%) | 3mo | $235,000 | $110 | 48 |
| 114 3rd Ave | 0.52mi | 5/2.0 (+1) | 2,258 (+13%) | 1mo | $310,000 | $137 | 48 |
| 47 Pine St | 0.45mi | 4/2.0 | 1,772 (-11%) | 19mo | $170,000 | $96 | 45 |
| 8-10 Spruce St | 0.73mi | 4/2.0 | 2,240 (+12%) | 7mo | $251,000 | $112 | 39 |
Match score weights: distance 35% · size 25% · config 20% · recency 20%. Top-matched comps best support the ARV.
Projected returns pro-forma
-3.0% appreciation · 0.9% rent growth · sell at horizon
- IRR
- 11.0%
- Equity multiple
- 1.42×
- Total profit
- $25,432
- Equity at exit
- $32,042
- IRR
- 18.1%
- Equity multiple
- 2.35×
- Total profit
- $81,069
- Equity at exit
- $18,581
Cash invested: $60,172 (down + closing). Projections, not guarantees.
Landlord ↔ Tenant lean methodology
- Overall (STATE)
- 15 Strongly Tenant-Friendly
- State New York
- 15 Strongly Tenant-Friendly · D+10
- County
- — inherits STATE
- City
- — inherits STATE
ZIP-level market 12144
- Home prices YoY
- -33.4%
- Rents YoY
- 0.9%
- Active inventory
- 102
- Price-to-rent
- 10.2×
Monthly cashflow live
- Estimated rent
- $3,505 high interval (Pro) →
- Mortgage (P&I)
- −$1,127
- Tax from tax record
- −$310 /mo · $3,715/yr
- Insurance
- −$90
- Flood insurance flood zone
- −$186 /mo · $2,232/yr
- HOA
- −$0
- Vacancy / Maint / Mgmt
- −$736
- Net cashflow
- $1,057
Break-even live
2-unit breakdown (identical units grouped — click to expand)
| Units | Beds | Baths | Est. rent |
|---|---|---|---|
| 2× units | 2 | 1 | $3,504 |
| #1 | 2 | 1 | $1,752 |
| #2 | 2 | 1 | $1,752 |
| Total (2 units) | $3,505 | ||
UW: 25.0% down · 7.5% · 30yr · 1.5% tax · 5.0% vac · 8.0% maint · 8.0% mgmt
Financing live
Cash to close
- Down payment
- $53,725
- Closing costs
- $6,447
- Reserves months
- —
- Total cash needed
- —
Loan-product check · same deal, 3 products live
Conventional
25% down · 7.5% · 30yr
- Down + closing
- —
- Monthly P&I
- —
- Monthly cashflow
- —
- DSCR
- —
- Eligible?
- —
Personal DTI + credit; lowest rate.
DSCR
20% down · 8.5% · 30yr
- Down + closing
- —
- Monthly P&I
- —
- Monthly cashflow
- —
- DSCR
- —
- Eligible?
- —
No personal income docs; deal must DSCR.
Hard money
10% down · 12.0% · 12mo
- Down + closing
- —
- Monthly P&I
- —
- Monthly cashflow
- —
- DSCR
- —
- Eligible?
- —
Short-term bridge; refi at stabilization.
Rent comps 4 comps
| Address | Beds | Baths | Sqft | Rent | $/sqft | DOM | Units | Dist |
|---|---|---|---|---|---|---|---|---|
| 119 Grand St Albany, NY | 3.0 | 1.0 | 1600 | $1,300 | $0.81 | 43d | 1 | 0.96mi |
| 32 1st St Albany, NY | 4.0 | 1.5 | 1773 | $1,850 | $1.04 | 43d | 1 | 1.11mi |
| 346 Madison Ave Albany, NY | 3.0 | 2.0 | 1500 | $2,495 | $1.66 | 23d | 1 | 1.37mi |
| 201 Park Ave Unit 10 Albany, NY | 3.0 | 2.0 | 1600 | $2,100 | $1.31 | 43d | 1 | 1.43mi |
Listing history 20 events
-
2026-06-18days on market $214,900 Active 21 DOM
-
2026-06-17days on market $214,900 Active 20 DOM
-
2026-06-16pricedays on market $214,900 Active 19 DOM
-
2026-06-15days on market $219,900 Active 18 DOM
-
2026-06-14days on market $219,900 Active 16 DOM
-
2026-06-10days on market $219,900 Active 13 DOM
-
2026-06-09days on market $219,900 Active 12 DOM
-
2026-06-08days on market $219,900 Active 11 DOM
-
2026-06-07days on market $219,900 Active 10 DOM
-
2026-06-05days on market $219,900 Active 7 DOM
-
2026-06-03days on market $219,900 Active 6 DOM
-
2026-06-02days on market $219,900 Active 5 DOM
-
2026-06-01days on market $219,900 Active 4 DOM
-
2026-05-31days on market $219,900 Active 3 DOM
-
2026-05-31days on market $219,900 Active 2 DOM
-
2026-05-28$219,900 Active
-
2016-12-05soldstatus $60,000
-
2016-09-16soldstatus $60,000 Closed (Final Sale) 237-char remark
Show marketing remark (237 chars)
Great property for rental income. Large rooms, good solid structure, 2 bedrooms, plus closed porches and rear decks, nice back yard, newer mechanicals, new electric. Possible owner financing with 50% down. lets talk!! Very Good Condition
-
2016-08-30status Pend (Under Cntr) 237-char remark
Show marketing remark (237 chars)
Great property for rental income. Large rooms, good solid structure, 2 bedrooms, plus closed porches and rear decks, nice back yard, newer mechanicals, new electric. Possible owner financing with 50% down. lets talk!! Very Good Condition
-
2016-08-02$66,650 New 237-char remark
Show marketing remark (237 chars)
Great property for rental income. Large rooms, good solid structure, 2 bedrooms, plus closed porches and rear decks, nice back yard, newer mechanicals, new electric. Possible owner financing with 50% down. lets talk!! Very Good Condition
ⓘ Source: listings_history table (triggers on properties + properties_extension) + one-shot
backfill from property_details.listing_events for pre-trigger history.
Tax reassessment forecast NY · Partial reset (capped growth)
- Current annual tax
- $3,715 · $310/mo
- Projected year-2 tax
- $3,715 · $310/mo
- Expected delta
- $0/yr ($0/mo · 0.0%)
ⓘ Screening estimate from a state-policy table — verify with the county assessor before closing.
Climate risk First Street
- Flood 9/10 Extreme FEMA zone AO · 99% chance over 30 yrs
- Wildfire 3/10 Moderate
- Heat 4/10 Moderate 7 d/yr ≥98°F today · 17 d/yr by 30 yrs out
- Wind 3/10 Moderate 6% chance of damaging wind over 30 yrs
- Air quality 2/10 Low 0 unhealthy d/yr today · 1 by 30 yrs out
Nearby sold comps map
Loading sold comps map…
Walkable amenities ~0.75 mi
Loading nearby amenities…
Taxation est. · year 1
- Rental income
- $42,060
- − Mortgage interest
- −$12,038
- − Property taxes
- −$3,715
- − Insurance
- −$3,306
- − Repairs & maintenance
- −$3,365
- − Management
- −$3,365
- − Depreciation
- −$6,252
- Taxable income
- $10,020
- Est. tax owed @ 24.0%
- −$2,405
- After-tax cash flow
- $10,278/yr
For passive investors: Depreciation is non-cash, so a rental often shows a tax loss while cash-flowing — sheltering income. Rental losses are passive: they offset passive income freely, and up to $25,000/yr can offset ordinary (W-2) income if you actively participate and your MAGI is under $100k (phasing out to $0 by $150k); unused losses carry forward. On sale, claimed depreciation is recaptured at up to 25%, and gains may owe capital-gains tax (a 1031 exchange can defer both). Figures are a year-1 estimate at your 24.0% rate — not tax advice; consult a CPA.
Schools (NCES district)
- District
- Rensselaer City School District
- NCES district ID
- 3624450
- Math proficiency
- 28% ▼ -2.00%
- Reading proficiency
- 34% ▼ -1.00%
- Median HH income
- $48,665
- Composite
- 26.89/100
- National rank
- #7096
- State rank
- #574 of 590 in NY
Livability — Rensselaer
- Score
- 77/100
- State rank
- #191
- US rank
- #2967
Category grades
Schools grade is shown separately in the Schools card above.
Census & demographics
- Census place
- Rensselaer, NY
- County
- Rensselaer County · 75,590 people
- City population
- 22,111
- Metro
- Albany-Schenectady-Troy, NY
- Population (ZIP)
- 22,111
- Household income
- $90,738
- Rent vs Own
- Severe rent burden
- 541.0
Population outlook (Rensselaer County) Hauer SSP2
- Today (2025)
- 162,400 people
- By 2030
- 161,746 · -0.4%
- By 2040
- 158,095 · -2.7%
- By 2050
- 152,966 · -5.8%
- By 2075
- 140,767 · -13.3%
- By 2100
- 124,727 · -23.2%
Race, ethnicity, and origin ACS 2023
- Neighborhood character
- Predominantly White (76%)
- Race & ethnicity
- White 76% Two or more races 8% Asian 7% Hispanic / Latino 6% Black 6%
- Hispanic origin (detail)
- Puerto Rican 4%
- Common ancestry
- Romanian 7% Lithuanian 6% Iranian 3%
- Foreign-born
- 7% · Philippines, Canada, China
- Languages at home
- 91% English-only · Other Asian/Pacific 3% Spanish 2% Chinese 1%
Political lean MEDSL · Rensselaer
- 2024 margin
- Toss-up / Even · D 50.7% · R 49.3%
- 2008→2024 swing
- -8.0pp toward R · 2008: 9.3pp · 2024: 1.4pp
- All cycles
- 2024: D+1.4 2020: D+5.6 2016: R+2.9 2012: D+11.8 2008: D+9.3
Not yet ingested
- Civics
- —
Market trends
- HPI YoY
- ▼ -138.26%
- Current HPI
- 276.2239
- Rent YoY
- ▲ 0.90%
- Metro
- Albany-Schenectady-Troy, NY
- State GDP YoY
- ▲ 2.60%
- F500 in state
- 92
Industry mix (Fortune 500 HQ in NY)
| Industry | F500 HQs | Revenue |
|---|---|---|
| Financial Services | 10 | $950B |
|
||
| Consumer Goods | 9 | $162B |
|
||
| Insurance | 4 | $225B |
|
||
| Telecommunications | 2 | $144B |
|
||
| Pharmaceuticals | 2 | $112B |
|
||
| Media / Entertainment | 2 | $69B |
|
||
Price history
+229.9% since first listed5 events — show timeline
- 2026-05-28 Listed $219,900 Global MLS
- 2016-12-05 Sold (Public Records) $60,000 Public Records
- 2016-09-16 Sold (MLS) $60,000 Global MLS
- 2016-08-30 Pending — Global MLS
- 2016-08-02 Listed $66,650 Global MLS
Property tax history
+7.3%/yrLatest (2025): $3,715 · +0.1% YoY. Source: county tax records.
Cash-flow waterfall
monthlySold comps — $/sqft
last 12 mo · ≤1 miLoading sold comps…