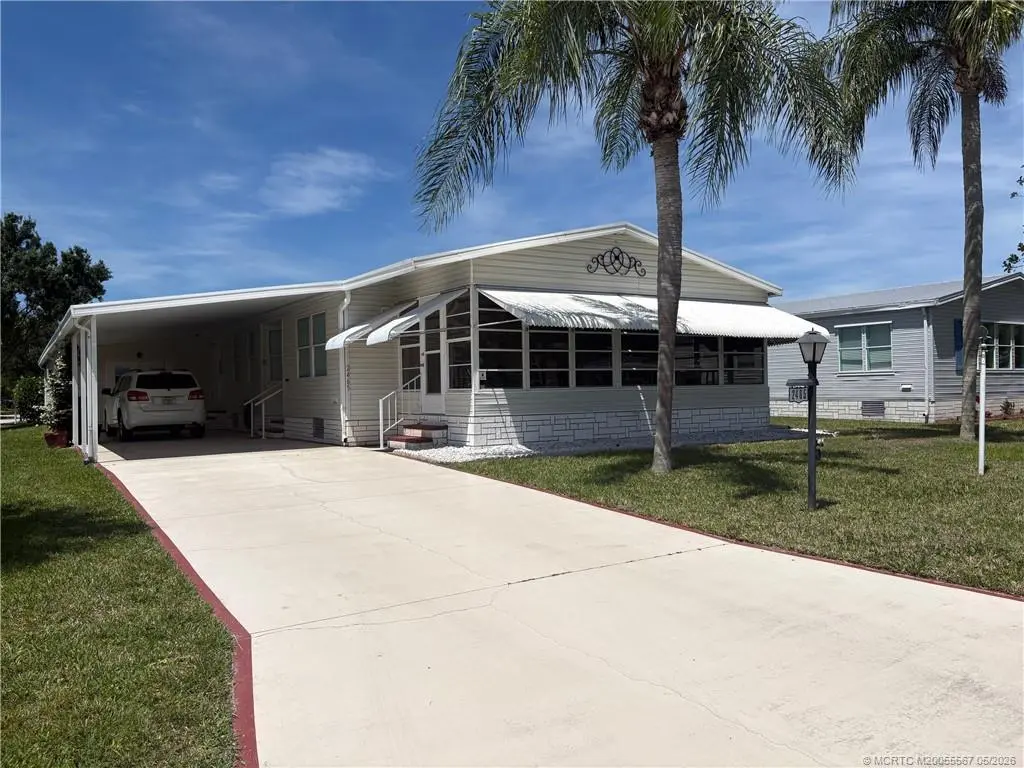
2465 SW Versailles Ter · Stuart, FL
Flood risk 1/10 · Minimal
- FEMA flood zone
- X (unshaded)
- Chance of flooding over 30 yrs
- 0.0%
- Est. flood insurance / yr
- $507 – $1,088
Fire risk 3/10 · Minor
- Est. fire insurance / yr
- $947 – $1,759
Heat risk 10/10 · Severe
- Hot days now (above 107°F)
- 7 days/yr
- Hot days in 30 yrs
- 25 days/yr
Wind risk 10/10 · Severe
- Chance of severe wind over 30 yrs
- 99.0%
Air-quality risk 2/10 · Minimal
- Unhealthy air days now
- 1 days/yr
- Unhealthy air days in 30 yrs
- 1 days/yr
Risk factors via First Street. Map © Google.
Why this score? — see what drove the D- grade
The composite is a weighted blend of 9 inputs, each scored 0–100. Each bar is that input's sub-score; the figure is the points it added to the 100-point composite (weight × sub-score).
- Cash flow +14.9/30.0
- DSCR +4.6/10.0
- Schools +4.5/10.0
- Livability +4.2/5.0
- 1% rule +3.6/10.0
- Rent growth +3.2/5.0
- Condition / age +2.5/5.0
- ARV discount +0.0/15.0
- Appreciation +0.0/10.0
$224,900
🖨 Deal sheet (PDF) 📄 Offer letter ✓ Due diligence
Listing remarks
This is a must-see home located in an active community with 2 clubhouses, 2 pools, tennis court, pickle ball, shuffleboard. Home shows like a model, bright and open plan with 2 large bedrooms, 2 baths. Roman tub in main bathroom does not work and has not been used. Front Florida Room, Island kitchen with cooktop and wall oven off family room. Living room with room galore. You own the land in this hidden gem in Martin County. Extra large workshop/shed attached to carport for all your hobbies and projects. 2 pets allowed. RV/boat storage available for separate fee. Home sold "as-is" with right to inspect. Recent inspection discovered polybutylene pipes on property.
Key facts
- 6,621 sq ft lot
- Parking
- Built 1995
Property features AI
Finance
- Financial info: Pets allowed with number limit
- HOA & community: Homeowners association with a monthly fee (includes association management, common areas, cable TV, and reserve fund); Community amenities include bocce court, pickleball, shuffleboard, tennis courts, and on-site property manager; Non-gated, senior community
Exterior
- Parking: Attached carport; Carport (1 covered space, total 1 parking space)
- Security: Smoke detector(s)
- Utilities: Cable available; Electricity available; Public water (connected); Public sewer (connected)
- Home design: Single-story home; Faces south; Resale mobile home (Palm Harbor model)
- Construction: Vinyl siding; Metal roof; Built as a mobile/home unit
- Exterior features: Sprinkler/irrigation system (automatic); Shed(s)
Interior
- Kitchen: Cooktop; Dishwasher; Disposal; Refrigerator; Kitchen island; Kitchen/dining combo
- Bedrooms: Bedroom 2 on main level
- Flooring: Carpet; Tile
- Bathrooms: 2 full bathrooms; Dual sinks in bathroom(s); Separate shower
- Heating & cooling: Central heating (electric); Ceiling fans
- Interior features: Partially furnished; Built-in features; Cathedral ceilings; Dual sinks; Kitchen island; Kitchen/dining combo; Separate shower; Stacked bedrooms; Metal single-hung windows
- Laundry & utility: Washer; Dryer; Water heater; Utility room on main level (approx. 5 x 7)
Neighborhood map
What this means for you Summary
Snapshot
- This is a 3-bed/2.0-bath manufactured listed at $225k.
Deal economics
- At list price, monthly cash flow is $66 ($788/yr) — positive.
- The deal already cash-flows at list — no discount required.
- To meet the 1% rule (rent ≥ 1% of price), the offer needs to be $193k (14.3% below list).
- Recommended offer: $193k (14.3% below list) — sets the bar for 1% rule.
- Cap rate 6.6% vs local median 3.5% in Stuart — top-decile yield for the area; either an underpriced asset or a hidden risk that comps aren't pricing in. Stress-test before assuming the spread holds.
Location & tenants
- Location reads 84/100 on livability (#39 in FL, #790 nationally) — a professional / high-income tenant draw. Strengths: commute A+, housing A+, health & safety A+; Watch: crime C-, employment C-, amenities D.
- Martin (suburban): math 52% / reading 53% proficiency, ranked #24 of 73 in FL (top 33%) — acceptable for families but not a draw, mixed tenant base, ~2y average lease.
- Zoned schools: Crystal Lake Elementary School (math 51% / reading 58%, grade C, #892 of 2,144 statewide, top 44%, 441 students, 38% FRL); Dr. David L. Anderson Middle School (math 51% / reading 46%, grade C-, #274 of 571 statewide, top 50%, 1,035 students, 63% FRL); South Fork High School (math 36% / reading 48%, grade F, #275 of 667 statewide, top 42%, 1,810 students, 51% FRL).
- Market conditions: Rents rising (+2.7%/yr); 595 active listings in the ZIP; 3 comparable units currently listed for rent nearby; rentals at typical pace (median 26d on market — plan ~3-4 weeks tenant-placement turnaround); solid renter incomes; 737 units permitted in Martin County in 2024 (167 in 5+ unit buildings).
Forward outlook
- Local home prices are declining (-3.0%/yr); year-one equity from $2k of loan paydown is wiped out by about $7k of value loss. Plan a longer hold.
- Martin County population projected at +19% by 2050 — long-run rental-demand tailwind backs the buy-and-hold thesis.
Negotiation context
- It's been on market 39 days — a 3% lower offer ($218k) is reasonable based on typical stale-listing flexibility.
- Current owner paid $99k; list at $225k implies a 128% gain — meaningful room to come down on a strong offer.
Risks & watch-outs
- Climate carrying-cost: severe wind risk, 99% chance of damaging wind over 30y; extreme-heat days projected 7→25/yr by 2055 (HVAC capex compounding) — expect insurance premiums to compound above CPI over the hold.
Questions for the listing agent
- It's been on market 39 days. Have you received any prior offers? Is the seller open to a 14% concession, seller financing, or rate buy-down credit?
- What does the HOA fee cover, when was the last increase, and are there any pending special assessments or reserve-fund shortfalls?
- Is there a deadline driving the sale (1031 exchange, divorce, estate, relocation)? That informs how much negotiation room exists.
- Schools are A-rated — typically a magnet for longer-tenancy family renters. What's the average tenant stay here, and is there a school-zone premium baked into asking?
- The area grade is low — what's the realistic commute time and amenity access for the typical tenant pool here? Any planned neighborhood developments (good or bad) we should know about?
- What's the average days-on-market for RENTAL listings here right now (not sales)? A rising rental-DOM trend means longer vacancies and softer asking-rent achievability than the comps imply.
- What's the recent tenant-quality profile in this submarket — average credit score on applications, eviction rate, late-payment / NSF rate, and stable-employment percentage? A property-management company in the area should have these aggregated.
- How much new for-sale + rental construction is in the pipeline within 1–3 miles? Heavy new supply typically softens prices + rents 12–24 months out; constrained supply supports both.
Investment metrics
- 1% rule
- 0.86% ✗
- Cap rate
- 6.64%
- Cash-on-cash
- 1.25%
- DSCR
- 1.06
- GRM
- 9.7
CMA / ARV
- ARV (median comp)
- $190,865
- List price
- $224,900
- Delta
- 17.83%
- Verdict
- OVERPRICED
- Comps
- 19 within 1.0 mi
Show comp detail 12 sales within ~0.75 mi
| Address | Dist | Beds/Ba | Sqft | Sold | Price | $/sf | Match |
|---|---|---|---|---|---|---|---|
| 2779 SW Olds Pl | 0.29mi | 3/2.0 | 1,574 (+5%) | 2mo | $215,000 | $137 | 76 |
| 2791 SW Pontiac Pl | 0.33mi | 2/2.0 (-1) | 1,468 (-2%) | 2mo | $98,000 | $67 | 75 |
| 2764 SW Olds Pl | 0.29mi | 3/2.0 | 1,512 (+1%) | 12mo | $246,000 | $163 | 75 |
| 2709 SW Olds Pl | 0.23mi | 2/2.0 (-1) | 1,418 (-5%) | 10mo | $180,000 | $127 | 67 |
| 2800 SW Toronado Trl | 0.41mi | 2/2.0 (-1) | 1,461 (-2%) | 6mo | $222,000 | $152 | 67 |
| 2585 SW Marquis Ter | 0.11mi | 2/2.0 (-1) | 1,294 (-14%) | 2mo | $213,500 | $165 | 66 |
| 2857 SW Toronado Trl | 0.43mi | 2/2.0 (-1) | 1,460 (-2%) | 7mo | $215,000 | $147 | 65 |
| 8913 SW Chevy Cir | 0.14mi | 2/2.0 (-1) | 1,642 (+10%) | 10mo | $208,000 | $127 | 64 |
| 2889 SW Pontiac Pl | 0.40mi | 2/2.0 (-1) | 1,440 (-4%) | 18mo | $160,000 | $111 | 55 |
| 2594 SW Pontiac Pl | 0.22mi | 2/2.0 (-1) | 1,396 (-7%) | 23mo | $235,000 | $168 | 55 |
| 2833 SW Pontiac Pl | 0.35mi | 2/2.0 (-1) | 1,342 (-10%) | 11mo | $232,000 | $173 | 52 |
| 2401 SW Olds Pl | 0.13mi | 2/2.0 (-1) | 1,273 (-15%) | 15mo | $215,000 | $169 | 51 |
Match score weights: distance 35% · size 25% · config 20% · recency 20%. Top-matched comps best support the ARV.
Projected returns pro-forma
-3.0% appreciation · 2.71% rent growth · sell at horizon
- IRR
- -14.6%
- Equity multiple
- 0.48×
- Total profit
- $-32,850
- Equity at exit
- $33,533
- IRR
- -6.4%
- Equity multiple
- 0.59×
- Total profit
- $-25,629
- Equity at exit
- $19,445
Cash invested: $62,972 (down + closing). Projections, not guarantees.
Landlord ↔ Tenant lean methodology
- Overall (STATE)
- 87 Strongly Landlord-Friendly
- State Florida
- 87 Strongly Landlord-Friendly · R+3
- County
- — inherits STATE
- City
- — inherits STATE
ZIP-level market 34997
- Rents YoY
- 2.7%
- Active inventory
- 595
- Price-to-rent
- 9.7×
Monthly cashflow live
- Estimated rent
- $1,928 medium interval (Pro) →
- Mortgage (P&I)
- −$1,179
- Tax from tax record
- −$55 /mo · $661/yr
- Insurance
- −$94
- HOA
- −$129
- Lot rent leased land?
- −$0
- Vacancy / Maint / Mgmt
- −$405
- Net cashflow
- $66
Break-even live
Sensitivity live
| Price | -10% $193 | -5% $129 | +0% $66 | +5% $2 | +10% $-62 |
|---|---|---|---|---|---|
| Rent | -10% $-87 | -5% $-10 | +0% $66 | +5% $142 | +10% $218 |
| Rate | -1.0pp $179 | -0.5pp $123 | base $66 | +0.5pp $7 | +1.0pp $-52 |
UW: 25.0% down · 7.5% · 30yr · 1.5% tax · 5.0% vac · 8.0% maint · 8.0% mgmt
Financing live
Cash to close
- Down payment
- $56,225
- Closing costs
- $6,747
- Reserves months
- —
- Total cash needed
- —
Loan-product check · same deal, 3 products live
Conventional
25% down · 7.5% · 30yr
- Down + closing
- —
- Monthly P&I
- —
- Monthly cashflow
- —
- DSCR
- —
- Eligible?
- —
Personal DTI + credit; lowest rate.
DSCR
20% down · 8.5% · 30yr
- Down + closing
- —
- Monthly P&I
- —
- Monthly cashflow
- —
- DSCR
- —
- Eligible?
- —
No personal income docs; deal must DSCR.
Hard money
10% down · 12.0% · 12mo
- Down + closing
- —
- Monthly P&I
- —
- Monthly cashflow
- —
- DSCR
- —
- Eligible?
- —
Short-term bridge; refi at stabilization.
Rent comps 3 comps
| Address | Beds | Baths | Sqft | Rent | $/sqft | DOM | Units | Dist |
|---|---|---|---|---|---|---|---|---|
| 8913 SW Chevy Cir Stuart, FL | 2.0 | 2.0 | 1642 | $2,500 | $1.52 | 25d | 1 | 0.15mi |
| 9491 SW Merlin Ct Stuart, FL | 3.0 | 2.5 | 1614 | $2,300 | $1.43 | 25d | 1 | 0.61mi |
| 3171 SW Otter Ln Stuart, FL | 2.0 | 2.5 | 1627 | $2,295 | $1.41 | 25d | 1 | 0.64mi |
HOA detail
- Monthly dues
- $129 · $1,548/yr
- Likely covers
- pool
Listing history 16 events
-
2026-06-21remarks 671-char remark
-
2026-06-21statusdays on market $224,900 Active 39 DOM
-
2026-06-15statusdays on market $224,900 Pending 37 DOM
-
2026-06-14days on market $224,900 Active 36 DOM
-
2026-06-13pricedays on market $224,900 Active 35 DOM
-
2026-06-10days on market $240,000 Active 33 DOM
-
2026-06-09days on market $240,000 Active 32 DOM
-
2026-06-08days on market $240,000 Active 31 DOM
-
2026-06-07days on market $240,000 Active 30 DOM
-
2026-06-03days on market $240,000 Active 26 DOM
-
2026-06-02days on market $240,000 Active 25 DOM
-
2026-06-01days on market $240,000 Active 24 DOM
-
2026-05-31days on market $240,000 Active 23 DOM
-
2026-05-31days on market $240,000 Active 22 DOM
-
2026-05-08$240,000 Active 643-char remark
-
1995-06-12soldstatus $98,700
ⓘ Source: listings_history table (triggers on properties + properties_extension) + one-shot
backfill from property_details.listing_events for pre-trigger history.
Tax reassessment forecast FL · Resets to sale price
- Current annual tax
- $661 · $55/mo
- Projected year-2 tax
- $1,867 · $156/mo
- Expected delta
- +$1,206/yr (+$100/mo · 182.3%)
ⓘ Screening estimate from a state-policy table — verify with the county assessor before closing.
Climate risk First Street
- Flood 1/10 Low FEMA zone X (unshaded) · 0% chance over 30 yrs
- Wildfire 3/10 Moderate
- Heat 10/10 Extreme 7 d/yr ≥107°F today · 25 d/yr by 30 yrs out
- Wind 10/10 Extreme 99% chance of damaging wind over 30 yrs
- Air quality 2/10 Low 1 unhealthy d/yr today · 1 by 30 yrs out
Nearby sold comps map
Loading sold comps map…
Walkable amenities ~0.75 mi
Loading nearby amenities…
Taxation est. · year 1
- Rental income
- $23,133
- − Mortgage interest
- −$12,598
- − Property taxes
- −$661
- − Insurance
- −$1,124
- − Repairs & maintenance
- −$1,851
- − Management
- −$1,851
- − HOA
- −$1,548
- − Depreciation
- −$6,543
- Taxable loss
- −$3,043
- Est. tax savings @ 24.0%
- +$730
- After-tax cash flow
- $1,519/yr
For passive investors: Depreciation is non-cash, so a rental often shows a tax loss while cash-flowing — sheltering income. Rental losses are passive: they offset passive income freely, and up to $25,000/yr can offset ordinary (W-2) income if you actively participate and your MAGI is under $100k (phasing out to $0 by $150k); unused losses carry forward. On sale, claimed depreciation is recaptured at up to 25%, and gains may owe capital-gains tax (a 1031 exchange can defer both). Figures are a year-1 estimate at your 24.0% rate — not tax advice; consult a CPA.
Schools (NCES district)
- District
- Martin
- NCES district ID
- 1201290
- Math proficiency
- 52% ▼ -14.00%
- Reading proficiency
- 53% ▼ -4.00%
- Median HH income
- $52,482
- Composite
- 45.1/100
- National rank
- #2690
- State rank
- #24 of 73 in FL
Livability — Stuart
- Score
- 84/100
- State rank
- #39
- US rank
- #790
Category grades
Schools grade is shown separately in the Schools card above.
Census & demographics
- County
- Martin County · 165,223 people
- City population
- 65,812
- Metro
- Port St. Lucie, FL
- Population (ZIP)
- 47,075
- Household income
- $78,136
- Rent vs Own
- Severe rent burden
- 1323.0
Population outlook (Martin County) Hauer SSP2
- Today (2025)
- 172,383 people
- By 2030
- 180,192 · +4.5%
- By 2040
- 194,114 · +12.6%
- By 2050
- 204,992 · +18.9%
- By 2075
- 229,641 · +33.2%
- By 2100
- 232,146 · +34.7%
Race, ethnicity, and origin ACS 2023
- Neighborhood character
- Predominantly White (74%)
- Race & ethnicity
- White 74% Hispanic / Latino 19% Two or more races 9% Black 3% Asian 1%
- Hispanic origin (detail)
- Mexican 4% Puerto Rican 2% Cuban 3%
- Common ancestry
- Romanian 3% Lithuanian 3% Slovak 2%
- Foreign-born
- 14% · Canada, Jamaica, China
- Languages at home
- 81% English-only · Spanish 14% French/Haitian/Cajun 2% Other Indo-European 1%
Political lean MEDSL · Martin
- 2024 margin
- Solid R (+31.1) · D 34.1% · R 65.2%
- 2008→2024 swing
- -17.5pp toward R · 2008: -13.6pp · 2024: -31.1pp
- All cycles
- 2024: R+31.1 2020: R+24.6 2016: R+26.9 2012: R+22.9 2008: R+13.6
Not yet ingested
- Civics
- —
Market trends
- HPI YoY
- ▼ -319.78%
- Current HPI
- 336.7717
- Rent YoY
- ▲ 2.71%
- Metro
- Port St. Lucie, FL
- State GDP YoY
- ▲ 3.28%
- F500 in state
- 36
Industry mix (Fortune 500 HQ in FL)
| Industry | F500 HQs | Revenue |
|---|---|---|
| Industrial Technology | 2 | $29B |
|
||
| Insurance | 2 | $17B |
|
||
| Retail | 1 | $60B |
|
||
| Technology Distribution | 1 | $58B |
|
||
| Homebuilding | 1 | $35B |
|
||
| Technology Manufacturing | 1 | $35B |
|
||
Price history
+127.9% since first listed4 events — show timeline
- 2026-06-14 Pending — MCRTC
- 2026-06-10 Price Changed $224,900 MCRTC
- 2026-05-08 Listed $240,000 MCRTC
- 1995-06-12 Sold (Public Records) $98,700 Public Records
Property tax history
-1.0%/yrLatest (2025): $661 · -29.2% YoY. Source: county tax records.
Cash-flow waterfall
monthlySold comps — $/sqft
last 12 mo · ≤1 miLoading sold comps…