2187 White Ave · Indianapolis city (balance), IN
Flood risk 1/10 · Minimal
- FEMA flood zone
- X (unshaded)
- Chance of flooding over 30 yrs
- 0.0%
- Est. flood insurance / yr
- $507 – $1,088
Fire risk 1/10 · Minimal
- Est. fire insurance / yr
- $717 – $1,331
Heat risk 4/10 · Minor
- Hot days now (above 102°F)
- 7 days/yr
- Hot days in 30 yrs
- 19 days/yr
Wind risk 2/10 · Minimal
- Chance of severe wind over 30 yrs
- 0.0%
Air-quality risk 4/10 · Minor
- Unhealthy air days now
- 5 days/yr
- Unhealthy air days in 30 yrs
- 7 days/yr
Risk factors via First Street. Map © Google.
Why this score? — see what drove the B- grade
The composite is a weighted blend of 9 inputs, each scored 0–100. Each bar is that input's sub-score; the figure is the points it added to the 100-point composite (weight × sub-score).
- Cash flow +30.0/30.0
- 1% rule +10.0/10.0
- DSCR +10.0/10.0
- ARV discount +7.5/15.0
- Livability +2.5/5.0
- Condition / age +2.5/5.0
- Rent growth +2.4/5.0
- Schools +1.4/10.0
- Appreciation +0.0/10.0
$55,000
🖨 Deal sheet (PDF) 📄 Offer letter ✓ Due diligence
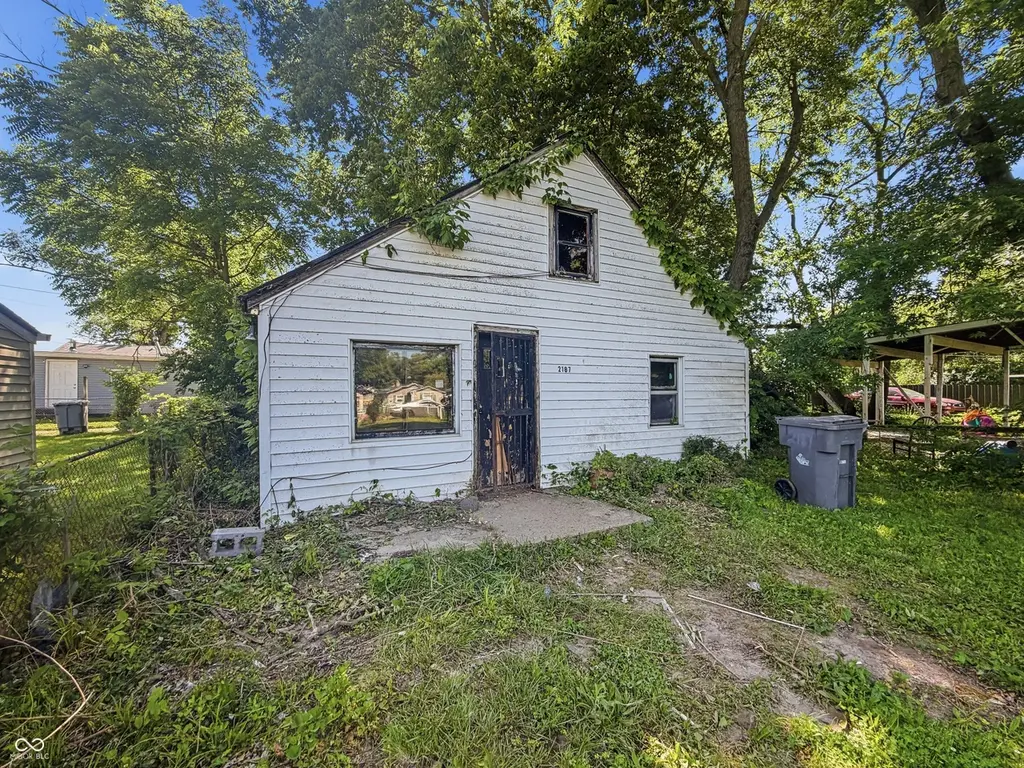
Listing remarks
Packed with potential, this charming bungalow offers 3 bedrooms, 1 full bath, and 1,127 sq ft of living space. The flexible floor plan features one bedroom on the main level and two additional bedrooms upstairs. A former garage has been converted into a workspace, providing extra room for hobbies, storage, or future customization. With its vinyl and wood exterior, classic character, and opportunity for updates, this property is perfect for investors, DIY enthusiasts, or buyers looking to build equity. Bring your vision and make this home your own!
Key facts
- Flexible floor plan
- Classic character
- Converted workspace
Tags
Property features AI
Exterior
- Parking: Attached garage (approximately 378 sq ft)
- Utilities: Public water; Municipal sewer connected; Municipal solid waste service
- Home design: Single-family residence; One-and-a-half stories
- Construction: Vinyl siding and wood siding; Slab foundation
- Exterior features: Lot is approximately 0.11 acres (less than 1/4 acre)
Interior
- Kitchen: Refrigerator
- Bedrooms: Three bedrooms total — one on the main level and two on the upper level
- Flooring: Hardwood floors
- Bathrooms: One full bathroom
- Heating & cooling: Forced air heating (natural gas); Central air conditioning
- Interior features: Hardwood floors; Stained or painted woodwork
- Laundry & utility: Main level utility room
Neighborhood map
What this means for you Summary
Snapshot
- This is a 2-bed/1.0-bath single-family listed at $55k.
Deal economics
- At list price, monthly cash flow is $618 ($7k/yr) — positive.
- The deal already cash-flows at list — no discount required.
- Meets the 1% rule at list price ($1k rent vs $55k).
- Recommended offer: $54k (1.5% below list) — sets the bar for market timing.
- Cap rate 19.8% vs local median 4.4% in Indianapolis city (balance) — top-decile yield for the area; either an underpriced asset or a hidden risk that comps aren't pricing in. Stress-test before assuming the spread holds.
Location & tenants
- Location reads: area grade B — affects rentability + tenant quality, not the cash-flow math above.
- Indianapolis Public Schools (urban): math 14% / reading 20% proficiency, ranked #286 of 301 in IN (top 95%) — low school quality limits family demand, transient renter base, plan for 1-2y turnover; 77% free/reduced lunch — lower-income household profile, screen leases tightly.
- Market conditions: Rents soft (-0.4%/yr); 266 active listings in the ZIP; 40 comparable units currently listed for rent nearby; rentals at typical pace (median 25d on market — plan ~3-4 weeks tenant-placement turnaround); 1,906 units permitted in Marion County in 2024 (621 in 5+ unit buildings).
Forward outlook
- Local home prices are declining (-3.0%/yr); year-one equity from $380 of loan paydown is wiped out by about $2k of value loss. Plan a longer hold.
- Marion County population projected at +18% by 2050 — long-run rental-demand tailwind backs the buy-and-hold thesis.
- At projected returns (-3.0% appreciation + 0.0% rent growth), your $15k cash investment doubles in ~3 years — after that, you're playing with house money.
Negotiation context
- It's been on market 16 days — a 2% lower offer ($54k) is reasonable based on typical stale-listing flexibility.
Risks & watch-outs
- Watch-outs: property tax is 2.6% of price; built in 1955 — expect roof / HVAC / electrical / plumbing capex.
Questions for the listing agent
- Built in 1955 — when were the roof, HVAC, electrical panel, plumbing, and water heater last replaced?
- Property tax is high relative to price — has the assessment been appealed recently, and will the sale trigger a re-assessment?
- Is there a deadline driving the sale (1031 exchange, divorce, estate, relocation)? That informs how much negotiation room exists.
- What's the average days-on-market for RENTAL listings here right now (not sales)? A rising rental-DOM trend means longer vacancies and softer asking-rent achievability than the comps imply.
- What's the recent tenant-quality profile in this submarket — average credit score on applications, eviction rate, late-payment / NSF rate, and stable-employment percentage? A property-management company in the area should have these aggregated.
- How much new for-sale + rental construction is in the pipeline within 1–3 miles? Heavy new supply typically softens prices + rents 12–24 months out; constrained supply supports both.
Investment metrics
- 1% rule
- 2.41% ✓
- Cap rate
- 19.79%
- Cash-on-cash
- 48.19%
- DSCR
- 3.14
- GRM
- 3.5
CMA / ARV
- ARV (on-the-fly)
- $155,526
- Comps found
- 12
Show comp detail 12 sales within ~0.75 mi
| Address | Dist | Beds/Ba | Sqft | Sold | Price | $/sf | Match |
|---|---|---|---|---|---|---|---|
| 1330 W Pruitt St | 0.15mi | 3/1.0 (+1) | 1,088 (-4%) | 8mo | $150,000 | $138 | 76 |
| 1206 W 25th St | 0.36mi | 3/1.0 (+1) | 1,152 (+2%) | 7mo | $72,750 | $63 | 68 |
| 1303 W 25th St | 0.35mi | 3/2.0 (+1) | 1,156 (+3%) | 2mo | $211,000 | $183 | 68 |
| 1835 Koehne St | 0.46mi | 2/1.0 | 1,066 (-5%) | 2mo | $130,000 | $122 | 68 |
| 2041 N Dexter St | 0.21mi | 3/2.0 (+1) | 1,050 (-7%) | 10mo | $227,500 | $217 | 61 |
| 1309 W 26th St | 0.41mi | 3/2.0 (+1) | 1,050 (-7%) | 1mo | $210,000 | $200 | 60 |
| 727 W 25th St | 0.73mi | 2/1.0 | 1,130 (+0%) | 9mo | $25,500 | $23 | 58 |
| 953 W 25th St | 0.48mi | 3/2.0 (+1) | 1,180 (+5%) | 4mo | $160,000 | $136 | 57 |
| 837 W 25th St | 0.59mi | 3/1.0 (+1) | 1,080 (-4%) | 4mo | $160,000 | $148 | 57 |
| 1153 W 29th St | 0.72mi | 2/1.0 | 1,093 (-3%) | 11mo | $138,000 | $126 | 52 |
| 1341 W 26th St | 0.43mi | 3/1.5 (+1) | 1,236 (+10%) | 10mo | $210,500 | $170 | 49 |
| 811 W 25th St | 0.62mi | 3/2.0 (+1) | 1,292 (+15%) | 9mo | $56,000 | $43 | 30 |
Match score weights: distance 35% · size 25% · config 20% · recency 20%. Top-matched comps best support the ARV.
Projected returns pro-forma
-3.0% appreciation · 0.0% rent growth · sell at horizon
- IRR
- 42.1%
- Equity multiple
- 2.73×
- Total profit
- $26,634
- Equity at exit
- $8,201
- IRR
- 46.8%
- Equity multiple
- 4.84×
- Total profit
- $59,077
- Equity at exit
- $4,755
Cash invested: $15,400 (down + closing). Projections, not guarantees.
Landlord ↔ Tenant lean methodology
- Overall (STATE)
- 90 Strongly Landlord-Friendly
- State Indiana
- 90 Strongly Landlord-Friendly · R+11
- County
- — inherits STATE
- City
- — inherits STATE
ZIP-level market 46202
- Home prices YoY
- -26.2%
- Rents YoY
- -0.4%
- Active inventory
- 266
- Price-to-rent
- 3.5×
Monthly cashflow live
- Estimated rent
- $1,328 high interval (Pro) →
- Mortgage (P&I)
- −$288
- Tax from tax record
- −$119 /mo · $1,433/yr
- Insurance
- −$23
- HOA
- −$0
- Vacancy / Maint / Mgmt
- −$279
- Net cashflow
- $618
Break-even live
Sensitivity live
| Price | -10% $650 | -5% $634 | +0% $618 | +5% $603 | +10% $587 |
|---|---|---|---|---|---|
| Rent | -10% $514 | -5% $566 | +0% $618 | +5% $671 | +10% $723 |
| Rate | -1.0pp $646 | -0.5pp $632 | base $618 | +0.5pp $604 | +1.0pp $590 |
UW: 25.0% down · 7.5% · 30yr · 1.5% tax · 5.0% vac · 8.0% maint · 8.0% mgmt
Financing live
Cash to close
- Down payment
- $13,750
- Closing costs
- $1,650
- Reserves months
- —
- Total cash needed
- —
Loan-product check · same deal, 3 products live
Conventional
25% down · 7.5% · 30yr
- Down + closing
- —
- Monthly P&I
- —
- Monthly cashflow
- —
- DSCR
- —
- Eligible?
- —
Personal DTI + credit; lowest rate.
DSCR
20% down · 8.5% · 30yr
- Down + closing
- —
- Monthly P&I
- —
- Monthly cashflow
- —
- DSCR
- —
- Eligible?
- —
No personal income docs; deal must DSCR.
Hard money
10% down · 12.0% · 12mo
- Down + closing
- —
- Monthly P&I
- —
- Monthly cashflow
- —
- DSCR
- —
- Eligible?
- —
Short-term bridge; refi at stabilization.
Rent comps 40 comps
| Address | Beds | Baths | Sqft | Rent | $/sqft | DOM | Units | Dist |
|---|---|---|---|---|---|---|---|---|
| 1135 W 21st St Indianapolis, IN | 3.0 | 2.0 | 1296 | $1,495 | $1.15 | 24d | 1 | 0.19mi |
| 1133 W 21st St Indianapolis, IN | 3.0 | 2.0 | 1296 | $1,495 | $1.15 | 24d | 1 | 0.19mi |
| 1367 W Pruitt St Indianapolis, IN | 3.0 | 1.0 | 1088 | $1,450 | $1.33 | 44d | 1 | 0.21mi |
| 2248 N Harding St Indianapolis, IN | 2.0 | 1.0 | 1100 | $899 | $0.82 | 24d | 1 | 0.26mi |
| 1415 W Pruitt St Indianapolis, IN | 3.0 | 1.0 | 1001 | $1,249 | $1.25 | 24d | 1 | 0.28mi |
| 1244 Edgemont Ave Indianapolis, IN | 2.0 | 1.0 | 1092 | $1,275 | $1.17 | 44d | 1 | 0.29mi |
| 1920 Sugar Grove Ave Indianapolis, IN | 3.0 | 1.5 | 1378 | $1,175 | $0.85 | 4d | 1 | 0.32mi |
| 1214 W 25th St Indianapolis, IN | 1.0 | 1.0 | 800 | $775 | $0.97 | 24d | 1 | 0.34mi |
| 970 Edgemont Ave Indianapolis, IN | 2.0 | 1.0 | 740 | $845 | $1.14 | 5d | 1 | 0.40mi |
| 906 Burdsal Pkwy Indianapolis, IN | 2.0 | 1.0 | 936 | $1,295 | $1.38 | 24d | 1 | 0.44mi |
| 908 Burdsal Pkwy Marion, IN | 2.0 | 1.0 | 936 | $1,300 | $1.39 | 24d | 1 | 0.44mi |
| 1228 W 18th St Indianapolis, IN | 2.0 | 1.0 | 1050 | $1,200 | $1.14 | 44d | 1 | 0.46mi |
| 1519 W 28th St Indianapolis, IN | 2.0 | 1.0 | 816 | $895 | $1.10 | 44d | 1 | 0.68mi |
| 1227 W 29th St Indianapolis, IN | 3.0 | 1.5 | 1056 | $1,250 | $1.18 | 24d | 1 | 0.70mi |
| 1449 Montcalm St Indianapolis, IN | 3.0 | 1.0 | 1300 | $1,900 | $1.46 | 44d | 1 | 0.73mi |
| 2235 Doctor Martin Luther King Junior St Indianapolis, IN | 3.0 | 1.5 | 948 | $1,700 | $1.79 | 44d | 1 | 0.74mi |
| 1410 Breedlove Ln Indianapolis, IN | 2.0 | 1.0–2.0 | 886 | $2,557 | $2.88 | 2d | 63 | 0.82mi |
| 824 W 29th St Indianapolis, IN | 3.0 | 2.0 | 1200 | $1,595 | $1.33 | 44d | 1 | 0.85mi |
| 826 W 29th St Indianapolis, IN | 3.0 | 2.0 | 1200 | $1,595 | $1.33 | 44d | 1 | 0.86mi |
| 1201 Indiana Ave Indianapolis, IN | 1.0–3.0 | 1.0–3.5 | 967 | $1,770 | $1.83 | 2d | 36 | 0.91mi |
| 1054 W 31st St Unit A Indianapolis, IN | 2.0 | 1.0 | 1200 | $1,500 | $1.25 | 44d | 1 | 0.93mi |
| 560 Udell St Indianapolis, IN | 3.0 | 1.5 | 1176 | $1,190 | $1.01 | 24d | 1 | 0.95mi |
| 516 W 28th St Indianapolis, IN | 2.0 | 1.0 | 1005 | $1,100 | $1.09 | 24d | 1 | 0.97mi |
| 541 W 29th St Indianapolis, IN | 1.0 | 1.0 | 740 | $900 | $1.22 | 21d | 1 | 1.00mi |
| 538 W 29th St Indianapolis, IN | 3.0 | 1.0 | 1132 | $1,349 | $1.19 | 24d | 1 | 1.02mi |
| 648 W 30th St Indianapolis, IN | 3.0 | 2.0 | 1300 | $1,500 | $1.15 | 24d | 1 | 1.03mi |
| 1441 W Lynn Dr Indianapolis, IN | 3.0 | 2.0 | 967 | $1,550 | $1.60 | 44d | 1 | 1.03mi |
| 1261 W 32nd St Indianapolis, IN | 2.0 | 1.0 | 832 | $975 | $1.17 | 44d | 1 | 1.03mi |
| 2106 Cold Spring Rd Indianapolis, IN | 2.0 | 1.0–1.5 | 940 | $1,189 | $1.26 | 4d | 4 | 1.11mi |
| 926 W 32nd St Indianapolis, IN | 3.0 | 2.0 | 1050 | $1,295 | $1.23 | 8d | 1 | 1.11mi |
| 1470 W 32nd St Indianapolis, IN | 2.0 | 1.0 | 700 | $1,000 | $1.43 | 44d | 1 | 1.11mi |
| 3217 Rader St Indianapolis, IN | 3.0 | 1.0 | 1200 | $1,299 | $1.08 | 44d | 1 | 1.12mi |
| 1150 N White River Pkwy West Dr Indianapolis, IN | 1.0–2.0 | 1.0 | 722 | $1,224 | $1.69 | 3d | 9 | 1.13mi |
| 2318 N Capitol Ave Indianapolis, IN | 3.0 | 1.0 | 1440 | $1,050 | $0.73 | 44d | 1 | 1.14mi |
| 1401 Doctor Martin Luther King Junior St Indianapolis, IN | 1.0–2.0 | 1.0 | 982 | $1,875 | $1.91 | 15d | 1 | 1.15mi |
| 3017 Ethel Ave Indianapolis, IN | 3.0 | 1.5 | 1079 | $1,400 | $1.30 | 24d | 1 | 1.16mi |
| 2602 Mansion Dr Indianapolis, IN | 2.0–3.0 | 2.0 | 1850 | $1,379 | $0.75 | 8d | 6 | 1.17mi |
| 1411 N Pershing Ave Indianapolis, IN | 1.0 | 1.0 | 700 | $850 | $1.21 | 44d | 1 | 1.18mi |
| 930 W 10th St Indianapolis, IN | 1.0–4.0 | 1.0–4.0 | 874 | $2,371 | $2.71 | 5d | 1 | 1.19mi |
| 1226 Doctor Martin Luther King Junior St Indianapolis, IN | 1.0–3.0 | 1.0–3.5 | 1067 | $1,828 | $1.71 | 2d | 10 | 1.22mi |
Listing history 11 events
-
2026-06-21days on market $55,000 Active 16 DOM
-
2026-06-18days on market $55,000 Active 13 DOM
-
2026-06-17days on market $55,000 Active 12 DOM
-
2026-06-16days on market $55,000 Active 11 DOM
-
2026-06-15days on market $55,000 Active 10 DOM
-
2026-06-13days on market $55,000 Active 8 DOM
-
2026-06-13days on market $55,000 Active 7 DOM
-
2026-06-09days on market $55,000 Active 4 DOM
-
2026-06-08days on market $55,000 Active 3 DOM
-
2026-06-07remarks 553-char remark
-
2026-06-07$55,000 Active 2 DOM
ⓘ Source: listings_history table (triggers on properties + properties_extension) + one-shot
backfill from property_details.listing_events for pre-trigger history.
Tax reassessment forecast IN · Partial reset (capped growth)
- Current annual tax
- $1,433 · $119/mo
- Projected year-2 tax
- $1,433 · $119/mo
- Expected delta
- $0/yr ($0/mo · 0.0%)
ⓘ Screening estimate from a state-policy table — verify with the county assessor before closing.
Climate risk First Street
- Flood 1/10 Low FEMA zone X (unshaded) · 0% chance over 30 yrs
- Wildfire 1/10 Low
- Heat 4/10 Moderate 7 d/yr ≥102°F today · 19 d/yr by 30 yrs out
- Wind 2/10 Low 0% chance of damaging wind over 30 yrs
- Air quality 4/10 Moderate 5 unhealthy d/yr today · 7 by 30 yrs out
Nearby sold comps map
Loading sold comps map…
Walkable amenities ~0.75 mi
Loading nearby amenities…
Taxation est. · year 1
- Rental income
- $15,936
- − Mortgage interest
- −$3,081
- − Property taxes
- −$1,433
- − Insurance
- −$275
- − Repairs & maintenance
- −$1,275
- − Management
- −$1,275
- − Depreciation
- −$1,600
- Taxable income
- $6,998
- Est. tax owed @ 24.0%
- −$1,680
- After-tax cash flow
- $5,741/yr
For passive investors: Depreciation is non-cash, so a rental often shows a tax loss while cash-flowing — sheltering income. Rental losses are passive: they offset passive income freely, and up to $25,000/yr can offset ordinary (W-2) income if you actively participate and your MAGI is under $100k (phasing out to $0 by $150k); unused losses carry forward. On sale, claimed depreciation is recaptured at up to 25%, and gains may owe capital-gains tax (a 1031 exchange can defer both). Figures are a year-1 estimate at your 24.0% rate — not tax advice; consult a CPA.
Schools (NCES district)
- District
- Indianapolis Public Schools
- NCES district ID
- 1804770
- Math proficiency
- 14% ▼ -7.00%
- Reading proficiency
- 20% ▼ -3.00%
- Median HH income
- $32,034
- Composite
- 13.69/100
- National rank
- #9499
- State rank
- #286 of 301 in IN
Livability — Indianapolis city (balance)
No livability data for this city. (Only ~50 U.S. cities are tracked.)
Census & demographics
- Census place
- Indianapolis city (balance), IN
- County
- Marion County · 998,460 people
- City population
- 881,119
- Metro
- Indianapolis-Carmel-Anderson, IN
- Population (ZIP)
- 20,180
- Household income
- $63,506
- Rent vs Own
- Severe rent burden
- 1829.0
Population outlook (Marion County) Hauer SSP2
- Today (2025)
- 1,025,572 people
- By 2030
- 1,065,727 · +3.9%
- By 2040
- 1,141,577 · +11.3%
- By 2050
- 1,208,920 · +17.9%
- By 2075
- 1,367,288 · +33.3%
- By 2100
- 1,438,201 · +40.2%
Race, ethnicity, and origin ACS 2023
- Neighborhood character
- Diverse neighborhood (Simpson 0.57)
- Race & ethnicity
- White 62% Black 20% Hispanic / Latino 8% Asian 6% Two or more races 5%
- Hispanic origin (detail)
- Mexican 5%
- Common ancestry
- Italian 4% Romanian 3% Slovak 3%
- Foreign-born
- 11% · Canada, China
- Languages at home
- 86% English-only · Spanish 6% Other Indo-European 3% Arabic 1%
Political lean MEDSL · Marion
- 2024 margin
- Strong D (+27.7) · D 63.0% · R 35.3% · Other 1.7%
- 2008→2024 swing
- -0.7pp no change · 2008: 28.4pp · 2024: 27.7pp
- All cycles
- 2024: D+27.7 2020: D+29.1 2016: D+22.8 2012: D+22.2 2008: D+28.4
Not yet ingested
- Civics
- —
Market trends
- HPI YoY
- ▼ -136.75%
- Current HPI
- 385.5518
- Rent YoY
- ▼ -0.37%
- Metro
- Indianapolis-Carmel-Anderson, IN
- State GDP YoY
- ▲ 2.90%
- F500 in state
- 18
Industry mix (Fortune 500 HQ in IN)
| Industry | F500 HQs | Revenue |
|---|---|---|
| Industrial Machinery | 2 | $37B |
|
||
| Healthcare | 1 | $177B |
|
||
| Pharmaceuticals | 1 | $45B |
|
||
| Metals / Steel | 1 | $18B |
|
||
| Agriculture | 1 | $17B |
|
||
| Packaging | 1 | $12B |
|
||
Price history
1 event — show timeline
- 2026-06-05 Listed $55,000 MIBOR as Distributed by MLS Grid
Property tax history
+6.8%/yrLatest (2025): $1,433 · +10.0% YoY. Source: county tax records.
Cash-flow waterfall
monthlySold comps — $/sqft
last 12 mo · ≤1 miLoading sold comps…