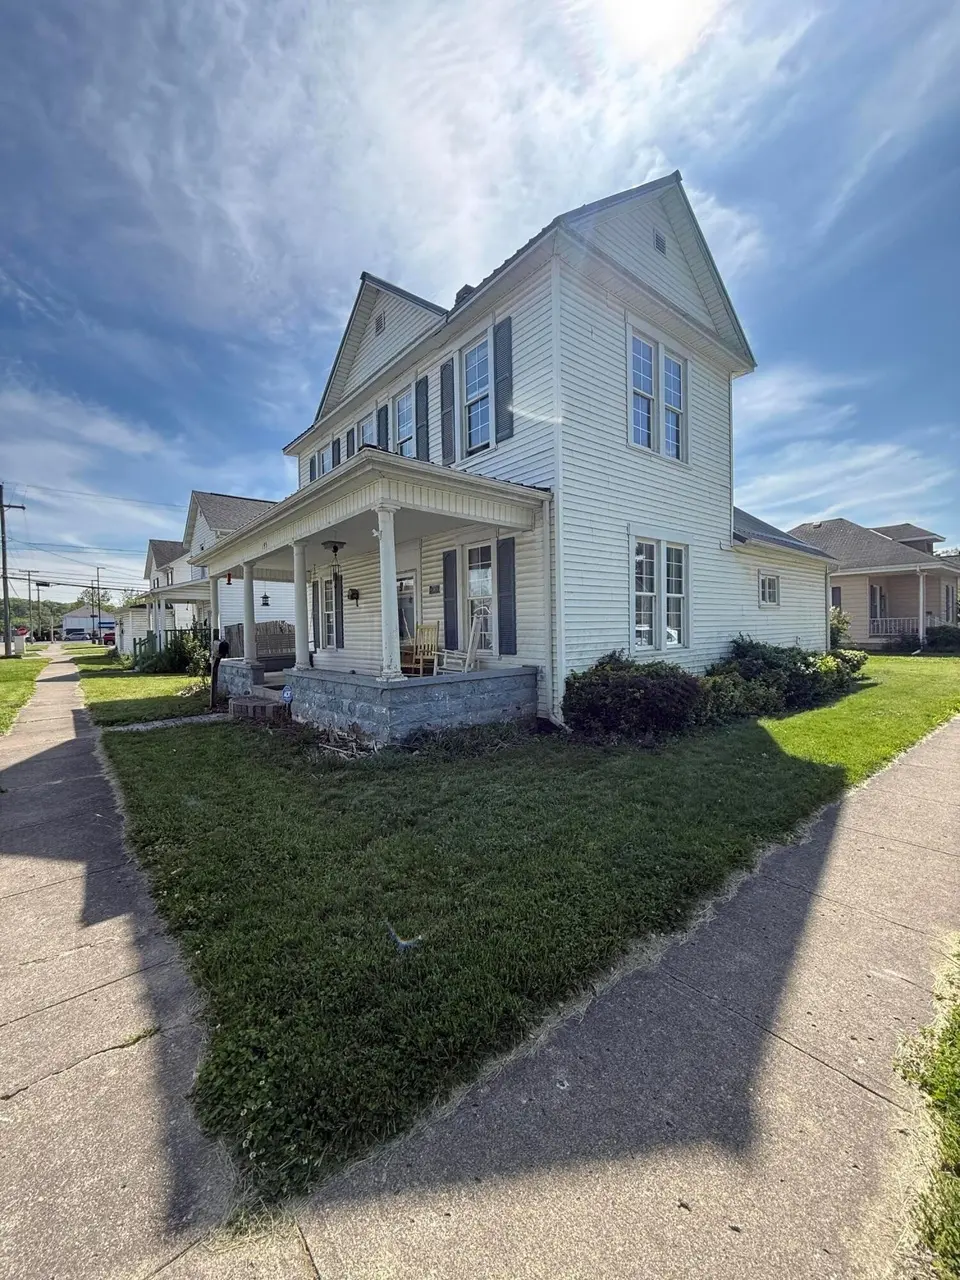
195 Furnace St · Logan, OH
Flood risk 1/10 · Minimal
- FEMA flood zone
- X (unshaded)
- Chance of flooding over 30 yrs
- 0.0%
- Est. flood insurance / yr
- $507 – $1,088
Fire risk 3/10 · Minor
- Est. fire insurance / yr
- $713 – $1,323
Heat risk 4/10 · Minor
- Hot days now (above 99°F)
- 7 days/yr
- Hot days in 30 yrs
- 19 days/yr
Wind risk 2/10 · Minimal
- Chance of severe wind over 30 yrs
- 1.0%
Air-quality risk 2/10 · Minimal
- Unhealthy air days now
- 1 days/yr
- Unhealthy air days in 30 yrs
- 2 days/yr
Risk factors via First Street. Map © Google.
Why this score? — see what drove the C grade
The composite is a weighted blend of 9 inputs, each scored 0–100. Each bar is that input's sub-score; the figure is the points it added to the 100-point composite (weight × sub-score).
- Cash flow +20.2/30.0
- ARV discount +12.3/15.0
- DSCR +6.4/10.0
- 1% rule +5.3/10.0
- Schools +4.7/10.0
- Livability +3.9/5.0
- Rent growth +2.5/5.0
- Condition / age +2.5/5.0
- Appreciation +0.0/10.0
$158,000
🖨 Deal sheet 📄 Offer letter ✓ Due diligence
Listing remarks MLS
Charming 2-story home located in Logan offering 3 bedrooms and 2 full baths, full of character and ready for your personal touch. Situated on a spacious corner lot, this property features a large covered front porch, original woodwork, and hardwood floors throughout much of the home. The main level offers multiple living spaces including a front living room and an additional family room, along with a dining area and a generously sized kitchen with ample cabinet space. Upstairs you'll find three bedrooms and additional space with potential for customization. This home is being sold as-is and will require repairs and updates, making it a great opportunity for investors, flippers, or buyers. Conveniently located in a quiet neighborhood close to local amenities. Bring your vision and make this property your own!
Key facts
- Original woodwork
- Quiet neighborhood
- Hardwood floors
Tags
Neighborhood map
What this means for you Summary
Snapshot
- This is a 3-bed/1.0-bath single-family listed at $158k.
Deal economics
- At list price, monthly cash flow is $201 ($2k/yr) — positive.
- The deal already cash-flows at list — no discount required.
- Meets the 1% rule at list price ($2k rent vs $158k).
- Recommended offer: $153k (3.0% below list) — sets the bar for market timing.
- Cap rate 7.8% vs local median 2.4% in Logan — top-decile yield for the area; either an underpriced asset or a hidden risk that comps aren't pricing in. Stress-test before assuming the spread holds.
Location & tenants
- Location reads 78/100 on livability (#162 in OH, #2,412 nationally) — a middle-class / working-renter tenant base. Strengths: amenities A+, cost of living A+, housing A+; Watch: commute F, employment F.
- Logan-Hocking Local (rural): math 55% / reading 58% proficiency, ranked #354 of 656 in OH (top 54%) — acceptable for families but not a draw, mixed tenant base, ~2y average lease.
- Market conditions: 163 active listings in the ZIP; 11 units permitted in Hocking County in 2024 (0 in 5+ unit buildings).
- This rent runs 30% of the median local income ($65k/yr) — at the standard rent-burdened threshold; future hikes will face affordability resistance.
Forward outlook
- Local home prices are declining (-3.0%/yr); year-one equity from $1k of loan paydown is wiped out by about $5k of value loss. Plan a longer hold.
- Hocking County population projected at -22% by 2050 — secular population decline; favor cash flow + early exit over multi-decade hold.
Negotiation context
- It's been on market 60 days — a 3% lower offer ($153k) is reasonable based on typical stale-listing flexibility.
- 2 sale attempts since 5y ago; this cycle's ask has dropped $16k (9%) from the opening price — seller is motivated, your offer sets the floor, not the list.
Risks & watch-outs
- Watch-outs: built in 1907 — expect roof / HVAC / electrical / plumbing capex.
Questions for the listing agent
- It's been on market 60 days. Have you received any prior offers? Is the seller open to a 3% concession, seller financing, or rate buy-down credit?
- Built in 1907 — when were the roof, HVAC, electrical panel, plumbing, and water heater last replaced?
- Is there a deadline driving the sale (1031 exchange, divorce, estate, relocation)? That informs how much negotiation room exists.
- Schools are A-rated — typically a magnet for longer-tenancy family renters. What's the average tenant stay here, and is there a school-zone premium baked into asking?
- What's the average days-on-market for RENTAL listings here right now (not sales)? A rising rental-DOM trend means longer vacancies and softer asking-rent achievability than the comps imply.
- What's the recent tenant-quality profile in this submarket — average credit score on applications, eviction rate, late-payment / NSF rate, and stable-employment percentage? A property-management company in the area should have these aggregated.
- How much new for-sale + rental construction is in the pipeline within 1–3 miles? Heavy new supply typically softens prices + rents 12–24 months out; constrained supply supports both.
Investment metrics
- 1% rule
- 1.03% ✓
- Cap rate
- 7.82%
- Cash-on-cash
- 5.45%
- DSCR
- 1.24
- GRM
- 8.1
CMA / ARV
- ARV (median comp)
- $176,925
- List price
- $158,000
- Delta
- -10.70%
- Verdict
- UNDERPRICED
- Comps
- 20 within 1.0 mi
Show comp detail 12 sales within ~0.75 mi
| Address | Dist | Beds/Ba | Sqft | Sold | Price | $/sf | Match |
|---|---|---|---|---|---|---|---|
| 150 Wood St | 0.09mi | 3/2.0 | 1,680 (-1%) | 6mo | $179,900 | $107 | 85 |
| 507 W 2nd St | 0.17mi | 2/2.0 (-1) | 1,668 (-2%) | 0mo | $189,000 | $113 | 79 |
| 394 Church St | 0.17mi | 3/2.0 | 1,558 (-8%) | 3mo | $220,000 | $141 | 72 |
| 180 North St | 0.31mi | 3/1.5 | 1,780 (+5%) | 8mo | $188,500 | $106 | 70 |
| 447 Church St | 0.11mi | 3/1.5 | 1,560 (-8%) | 12mo | $170,000 | $109 | 69 |
| 597 Warner Ave | 0.26mi | 3/2.5 | 1,845 (+8%) | 1mo | $290,000 | $157 | 67 |
| 235 W Main St | 0.28mi | 3/1.5 | 1,496 (-12%) | 2mo | $89,000 | $59 | 63 |
| 1150 3rd St | 0.40mi | 3/2.0 | 1,836 (+8%) | 8mo | $98,500 | $54 | 57 |
| 250 Midland Pl | 0.53mi | 3/1.5 | 1,800 (+6%) | 9mo | $235,000 | $131 | 56 |
| 1177 Homer St | 0.57mi | 3/2.0 | 1,620 (-5%) | 7mo | $177,500 | $110 | 56 |
| 578 N Market St | 0.52mi | 3/1.0 | 1,456 (-14%) | 7mo | $240,000 | $165 | 46 |
| 298 Midland Pl | 0.53mi | 3/1.5 | 1,501 (-12%) | 12mo | $205,000 | $137 | 43 |
Match score weights: distance 35% · size 25% · config 20% · recency 20%. Top-matched comps best support the ARV.
Projected returns pro-forma
-3.0% appreciation · 3.0% rent growth · sell at horizon
- IRR
- -7.8%
- Equity multiple
- 0.71×
- Total profit
- $-12,781
- Equity at exit
- $23,558
- IRR
- 1.7%
- Equity multiple
- 1.12×
- Total profit
- $5,444
- Equity at exit
- $13,661
Cash invested: $44,240 (down + closing). Projections, not guarantees.
Landlord ↔ Tenant lean methodology
- Overall (STATE)
- 73 Landlord-Friendly
- State Ohio
- 73 Landlord-Friendly · R+6
- County
- — inherits STATE
- City
- — inherits STATE
ZIP-level market 43138
- Home prices YoY
- -29.9%
- Active inventory
- 163
- Price-to-rent
- 8.1×
Monthly cashflow live
- Estimated rent
- $1,632 medium interval (Pro) →
- Mortgage (P&I)
- −$829
- Tax from tax record
- −$194 /mo · $2,331/yr
- Insurance
- −$66
- HOA
- −$0
- Vacancy / Maint / Mgmt
- −$343
- Net cashflow
- $201
Break-even live
UW: 25.0% down · 7.5% · 30yr · 1.5% tax · 5.0% vac · 8.0% maint · 8.0% mgmt
Financing live
Cash to close
- Down payment
- $39,500
- Closing costs
- $4,740
- Reserves months
- —
- Total cash needed
- —
Loan-product check · same deal, 3 products live
Conventional
25% down · 7.5% · 30yr
- Down + closing
- —
- Monthly P&I
- —
- Monthly cashflow
- —
- DSCR
- —
- Eligible?
- —
Personal DTI + credit; lowest rate.
DSCR
20% down · 8.5% · 30yr
- Down + closing
- —
- Monthly P&I
- —
- Monthly cashflow
- —
- DSCR
- —
- Eligible?
- —
No personal income docs; deal must DSCR.
Hard money
10% down · 12.0% · 12mo
- Down + closing
- —
- Monthly P&I
- —
- Monthly cashflow
- —
- DSCR
- —
- Eligible?
- —
Short-term bridge; refi at stabilization.
Listing history 19 events
-
2026-06-18days on market $158,000 Active 60 DOM
-
2026-06-18price $158,000 Active 59 DOM
-
2026-06-17days on market $168,000 Active 59 DOM
-
2026-06-16days on market $168,000 Active 58 DOM
-
2026-06-15days on market $168,000 Active 57 DOM
-
2026-06-13days on market $168,000 Active 55 DOM
-
2026-06-13days on market $168,000 Active 54 DOM
-
2026-06-09days on market $168,000 Active 51 DOM
-
2026-06-08days on market $168,000 Active 50 DOM
-
2026-06-07days on market $168,000 Active 49 DOM
-
2026-06-05pricedays on market $168,000 Active 46 DOM
-
2026-06-03days on market $169,000 Active 45 DOM
-
2026-06-02days on market $169,000 Active 44 DOM
-
2026-06-01days on market $169,000 Active 43 DOM
-
2026-05-31days on market $169,000 Active 42 DOM
-
2026-04-21price $169,000 819-char remark
Show marketing remark (819 chars)
Charming 2-story home located in Logan offering 3 bedrooms and 2 full baths, full of character and ready for your personal touch. Situated on a spacious corner lot, this property features a large covered front porch, original woodwork, and hardwood floors throughout much of the home. The main level offers multiple living spaces including a front living room and an additional family room, along with a dining area and a generously sized kitchen with ample cabinet space. Upstairs you'll find three bedrooms and additional space with potential for customization. This home is being sold as-is and will require repairs and updates, making it a great opportunity for investors, flippers, or buyers. Conveniently located in a quiet neighborhood close to local amenities. Bring your vision and make this property your own!
-
2026-04-19$174,000 Active 819-char remark
Show marketing remark (819 chars)
Charming 2-story home located in Logan offering 3 bedrooms and 2 full baths, full of character and ready for your personal touch. Situated on a spacious corner lot, this property features a large covered front porch, original woodwork, and hardwood floors throughout much of the home. The main level offers multiple living spaces including a front living room and an additional family room, along with a dining area and a generously sized kitchen with ample cabinet space. Upstairs you'll find three bedrooms and additional space with potential for customization. This home is being sold as-is and will require repairs and updates, making it a great opportunity for investors, flippers, or buyers. Conveniently located in a quiet neighborhood close to local amenities. Bring your vision and make this property your own!
-
2021-06-17soldstatus $140,000
-
2021-06-17$140,000
ⓘ Source: listings_history table (triggers on properties + properties_extension) + one-shot
backfill from property_details.listing_events for pre-trigger history.
Tax reassessment forecast OH · Partial reset (capped growth)
- Current annual tax
- $2,331 · $194/mo
- Projected year-2 tax
- $2,398 · $200/mo
- Expected delta
- +$67/yr (+$6/mo · 2.9%)
ⓘ Screening estimate from a state-policy table — verify with the county assessor before closing.
Climate risk First Street
- Flood 1/10 Low FEMA zone X (unshaded) · 0% chance over 30 yrs
- Wildfire 3/10 Moderate
- Heat 4/10 Moderate 7 d/yr ≥99°F today · 19 d/yr by 30 yrs out
- Wind 2/10 Low 100% chance of damaging wind over 30 yrs
- Air quality 2/10 Low 1 unhealthy d/yr today · 2 by 30 yrs out
Nearby sold comps map
Loading sold comps map…
Walkable amenities ~0.75 mi
Loading nearby amenities…
Taxation est. · year 1
- Rental income
- $19,589
- − Mortgage interest
- −$8,850
- − Property taxes
- −$2,331
- − Insurance
- −$790
- − Repairs & maintenance
- −$1,567
- − Management
- −$1,567
- − Depreciation
- −$4,596
- Taxable loss
- −$113
- Est. tax savings @ 24.0%
- +$27
- After-tax cash flow
- $2,439/yr
For passive investors: Depreciation is non-cash, so a rental often shows a tax loss while cash-flowing — sheltering income. Rental losses are passive: they offset passive income freely, and up to $25,000/yr can offset ordinary (W-2) income if you actively participate and your MAGI is under $100k (phasing out to $0 by $150k); unused losses carry forward. On sale, claimed depreciation is recaptured at up to 25%, and gains may owe capital-gains tax (a 1031 exchange can defer both). Figures are a year-1 estimate at your 24.0% rate — not tax advice; consult a CPA.
Schools (NCES district)
- District
- Logan-Hocking Local
- NCES district ID
- 3904424
- Math proficiency
- 55% ▼ -16.00%
- Reading proficiency
- 58% ▼ -11.00%
- Median HH income
- $42,737
- Composite
- 47.48/100
- National rank
- #2276
- State rank
- #354 of 656 in OH
Livability — Logan
- Score
- 78/100
- State rank
- #162
- US rank
- #2412
Category grades
Schools grade is shown separately in the Schools card above.
Census & demographics
- Census place
- Logan, OH
- County
- Hocking · 26,658 people
- Metro
- Columbus, OH
- Population (ZIP)
- 19,147
- Household income
- $65,028
- Rent vs Own
- Severe rent burden
- 13.8
Population outlook (Hocking County) Hauer SSP2
- Today (2025)
- 26,807 people
- By 2030
- 25,723 · -4.0%
- By 2040
- 23,370 · -12.8%
- By 2050
- 20,947 · -21.9%
- By 2075
- 15,624 · -41.7%
- By 2100
- 11,134 · -58.5%
Race, ethnicity, and origin ACS 2023
- Neighborhood character
- Predominantly White (93%)
- Race & ethnicity
- White 93% Two or more races 3% Hispanic / Latino 1%
- Common ancestry
- Slovak 2% Iranian 2% Italian 1%
- Foreign-born
- 1%
- Languages at home
- 99% English-only · Spanish 1%
Political lean MEDSL · Hocking
- 2024 margin
- Solid R (+44.3) · D 27.5% · R 71.8%
- 2008→2024 swing
- -43.5pp toward R · 2008: -0.8pp · 2024: -44.3pp
- All cycles
- 2024: R+44.3 2020: R+42.4 2016: R+36.5 2012: R+1.1 2008: R+0.8
Not yet ingested
- Civics
- —
Market trends
- HPI YoY
- ▼ -108.44%
- Current HPI
- 253.6737
- Rent YoY
- —
- Metro
- —
- State GDP YoY
- ▲ 1.98%
- F500 in state
- 48
Industry mix (Fortune 500 HQ in OH)
| Industry | F500 HQs | Revenue |
|---|---|---|
| Insurance | 3 | $145B |
|
||
| Industrial Machinery | 3 | $49B |
|
||
| Financial Services | 3 | $24B |
|
||
| Consumer Goods | 2 | $93B |
|
||
| Aerospace / Defense | 2 | $47B |
|
||
| Utilities | 2 | $33B |
|
||
Price history
+20.7% since first listed4 events — show timeline
- 2026-04-21 Price Changed $169,000 CBRMLS
- 2026-04-19 Listed $174,000 CBRMLS
- 2021-06-17 Listed $140,000 CBRMLS
- 2021-06-17 Sold (MLS) $140,000 CBRMLS
Property tax history
+9.5%/yrLatest (2025): $2,331 · +31.5% YoY. Source: county tax records.
Cash-flow waterfall
monthlySold comps — $/sqft
last 12 mo · ≤1 miLoading sold comps…