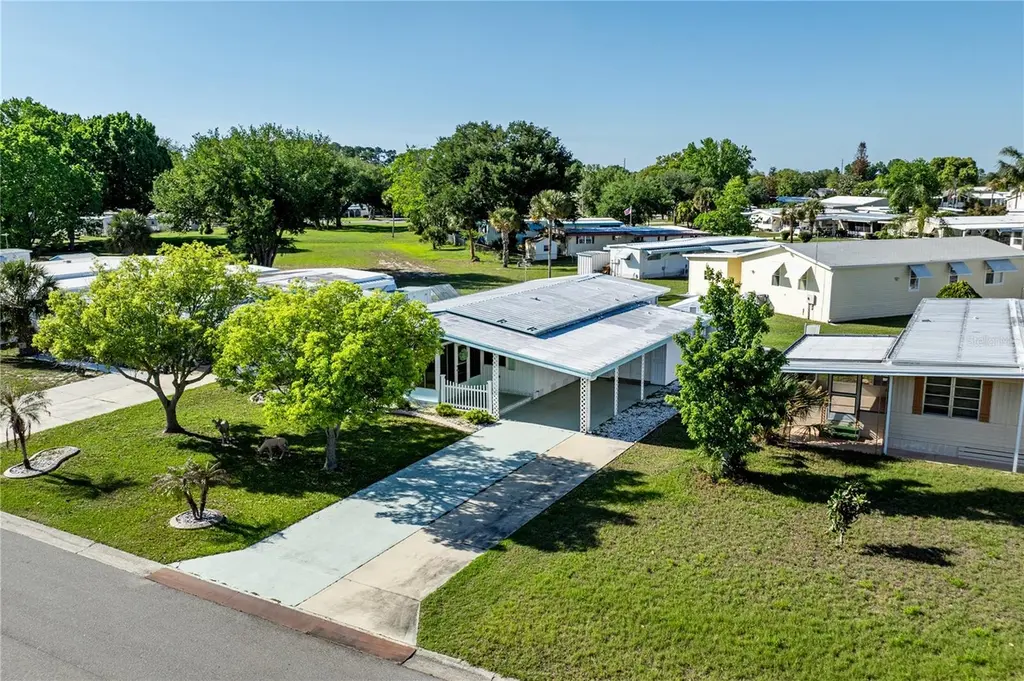
1026 Capella Dr · Tavares, FL
Flood risk 1/10 · Minimal
- FEMA flood zone
- X (unshaded)
- Chance of flooding over 30 yrs
- 0.0%
- Est. flood insurance / yr
- $507 – $1,088
Fire risk 1/10 · Minimal
- Est. fire insurance / yr
- $947 – $1,759
Heat risk 8/10 · Major
- Hot days now (above 108°F)
- 7 days/yr
- Hot days in 30 yrs
- 21 days/yr
Wind risk 9/10 · Severe
- Chance of severe wind over 30 yrs
- 99.0%
Air-quality risk 2/10 · Minimal
- Unhealthy air days now
- 1 days/yr
- Unhealthy air days in 30 yrs
- 1 days/yr
Risk factors via First Street. Map © Google.
Why this score? — see what drove the C+ grade
The composite is a weighted blend of 9 inputs, each scored 0–100. Each bar is that input's sub-score; the figure is the points it added to the 100-point composite (weight × sub-score).
- Cash flow +23.6/30.0
- ARV discount +10.7/15.0
- DSCR +7.6/10.0
- 1% rule +6.5/10.0
- Schools +4.2/10.0
- Livability +3.8/5.0
- Rent growth +3.5/5.0
- Condition / age +2.5/5.0
- Appreciation +0.0/10.0
$149,900
🖨 Deal sheet (PDF) 📄 Offer letter ✓ Due diligence
Listing remarks
Welcome to this beautifully maintained home in Lake Frances Estates, a vibrant 55+ community where you own your own land. Featuring a spacious primary suite with en suite bath, plus a second bedroom and full bath for guests, this home offers comfort, functionality, and room to enjoy. Double-pane windows provide energy efficiency, while the expansive kitchen with walk-in pantry offers abundant storage and workspace for everyday living or entertaining. Move-in ready and easy to maintain, this home also features a durable metal roof for long-lasting protection. The oversized backyard shed with electricity provides excellent space for hobbies, storage, or workshop use. Mature landscaping adds c
Key facts
- 6,000 sq ft lot
- Parking
- Community pool
Property features AI
Finance
- Other: Furnished: Negotiable
- Financial info: Total monthly fees listed as $52; total annual fees listed as $624
- HOA & community: Monthly HOA fee: $52 (includes common area taxes, pool, management, private road, recreational facilities); Community amenities: Pool, clubhouse, recreation facilities; Deed restrictions; Golf carts allowed; Senior community; Pets allowed
Exterior
- Parking: Covered parking; Driveway; 1-car carport; Garage (16x12)
- Utilities: Public water; Public sewer; Electricity connected; Cable available; Broadband/high-speed internet available; Sewer available/connected
- Home design: Residential mobile home (double wide); One story; North-facing
- Construction: Metal siding and frame construction; Metal roof; Crawlspace foundation; Built as double wide
- Exterior features: Covered, enclosed front porch; Awning(s); Shed(s); Mature landscaping with oak trees; Cleared and landscaped lot; Near public transit; Paved driveway and roads
Interior
- Kitchen: Dishwasher; Range; Microwave; Electric water heater
- Bedrooms: 2 bedrooms
- Flooring: Hardwood; Tile; Vinyl
- Bathrooms: 2 full bathrooms
- Heating & cooling: Central heating; Heat pump; Central air
- Interior features: Ceiling fans; Open floor plan; Thermostat; Window treatments; Blinds; Double-pane windows; Drapes; Smoke detector(s)
- Laundry & utility: Washer hookup; Dryer hookup (electric); Common area laundry
Neighborhood map
What this means for you Summary
Snapshot
- This is a 2-bed/2.0-bath manufactured listed at $150k.
Deal economics
- At list price, monthly cash flow is $283 ($3k/yr) — positive.
- The deal already cash-flows at list — no discount required.
- Meets the 1% rule at list price ($2k rent vs $150k).
- Recommended offer: $141k (6.0% below list) — sets the bar for market timing.
- Cap rate 8.6% vs local median 4.5% in Tavares — top-decile yield for the area; either an underpriced asset or a hidden risk that comps aren't pricing in. Stress-test before assuming the spread holds.
Location & tenants
- Location reads 76/100 on livability (#220 in FL, #3,464 nationally) — a middle-class / working-renter tenant base. Strengths: crime A+, cost of living A+, housing A+; Watch: employment D, amenities F, commute F.
- Lake (suburban): math 49% / reading 50% proficiency, ranked #37 of 73 in FL (top 51%) — families likely to look elsewhere, expect single-tenant / working-renter base with shorter leases.
- Market conditions: Rents rising fast (+4.0%/yr); 501 active listings in the ZIP; 11 comparable units currently listed for rent nearby; rentals at typical pace (median 19d on market — plan ~3-4 weeks tenant-placement turnaround); 4,799 units permitted in Lake County in 2024 (814 in 5+ unit buildings).
- This rent runs 33% of the median local income ($63k/yr) — at the standard rent-burdened threshold; future hikes will face affordability resistance.
Forward outlook
- Local home prices are declining (-3.0%/yr); year-one equity from $1k of loan paydown is wiped out by about $4k of value loss. Plan a longer hold.
- Lake County population projected at +37% by 2050 — long-run rental-demand tailwind backs the buy-and-hold thesis.
Negotiation context
- It's been on market 61 days — a 6% lower offer ($141k) is reasonable based on typical stale-listing flexibility.
- 6 sale attempts since 18y ago with the ask held roughly flat each time — persistent listings suggest the price (not the market) is what's stuck; bring a comps-based counter.
- Current owner paid $47k; list at $150k implies a 219% gain — meaningful room to come down on a strong offer.
Risks & watch-outs
- Climate carrying-cost: severe wind risk, 99% chance of damaging wind over 30y; extreme-heat days projected 7→21/yr by 2055 (HVAC capex compounding) — expect insurance premiums to compound above CPI over the hold.
Questions for the listing agent
- It's been on market 61 days. Have you received any prior offers? Is the seller open to a 6% concession, seller financing, or rate buy-down credit?
- Built in 1972 — when were the roof, HVAC, electrical panel, plumbing, and water heater last replaced?
- What does the HOA fee cover, when was the last increase, and are there any pending special assessments or reserve-fund shortfalls?
- Why hasn't it sold? Are there any deal-killer items the seller is aware of (foundation, flood, title, zoning, code violations)?
- Is there a deadline driving the sale (1031 exchange, divorce, estate, relocation)? That informs how much negotiation room exists.
- What's the average days-on-market for RENTAL listings here right now (not sales)? A rising rental-DOM trend means longer vacancies and softer asking-rent achievability than the comps imply.
- What's the recent tenant-quality profile in this submarket — average credit score on applications, eviction rate, late-payment / NSF rate, and stable-employment percentage? A property-management company in the area should have these aggregated.
- How much new for-sale + rental construction is in the pipeline within 1–3 miles? Heavy new supply typically softens prices + rents 12–24 months out; constrained supply supports both.
Investment metrics
- 1% rule
- 1.15% ✓
- Cap rate
- 8.56%
- Cash-on-cash
- 8.10%
- DSCR
- 1.36
- GRM
- 7.2
CMA / ARV
- ARV (on-the-fly)
- $161,568
- Comps found
- 6
Show comp detail 6 sales within ~0.75 mi
| Address | Dist | Beds/Ba | Sqft | Sold | Price | $/sf | Match |
|---|---|---|---|---|---|---|---|
| 1024 Capella Dr | 0.01mi | 2/2.0 | 1,104 (+4%) | 4mo | $55,000 | $50 | 88 |
| 1424 Mohawk Cir | 0.27mi | 2/2.0 | 1,160 (+10%) | 2mo | $195,000 | $168 | 70 |
| 1209 Apache Cir | 0.18mi | 2/2.0 | 1,152 (+9%) | 9mo | $128,000 | $111 | 69 |
| 1408 Skyline Ct | 0.27mi | 2/2.0 | 1,144 (+8%) | 8mo | $92,000 | $80 | 67 |
| 1687 Elkhart Cir | 0.47mi | 2/2.0 | 1,000 (-5%) | 6mo | $160,000 | $160 | 64 |
| 1681 Elkhart Cir | 0.46mi | 2/2.0 | 1,125 (+6%) | 7mo | $172,000 | $153 | 62 |
Match score weights: distance 35% · size 25% · config 20% · recency 20%. Top-matched comps best support the ARV.
Projected returns pro-forma
-3.0% appreciation · 4.05% rent growth · sell at horizon
- IRR
- -2.7%
- Equity multiple
- 0.90×
- Total profit
- $-4,336
- Equity at exit
- $22,351
- IRR
- 8.2%
- Equity multiple
- 1.65×
- Total profit
- $27,439
- Equity at exit
- $12,961
Cash invested: $41,972 (down + closing). Projections, not guarantees.
Landlord ↔ Tenant lean methodology
- Overall (STATE)
- 87 Strongly Landlord-Friendly
- State Florida
- 87 Strongly Landlord-Friendly · R+3
- County
- — inherits STATE
- City
- — inherits STATE
ZIP-level market 32778
- Home prices YoY
- -23.4%
- Rents YoY
- 4.0%
- Active inventory
- 501
- Price-to-rent
- 7.2×
Monthly cashflow live
- Estimated rent
- $1,731 high interval (Pro) →
- Mortgage (P&I)
- −$786
- Tax from tax record
- −$183 /mo · $2,200/yr
- Insurance
- −$62
- HOA
- −$52
- Vacancy / Maint / Mgmt
- −$363
- Net cashflow
- $283
Break-even live
Sensitivity live
| Price | -10% $368 | -5% $326 | +0% $283 | +5% $241 | +10% $199 |
|---|---|---|---|---|---|
| Rent | -10% $147 | -5% $215 | +0% $283 | +5% $352 | +10% $420 |
| Rate | -1.0pp $359 | -0.5pp $322 | base $283 | +0.5pp $245 | +1.0pp $205 |
UW: 25.0% down · 7.5% · 30yr · 1.5% tax · 5.0% vac · 8.0% maint · 8.0% mgmt
Financing live
Cash to close
- Down payment
- $37,475
- Closing costs
- $4,497
- Reserves months
- —
- Total cash needed
- —
Loan-product check · same deal, 3 products live
Conventional
25% down · 7.5% · 30yr
- Down + closing
- —
- Monthly P&I
- —
- Monthly cashflow
- —
- DSCR
- —
- Eligible?
- —
Personal DTI + credit; lowest rate.
DSCR
20% down · 8.5% · 30yr
- Down + closing
- —
- Monthly P&I
- —
- Monthly cashflow
- —
- DSCR
- —
- Eligible?
- —
No personal income docs; deal must DSCR.
Hard money
10% down · 12.0% · 12mo
- Down + closing
- —
- Monthly P&I
- —
- Monthly cashflow
- —
- DSCR
- —
- Eligible?
- —
Short-term bridge; refi at stabilization.
Rent comps 11 comps
| Address | Beds | Baths | Sqft | Rent | $/sqft | DOM | Units | Dist |
|---|---|---|---|---|---|---|---|---|
| 1105 N Rockingham Ave Tavares, FL | 2.0 | 2.0 | 806 | $1,650 | $2.05 | 5d | 1 | 0.31mi |
| 807 McLain Ct Tavares, FL | 2.0 | 2.0 | 1104 | $1,700 | $1.54 | 17d | 1 | 0.32mi |
| 542 E Caroline St Tavares, FL | 2.0 | 1.0 | 812 | $1,400 | $1.72 | 24d | 1 | 0.48mi |
| 743 E Alfred St Tavares, FL | 2.0 | 1.0 | 1000 | $1,450 | $1.45 | 24d | 1 | 0.51mi |
| 380 Dora Ave Tavares, FL | 2.0 | 1.0 | 750 | $1,399 | $1.87 | 15d | 1 | 0.53mi |
| 1403 E Alfred St Unit 200 Tavares, FL | 2.0 | 1.5 | 1000 | $2,000 | $2.00 | 18d | 1 | 0.76mi |
| 1632 Tudor Ln Unit 1632 Tavares, FL | 2.0 | 2.0 | 1047 | $1,595 | $1.52 | 18d | 1 | 0.80mi |
| 2225 Cypress Ct Unit 2C Tavares, FL | 2.0 | 2.0 | 1334 | $2,000 | $1.50 | 24d | 1 | 0.83mi |
| 123 N Lake Ave Tavares, FL | 2.0 | 1.0 | 1120 | $1,595 | $1.42 | 24d | 1 | 1.09mi |
| 2420 Ann Rou Rd Unit 201 Tavares, FL | 1.0 | 1.0 | 1000 | $1,555 | $1.55 | 18d | 1 | 1.33mi |
| 2460 Ann Rou Rd Unit 606 Tavares, FL | 2.0 | 2.0 | 1167 | $1,750 | $1.50 | 18d | 1 | 1.45mi |
HOA detail
- Monthly dues
- $52 · $624/yr
- Likely covers
- electriclandscaping
Listing history 42 events
-
2026-06-18days on market $149,900 Active 61 DOM
-
2026-06-17days on market $149,900 Active 60 DOM
-
2026-06-16days on market $149,900 Active 59 DOM
-
2026-06-15days on market $149,900 Active 58 DOM
-
2026-06-13days on market $149,900 Active 56 DOM
-
2026-06-09days on market $149,900 Active 52 DOM
-
2026-06-08days on market $149,900 Active 51 DOM
-
2026-06-07days on market $149,900 Active 50 DOM
-
2026-06-04days on market $149,900 Active 47 DOM
-
2026-06-03days on market $149,900 Active 46 DOM
-
2026-06-02days on market $149,900 Active 45 DOM
-
2026-06-01days on market $149,900 Active 44 DOM
-
2026-05-31days on market $149,900 Active 43 DOM
-
2026-04-18$149,900 Active
-
2026-04-15historical
-
2026-04-12price $152,000
-
2026-03-29price $157,000
-
2026-03-12price $159,000
-
2026-02-13price $162,500
-
2026-02-07price $167,000
-
2026-02-07price $16,700
-
2026-01-26status Active
-
2026-01-26historical
-
2026-01-15$170,000 Active
-
2026-01-13historical
-
2025-12-26price $168,900
-
2025-12-26price $168,500
-
2025-09-26price $175,000
-
2025-09-19price $180,000
-
2025-07-07price $185,000
-
2025-04-03price $186,000
-
2025-03-02price $190,000
-
2025-01-21$189,000 Active
-
2010-04-16soldstatus $47,000
-
2010-04-13soldstatus $47,000
-
2009-09-02$49,000
-
2009-01-17historical
-
2008-12-05$74,900
-
2007-01-24soldstatus $80,000
-
2006-08-24soldstatus $57,000
-
2003-04-02soldstatus $46,000
-
2000-04-04soldstatus $17,500
ⓘ Source: listings_history table (triggers on properties + properties_extension) + one-shot
backfill from property_details.listing_events for pre-trigger history.
Tax reassessment forecast FL · Resets to sale price
- Current annual tax
- $2,200 · $183/mo
- Projected year-2 tax
- $2,200 · $183/mo
- Expected delta
- $0/yr ($0/mo · 0.0%)
ⓘ Screening estimate from a state-policy table — verify with the county assessor before closing.
Climate risk First Street
- Flood 1/10 Low FEMA zone X (unshaded) · 0% chance over 30 yrs
- Wildfire 1/10 Low
- Heat 8/10 Severe 7 d/yr ≥108°F today · 21 d/yr by 30 yrs out
- Wind 9/10 Extreme 99% chance of damaging wind over 30 yrs
- Air quality 2/10 Low 1 unhealthy d/yr today · 1 by 30 yrs out
Nearby sold comps map
Loading sold comps map…
Walkable amenities ~0.75 mi
Loading nearby amenities…
Taxation est. · year 1
- Rental income
- $20,770
- − Mortgage interest
- −$8,397
- − Property taxes
- −$2,200
- − Insurance
- −$750
- − Repairs & maintenance
- −$1,662
- − Management
- −$1,662
- − HOA
- −$624
- − Depreciation
- −$4,361
- Taxable income
- $1,115
- Est. tax owed @ 24.0%
- −$268
- After-tax cash flow
- $3,133/yr
For passive investors: Depreciation is non-cash, so a rental often shows a tax loss while cash-flowing — sheltering income. Rental losses are passive: they offset passive income freely, and up to $25,000/yr can offset ordinary (W-2) income if you actively participate and your MAGI is under $100k (phasing out to $0 by $150k); unused losses carry forward. On sale, claimed depreciation is recaptured at up to 25%, and gains may owe capital-gains tax (a 1031 exchange can defer both). Figures are a year-1 estimate at your 24.0% rate — not tax advice; consult a CPA.
Schools (NCES district)
- District
- Lake
- NCES district ID
- 1201050
- Math proficiency
- 49% ▼ -7.00%
- Reading proficiency
- 50% ▼ -4.00%
- Median HH income
- $46,632
- Composite
- 42.05/100
- National rank
- #3327
- State rank
- #37 of 73 in FL
Livability — Tavares
- Score
- 76/100
- State rank
- #220
- US rank
- #3464
Category grades
Schools grade is shown separately in the Schools card above.
Census & demographics
- Census place
- Tavares, FL
- County
- Lake County · 364,602 people
- City population
- 25,042
- Metro
- Orlando-Kissimmee-Sanford, FL
- Population (ZIP)
- 25,042
- Household income
- $63,472
- Rent vs Own
- Severe rent burden
- 586.0
Population outlook (Lake County) Hauer SSP2
- Today (2025)
- 386,640 people
- By 2030
- 417,107 · +7.9%
- By 2040
- 476,676 · +23.3%
- By 2050
- 531,296 · +37.4%
- By 2075
- 648,303 · +67.7%
- By 2100
- 698,530 · +80.7%
Race, ethnicity, and origin ACS 2023
- Neighborhood character
- Predominantly White (72%)
- Race & ethnicity
- White 72% Hispanic / Latino 14% Two or more races 8% Black 8% Asian 2%
- Hispanic origin (detail)
- Mexican 1% Puerto Rican 7% Cuban 2% Dominican 1%
- Common ancestry
- Romanian 4% Italian 3% Slovak 2%
- Foreign-born
- 9% · Canada, Dominican Republic, Jamaica
- Languages at home
- 85% English-only · Spanish 11% Other Indo-European 2% Other Asian/Pacific 1%
Political lean MEDSL · Lake
- 2024 margin
- Strong R (+24.7) · D 37.3% · R 62.0%
- 2008→2024 swing
- -11.2pp toward R · 2008: -13.5pp · 2024: -24.7pp
- All cycles
- 2024: R+24.7 2020: R+20.0 2016: R+23.1 2012: R+17.1 2008: R+13.5
Not yet ingested
- Civics
- —
Market trends
- HPI YoY
- ▼ -88.07%
- Current HPI
- 288.7123
- Rent YoY
- ▲ 4.05%
- Metro
- Orlando-Kissimmee-Sanford, FL
- State GDP YoY
- ▲ 3.28%
- F500 in state
- 36
Industry mix (Fortune 500 HQ in FL)
| Industry | F500 HQs | Revenue |
|---|---|---|
| Industrial Technology | 2 | $29B |
|
||
| Insurance | 2 | $17B |
|
||
| Retail | 1 | $60B |
|
||
| Technology Distribution | 1 | $58B |
|
||
| Homebuilding | 1 | $35B |
|
||
| Technology Manufacturing | 1 | $35B |
|
||
Price history
+756.6% since first listed29 events — show timeline
- 2026-04-18 Listed $149,900 Stellar MLS as Distributed by MLS Grid
- 2026-04-15 Listing Removed — Stellar MLS as Distributed by MLS Grid
- 2026-04-12 Price Changed $152,000 Stellar MLS as Distributed by MLS Grid
- 2026-03-29 Price Changed $157,000 Stellar MLS as Distributed by MLS Grid
- 2026-03-12 Price Changed $159,000 Stellar MLS as Distributed by MLS Grid
- 2026-02-13 Price Changed $162,500 Stellar MLS as Distributed by MLS Grid
- 2026-02-07 Price Changed $167,000 Stellar MLS as Distributed by MLS Grid
- 2026-02-07 Price Changed $16,700 Stellar MLS as Distributed by MLS Grid
- 2026-01-26 Relisted — Stellar MLS as Distributed by MLS Grid
- 2026-01-26 Listing Removed — Stellar MLS as Distributed by MLS Grid
- 2026-01-15 Listed $170,000 Stellar MLS as Distributed by MLS Grid
- 2026-01-13 Listing Removed — Stellar MLS as Distributed by MLS Grid
- 2025-12-26 Price Changed $168,900 Stellar MLS as Distributed by MLS Grid
- 2025-12-26 Price Changed $168,500 Stellar MLS as Distributed by MLS Grid
- 2025-09-26 Price Changed $175,000 Stellar MLS as Distributed by MLS Grid
- 2025-09-19 Price Changed $180,000 Stellar MLS as Distributed by MLS Grid
- 2025-07-07 Price Changed $185,000 Stellar MLS as Distributed by MLS Grid
- 2025-04-03 Price Changed $186,000 Stellar MLS as Distributed by MLS Grid
- 2025-03-02 Price Changed $190,000 Stellar MLS as Distributed by MLS Grid
- 2025-01-21 Listed $189,000 Stellar MLS as Distributed by MLS Grid
- 2010-04-16 Sold (Public Records) $47,000 Public Records
- 2010-04-13 Sold (MLS) $47,000 Stellar MLS as Distributed by MLS Grid
- 2009-09-02 Listed $49,000 Stellar MLS as Distributed by MLS Grid
- 2009-01-17 Listing Removed — Stellar MLS as Distributed by MLS Grid
- 2008-12-05 Listed $74,900 Stellar MLS as Distributed by MLS Grid
- 2007-01-24 Sold (Public Records) $80,000 Public Records
- 2006-08-24 Sold (Public Records) $57,000 Public Records
- 2003-04-02 Sold (Public Records) $46,000 Public Records
- 2000-04-04 Sold (Public Records) $17,500 Public Records
Property tax history
+8.4%/yrLatest (2025): $2,200 · +13.6% YoY. Source: county tax records.
Cash-flow waterfall
monthlySold comps — $/sqft
last 12 mo · ≤1 miLoading sold comps…