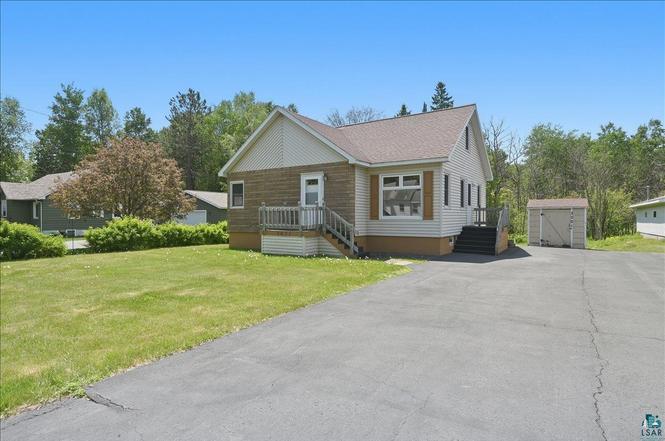
3021 Hutchinson Rd · Duluth, MN
Flood risk 1/10 · Minimal
- FEMA flood zone
- X
- Chance of flooding over 30 yrs
- 0.0%
- Est. flood insurance / yr
- $473 – $860
Fire risk 3/10 · Minor
- Est. fire insurance / yr
- $888 – $1,650
Heat risk 1/10 · Minimal
- Hot days now (above 90°F)
- 7 days/yr
- Hot days in 30 yrs
- 12 days/yr
Wind risk 1/10 · Minimal
- Chance of severe wind over 30 yrs
- —
Air-quality risk 2/10 · Minimal
- Unhealthy air days now
- 0 days/yr
- Unhealthy air days in 30 yrs
- 1 days/yr
Risk factors via First Street. Map © Google.
Why this score? — see what drove the B grade
The composite is a weighted blend of 9 inputs, each scored 0–100. Each bar is that input's sub-score; the figure is the points it added to the 100-point composite (weight × sub-score).
- Cash flow +26.7/30.0
- ARV discount +15.0/15.0
- DSCR +9.2/10.0
- 1% rule +6.6/10.0
- Schools +4.2/10.0
- Livability +4.1/5.0
- Rent growth +3.7/5.0
- Condition / age +2.5/5.0
- Appreciation +0.0/10.0
$280,000
🖨 Deal sheet 📄 Offer letter ✓ Due diligence
Listing remarks
Offered for the first time in years, this charming expansion bungalow has been lovingly cared for by just three owners since it was built in 1950. Situated on a rare . 79-acre lot, the property offers room to spread out while still being conveniently located near shopping, dining, and all that Duluth has to offer. The main floor features two bedrooms, a full bath, a bright living room, and an eat-in kitchen with an open dining area. Upstairs, you'll find a spacious third bedroom occupying the entire expansion level, providing flexibility for a primary suite, guest room, office, or hobby space. The full unfinished basement offers abundant storage and exciting possibilities for future expansi
Key facts
- Open dining area
- Rare lot
- Bright living room
Tags
Property features AI
Finance
- Other: Directions available to property
Exterior
- Parking: Common asphalt parking; no dedicated garage
- Utilities: Public water; Public sewer
- Home design: Single-family detached residence; One-story home
- Construction: Full unfinished basement
- Exterior features: Shed(s) on the property; Lot dimensions approximately 70 x 140 and 143 x 173; Lot size about 0.79 acre
Interior
- Kitchen: Eat-in kitchen
- Bedrooms: Primary bedroom located on the main level
- Flooring: Hardwood flooring
- Bathrooms: 1 full bathroom
- Heating & cooling: Forced air heating (natural gas); Central air conditioning
- Interior features: Eat-in kitchen; Primary bedroom on main level; Full unfinished basement
- Laundry & utility: Basement utility space (full, unfinished)
Neighborhood map
What this means for you Summary
Snapshot
- This is a 3-bed/1.0-bath single-family listed at $280k.
Deal economics
- At list price, monthly cash flow is $758 ($9k/yr) — positive.
- The deal already cash-flows at list — no discount required.
- Meets the 1% rule at list price ($3k rent vs $280k).
- Cap rate 9.5% vs local median 4.9% in Duluth — top-decile yield for the area; either an underpriced asset or a hidden risk that comps aren't pricing in. Stress-test before assuming the spread holds.
Location & tenants
- Location reads 82/100 on livability (#36 in MN, #1,060 nationally) — a professional / high-income tenant draw. Strengths: commute A+, cost of living A+, housing A+; Watch: amenities F.
- Duluth Public School District (urban): math 44% / reading 55% proficiency, ranked #132 of 301 in MN (top 44%) — families likely to look elsewhere, expect single-tenant / working-renter base with shorter leases.
- Market conditions: Rents rising fast (+4.6%/yr); 206 active listings in the ZIP; 3 comparable units currently listed for rent nearby; rentals lingering (median 44d on market — plan ~5-8 weeks vacancy on turnover, expect pricing pressure); 67% of comp listings sitting > 30 days — soft ceiling on asking rent; solid renter incomes; 639 units permitted in St. Louis County in 2024 (338 in 5+ unit buildings).
- At $3,260/mo this rent would consume 49% of the median local household income ($80k/yr) (locally 1019% of renters already pay >50% of income on rent) — very limited rent-growth headroom before tenants either downsize or default.
Forward outlook
- Local home prices are declining (-3.0%/yr); year-one equity from $2k of loan paydown is wiped out by about $8k of value loss. Plan a longer hold.
- At projected returns (-3.0% appreciation + 4.6% rent growth), your $78k cash investment doubles in ~9 years — after that, you're playing with house money.
Negotiation context
- Only 3 days on market — expect competitive offers; lowballing is unlikely to land.
Risks & watch-outs
- Watch-outs: built in 1950 — expect roof / HVAC / electrical / plumbing capex.
Questions for the listing agent
- Built in 1950 — when were the roof, HVAC, electrical panel, plumbing, and water heater last replaced?
- Is there a deadline driving the sale (1031 exchange, divorce, estate, relocation)? That informs how much negotiation room exists.
- Schools are B-rated — typically a magnet for longer-tenancy family renters. What's the average tenant stay here, and is there a school-zone premium baked into asking?
- What's the average days-on-market for RENTAL listings here right now (not sales)? A rising rental-DOM trend means longer vacancies and softer asking-rent achievability than the comps imply.
- What's the recent tenant-quality profile in this submarket — average credit score on applications, eviction rate, late-payment / NSF rate, and stable-employment percentage? A property-management company in the area should have these aggregated.
- How much new for-sale + rental construction is in the pipeline within 1–3 miles? Heavy new supply typically softens prices + rents 12–24 months out; constrained supply supports both.
Investment metrics
- 1% rule
- 1.16% ✓
- Cap rate
- 9.54%
- Cash-on-cash
- 11.60%
- DSCR
- 1.52
- GRM
- 7.2
CMA / ARV
- ARV (on-the-fly)
- $363,392
- Comps found
- 12
Show comp detail 12 sales within ~0.75 mi
| Address | Dist | Beds/Ba | Sqft | Sold | Price | $/sf | Match |
|---|---|---|---|---|---|---|---|
| 2893 Hutchinson Rd | 0.08mi | 3/1.0 | 1,210 (-9%) | 5mo | $369,900 | $306 | 77 |
| 3531 Piedmont Ave | 0.12mi | 2/1.0 (-1) | 1,226 (-8%) | 10mo | $225,000 | $184 | 68 |
| 4715 Portland Rd | 0.28mi | 3/2.0 | 1,224 (-8%) | 9mo | $333,000 | $272 | 61 |
| 2611 Chambersburg Ave | 0.69mi | 3/1.0 | 1,337 (+0%) | 12mo | $260,000 | $194 | 58 |
| 3928 Haines Rd | 0.63mi | 3/2.0 | 1,240 (-7%) | 2mo | $375,000 | $302 | 53 |
| 2308 Ensign St | 0.70mi | 3/1.0 | 1,370 (+2%) | 13mo | $291,000 | $212 | 52 |
| 2352 Ensign St | 0.60mi | 2/1.0 (-1) | 1,276 (-4%) | 12mo | $280,000 | $219 | 50 |
| 2440 Hutchinson Rd | 0.71mi | 3/2.0 | 1,228 (-8%) | 6mo | $445,000 | $362 | 44 |
| 3921 Haines Rd | 0.63mi | 2/2.0 (-1) | 1,487 (+11%) | 1mo | $354,000 | $238 | 42 |
| 3781 Alexander Rd | 0.37mi | 2/1.0 (-1) | 1,148 (-14%) | 16mo | $360,000 | $314 | 41 |
| 1819 Anderson Rd | 0.71mi | 2/2.5 (-1) | 1,252 (-6%) | 19mo | $340,000 | $272 | 30 |
| 2610 Harvey St | 0.62mi | 2/1.0 (-1) | 1,152 (-14%) | 21mo | $277,000 | $240 | 26 |
Match score weights: distance 35% · size 25% · config 20% · recency 20%. Top-matched comps best support the ARV.
Projected returns pro-forma
-3.0% appreciation · 4.6% rent growth · sell at horizon
- IRR
- 2.7%
- Equity multiple
- 1.10×
- Total profit
- $8,197
- Equity at exit
- $41,749
- IRR
- 13.7%
- Equity multiple
- 2.17×
- Total profit
- $91,795
- Equity at exit
- $24,209
Cash invested: $78,400 (down + closing). Projections, not guarantees.
Landlord ↔ Tenant lean methodology
- Overall (STATE)
- 46 Balanced
- State Minnesota
- 46 Balanced · D+2
- County
- — inherits STATE
- City
- — inherits STATE
ZIP-level market 55811
- Rents YoY
- 4.6%
- Active inventory
- 206
- Price-to-rent
- 7.2×
Monthly cashflow live
- Estimated rent
- $3,260 medium interval (Pro) →
- Mortgage (P&I)
- −$1,468
- Tax from tax record
- −$233 /mo · $2,796/yr
- Insurance
- −$117
- HOA
- −$0
- Vacancy / Maint / Mgmt
- −$685
- Net cashflow
- $758
Break-even live
UW: 25.0% down · 7.5% · 30yr · 1.5% tax · 5.0% vac · 8.0% maint · 8.0% mgmt
Financing live
Cash to close
- Down payment
- $70,000
- Closing costs
- $8,400
- Reserves months
- —
- Total cash needed
- —
Loan-product check · same deal, 3 products live
Conventional
25% down · 7.5% · 30yr
- Down + closing
- —
- Monthly P&I
- —
- Monthly cashflow
- —
- DSCR
- —
- Eligible?
- —
Personal DTI + credit; lowest rate.
DSCR
20% down · 8.5% · 30yr
- Down + closing
- —
- Monthly P&I
- —
- Monthly cashflow
- —
- DSCR
- —
- Eligible?
- —
No personal income docs; deal must DSCR.
Hard money
10% down · 12.0% · 12mo
- Down + closing
- —
- Monthly P&I
- —
- Monthly cashflow
- —
- DSCR
- —
- Eligible?
- —
Short-term bridge; refi at stabilization.
Rent comps 3 comps
| Address | Beds | Baths | Sqft | Rent | $/sqft | DOM | Units | Dist |
|---|---|---|---|---|---|---|---|---|
| 2302 Hillcrest Dr Duluth, MN | 3.0 | 1.5 | 1072 | $3,500 | $3.26 | 43d | 1 | 1.09mi |
| 3829 Stebner Rd Hermantown, MN | 3.0 | 2.0 | 1600 | $3,795 | $2.37 | 21d | 1 | 1.26mi |
| 505 W Orange St Duluth, MN | 3.0 | 1.0 | 1022 | $3,500 | $3.42 | 43d | 1 | 1.47mi |
Listing history 3 events
-
2026-06-14statusdays on market $280,000 Pending 3 DOM
-
2026-06-13remarks 699-char remark
-
2026-06-13$280,000 Active 2 DOM
ⓘ Source: listings_history table (triggers on properties + properties_extension) + one-shot
backfill from property_details.listing_events for pre-trigger history.
Tax reassessment forecast MN · Partial reset (capped growth)
- Current annual tax
- $2,796 · $233/mo
- Projected year-2 tax
- $2,966 · $247/mo
- Expected delta
- +$170/yr (+$14/mo · 6.1%)
ⓘ Screening estimate from a state-policy table — verify with the county assessor before closing.
Climate risk First Street
- Flood 1/10 Low FEMA zone X · 0% chance over 30 yrs
- Wildfire 3/10 Moderate
- Heat 1/10 Low 7 d/yr ≥90°F today · 12 d/yr by 30 yrs out
- Wind 1/10 Low
- Air quality 2/10 Low 0 unhealthy d/yr today · 1 by 30 yrs out
Nearby sold comps map
Loading sold comps map…
Walkable amenities ~0.75 mi
Loading nearby amenities…
Taxation est. · year 1
- Rental income
- $39,125
- − Mortgage interest
- −$15,684
- − Property taxes
- −$2,796
- − Insurance
- −$1,400
- − Repairs & maintenance
- −$3,130
- − Management
- −$3,130
- − Depreciation
- −$8,145
- Taxable income
- $4,839
- Est. tax owed @ 24.0%
- −$1,161
- After-tax cash flow
- $7,931/yr
For passive investors: Depreciation is non-cash, so a rental often shows a tax loss while cash-flowing — sheltering income. Rental losses are passive: they offset passive income freely, and up to $25,000/yr can offset ordinary (W-2) income if you actively participate and your MAGI is under $100k (phasing out to $0 by $150k); unused losses carry forward. On sale, claimed depreciation is recaptured at up to 25%, and gains may owe capital-gains tax (a 1031 exchange can defer both). Figures are a year-1 estimate at your 24.0% rate — not tax advice; consult a CPA.
Schools (NCES district)
- District
- Duluth Public School District
- NCES district ID
- 2711040
- Math proficiency
- 44% ▼ -10.00%
- Reading proficiency
- 55% ▼ -6.00%
- Median HH income
- $45,692
- Composite
- 41.92/100
- National rank
- #3360
- State rank
- #132 of 301 in MN
Livability — Duluth
- Score
- 82/100
- State rank
- #36
- US rank
- #1060
Category grades
Schools grade is shown separately in the Schools card above.
Census & demographics
- Census place
- Duluth, MN
- County
- Saint Louis County · 115,152 people
- City population
- 71,097
- Metro
- Duluth, MN-WI
- Population (ZIP)
- 28,118
- Household income
- $79,804
- Rent vs Own
- Severe rent burden
- 1019.0
Population outlook (St. Louis County) Hauer SSP2
- Today (2025)
- 202,411 people
- By 2030
- 203,234 · +0.4%
- By 2040
- 202,520 · +0.1%
- By 2050
- 200,853 · -0.8%
- By 2075
- 200,943 · -0.7%
- By 2100
- 192,058 · -5.1%
Race, ethnicity, and origin ACS 2023
- Neighborhood character
- Predominantly White (91%)
- Race & ethnicity
- White 91% Two or more races 4% Hispanic / Latino 2% Asian 2% Black 1%
- Common ancestry
- Portuguese 14% Romanian 7% Lithuanian 3%
- Foreign-born
- 2% · Canada
- Languages at home
- 97% English-only · Spanish 1% Other Indo-European 1%
Political lean MEDSL · St. Louis
- 2024 margin
- D (+13.7) · D 55.9% · R 42.2% · Other 1.8%
- 2008→2024 swing
- -18.8pp toward R · 2008: 32.5pp · 2024: 13.7pp
- All cycles
- 2024: D+13.7 2020: D+15.6 2016: D+11.8 2012: D+29.6 2008: D+32.5
Not yet ingested
- Civics
- —
Market trends
- HPI YoY
- ▼ -252.84%
- Current HPI
- 198.2613
- Rent YoY
- ▲ 4.60%
- Metro
- Duluth, MN-WI
- State GDP YoY
- ▲ 2.41%
- F500 in state
- 34
Industry mix (Fortune 500 HQ in MN)
| Industry | F500 HQs | Revenue |
|---|---|---|
| Healthcare | 2 | $407B |
|
||
| Retail | 2 | $150B |
|
||
| Consumer Goods | 2 | $32B |
|
||
| Industrial Machinery | 2 | $6B |
|
||
| Agriculture | 1 | $40B |
|
||
| Healthcare / Medical Devices | 1 | $32B |
|
||
Price history
1 event — show timeline
- 2026-06-10 Listed $280,000 LSAR
Property tax history
+6.6%/yrLatest (2025): $2,796 · +2.4% YoY. Source: county tax records.
Cash-flow waterfall
monthlySold comps — $/sqft
last 12 mo · ≤1 miLoading sold comps…