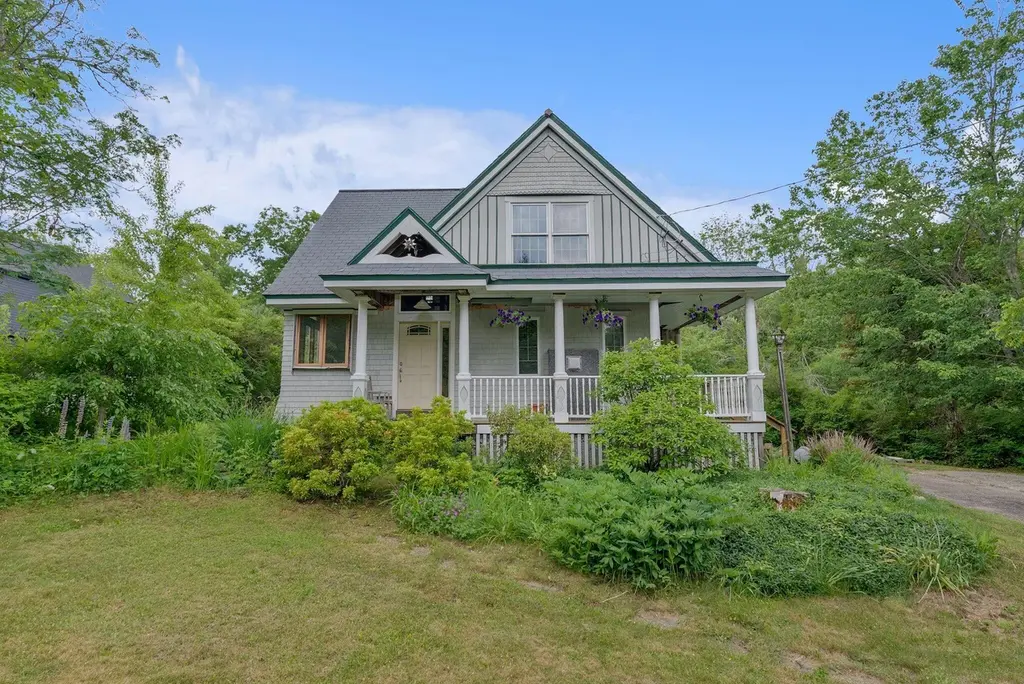
85 Old Port Rd · Kennebunk, ME
Flood risk 1/10 · Minimal
- FEMA flood zone
- X
- Chance of flooding over 30 yrs
- 0.0%
- Est. flood insurance / yr
- $473 – $860
Fire risk 3/10 · Minor
- Est. fire insurance / yr
- $669 – $1,243
Heat risk 4/10 · Minor
- Hot days now (above 86°F)
- 7 days/yr
- Hot days in 30 yrs
- 17 days/yr
Wind risk 6/10 · Moderate
- Chance of severe wind over 30 yrs
- 67.0%
Air-quality risk 2/10 · Minimal
- Unhealthy air days now
- 1 days/yr
- Unhealthy air days in 30 yrs
- 1 days/yr
Risk factors via First Street. Map © Google.
Why this score? — see what drove the B- grade
The composite is a weighted blend of 9 inputs, each scored 0–100. Each bar is that input's sub-score; the figure is the points it added to the 100-point composite (weight × sub-score).
- Cash flow +27.3/30.0
- DSCR +9.5/10.0
- Schools +8.0/10.0
- ARV discount +7.5/15.0
- 1% rule +6.7/10.0
- Livability +4.0/5.0
- Rent growth +2.5/5.0
- Condition / age +2.5/5.0
- Appreciation +0.0/10.0
$599,900
🖨 Deal sheet 📄 Offer letter ✓ Due diligence
Listing remarks
The right one will immediately see the Storybook Cottage vision here. Much work has been done to the original 1920 structure over the last twenty five years including removing the half second floor and adding a three-quarter story, updating the electrical system, updating to a four bedroom septic system, replacing windows, the roof, siding, appliances, installing a mini-split heat pump, and a gas fireplace. Details such as exposed beams, wide pine, mahogany and fir trimmed floors, stained glass inserts, marble, slate-look roofing shingles and copper trim show you what the Seller was working toward. The nearly three quarter acre features a back yard with a deck, patio and a secret garden wit
Key facts
- Three quarter story
- Mini split heat pump
- Gas fireplace
Tags
Property features AI
Exterior
- Parking: Gravel parking; 1–4 parking spaces
- Utilities: Public water; Private sewer; Electric service with circuit breakers; Electric water heater
- Home design: Single family residence; Built in 1920
- Construction: Wood frame construction; Wood siding; Shingle roof; Block foundation
- Exterior features: Deck; Patio; Near public beach; Near town; Neighborhood setting; Subdivided lot; Level lot; Paved road access
Interior
- Kitchen: Gas range; Refrigerator; Wall oven
- Bedrooms: Primary bedroom on second level; Bedroom 3 on second level
- Flooring: Laminate; Tile; Softwood
- Bathrooms: 2 full bathrooms
- Heating & cooling: Heat pump for heating; Heat pump for cooling
- Interior features: First-floor bedroom; Den; Living room; 1 fireplace; Unfurnished; 5 total rooms
- Laundry & utility: Laundry on upper level
Neighborhood map
What this means for you Summary
Snapshot
- This is a 3-bed/2.0-bath single-family listed at $600k.
Deal economics
- At list price, monthly cash flow is $2k ($21k/yr) — positive.
- The deal already cash-flows at list — no discount required.
- Meets the 1% rule at list price ($7k rent vs $600k).
- Cap rate 9.8% vs local median 3.2% in Kennebunk — top-decile yield for the area; either an underpriced asset or a hidden risk that comps aren't pricing in. Stress-test before assuming the spread holds.
Location & tenants
- Location reads 79/100 on livability (#20 in ME, #2,049 nationally) — a middle-class / working-renter tenant base. Strengths: schools A+, crime A+, employment A+; Watch: cost of living D+, amenities F, commute F.
- RSU 21 (rural): math 91% / reading 94% proficiency, ranked #13 of 112 in ME (top 12%) — strong family-tenant draw, lease renewals of 3-5y typical; only 16% free/reduced lunch — higher-income household profile.
- Market conditions: 132 active listings in the ZIP; 2 comparable units currently listed for rent nearby; 1,386 units permitted in York County in 2024 (338 in 5+ unit buildings).
Forward outlook
- Local home prices are declining (-3.0%/yr); year-one equity from $4k of loan paydown is wiped out by about $18k of value loss. Plan a longer hold.
- At projected returns (-3.0% appreciation + 3.0% rent growth), your $168k cash investment doubles in ~10 years — after that, you're playing with house money.
Negotiation context
- Only 1 days on market — expect competitive offers; lowballing is unlikely to land.
- Current owner paid $35k; list at $600k implies a 1614% gain — meaningful room to come down on a strong offer.
Risks & watch-outs
- Watch-outs: built in 1920 — expect roof / HVAC / electrical / plumbing capex.
- Climate carrying-cost: major wind risk, 67% chance of damaging wind over 30y — expect insurance premiums to compound above CPI over the hold.
Questions for the listing agent
- Built in 1920 — when were the roof, HVAC, electrical panel, plumbing, and water heater last replaced?
- Is there a deadline driving the sale (1031 exchange, divorce, estate, relocation)? That informs how much negotiation room exists.
- Schools are A-rated — typically a magnet for longer-tenancy family renters. What's the average tenant stay here, and is there a school-zone premium baked into asking?
- What's the average days-on-market for RENTAL listings here right now (not sales)? A rising rental-DOM trend means longer vacancies and softer asking-rent achievability than the comps imply.
- What's the recent tenant-quality profile in this submarket — average credit score on applications, eviction rate, late-payment / NSF rate, and stable-employment percentage? A property-management company in the area should have these aggregated.
- How much new for-sale + rental construction is in the pipeline within 1–3 miles? Heavy new supply typically softens prices + rents 12–24 months out; constrained supply supports both.
Investment metrics
- 1% rule
- 1.17% ✓
- Cap rate
- 9.75%
- Cash-on-cash
- 12.36%
- DSCR
- 1.55
- GRM
- 7.1
CMA / ARV
No comps found within radius.
Projected returns pro-forma
-3.0% appreciation · 3.0% rent growth · sell at horizon
- IRR
- 2.0%
- Equity multiple
- 1.08×
- Total profit
- $12,879
- Equity at exit
- $89,447
- IRR
- 11.6%
- Equity multiple
- 1.91×
- Total profit
- $152,729
- Equity at exit
- $51,868
Cash invested: $167,972 (down + closing). Projections, not guarantees.
Landlord ↔ Tenant lean methodology
- Overall (STATE)
- 41 Moderately Tenant-Leaning
- State Maine
- 41 Moderately Tenant-Leaning · D+2
- County
- — inherits STATE
- City
- — inherits STATE
ZIP-level market 04043
- Home prices YoY
- -21.4%
- Active inventory
- 132
- Price-to-rent
- 7.1×
Monthly cashflow live
- Estimated rent
- $7,039 medium interval (Pro) →
- Mortgage (P&I)
- −$3,146
- Tax from tax record
- −$435 /mo · $5,218/yr
- Insurance
- −$250
- HOA
- −$0
- Vacancy / Maint / Mgmt
- −$1,478
- Net cashflow
- $1,730
Break-even live
UW: 25.0% down · 7.5% · 30yr · 1.5% tax · 5.0% vac · 8.0% maint · 8.0% mgmt
Financing live
Cash to close
- Down payment
- $149,975
- Closing costs
- $17,997
- Reserves months
- —
- Total cash needed
- —
Loan-product check · same deal, 3 products live
Conventional
25% down · 7.5% · 30yr
- Down + closing
- —
- Monthly P&I
- —
- Monthly cashflow
- —
- DSCR
- —
- Eligible?
- —
Personal DTI + credit; lowest rate.
DSCR
20% down · 8.5% · 30yr
- Down + closing
- —
- Monthly P&I
- —
- Monthly cashflow
- —
- DSCR
- —
- Eligible?
- —
No personal income docs; deal must DSCR.
Hard money
10% down · 12.0% · 12mo
- Down + closing
- —
- Monthly P&I
- —
- Monthly cashflow
- —
- DSCR
- —
- Eligible?
- —
Short-term bridge; refi at stabilization.
Rent comps 2 comps
| Address | Beds | Baths | Sqft | Rent | $/sqft | DOM | Units | Dist |
|---|---|---|---|---|---|---|---|---|
| 18 Arundel Rd Unit 1532222P Arundel, ME | 2.0 | 1.0 | 990 | $7,432 | $7.51 | 21d | 1 | 1.06mi |
| 32 Log Cabin Rd Unit 1532201P Kennebunkport, ME | 2.0 | 1.0 | 1097 | $6,590 | $6.01 | 21d | 1 | 1.31mi |
Listing history 2 events
-
2026-06-18remarks 699-char remark
-
2026-06-18$599,900 Active 1 DOM
ⓘ Source: listings_history table (triggers on properties + properties_extension) + one-shot
backfill from property_details.listing_events for pre-trigger history.
Tax reassessment forecast ME · Partial reset (capped growth)
- Current annual tax
- $5,218 · $435/mo
- Projected year-2 tax
- $6,688 · $557/mo
- Expected delta
- +$1,470/yr (+$123/mo · 28.2%)
ⓘ Screening estimate from a state-policy table — verify with the county assessor before closing.
Climate risk First Street
- Flood 1/10 Low FEMA zone X · 0% chance over 30 yrs
- Wildfire 3/10 Moderate
- Heat 4/10 Moderate 7 d/yr ≥86°F today · 17 d/yr by 30 yrs out
- Wind 6/10 Major 67% chance of damaging wind over 30 yrs
- Air quality 2/10 Low 1 unhealthy d/yr today · 1 by 30 yrs out
Nearby sold comps map
Loading sold comps map…
Walkable amenities ~0.75 mi
Loading nearby amenities…
Taxation est. · year 1
- Rental income
- $84,465
- − Mortgage interest
- −$33,604
- − Property taxes
- −$5,218
- − Insurance
- −$3,000
- − Repairs & maintenance
- −$6,757
- − Management
- −$6,757
- − Depreciation
- −$17,452
- Taxable income
- $11,678
- Est. tax owed @ 24.0%
- −$2,803
- After-tax cash flow
- $17,956/yr
For passive investors: Depreciation is non-cash, so a rental often shows a tax loss while cash-flowing — sheltering income. Rental losses are passive: they offset passive income freely, and up to $25,000/yr can offset ordinary (W-2) income if you actively participate and your MAGI is under $100k (phasing out to $0 by $150k); unused losses carry forward. On sale, claimed depreciation is recaptured at up to 25%, and gains may owe capital-gains tax (a 1031 exchange can defer both). Figures are a year-1 estimate at your 24.0% rate — not tax advice; consult a CPA.
Schools (NCES district)
- District
- RSU 21
- NCES district ID
- 2314773
- Math proficiency
- 91% ▲ 34.00%
- Reading proficiency
- 94% ▲ 20.00%
- Median HH income
- $68,462
- Composite
- 79.78/100
- National rank
- #55
- State rank
- #13 of 112 in ME
Livability — Kennebunk
- Score
- 79/100
- State rank
- #20
- US rank
- #2049
Category grades
Schools grade is shown separately in the Schools card above.
Census & demographics
- Population (ZIP)
- 11,692
Population outlook (York County) Hauer SSP2
- Today (2025)
- 209,961 people
- By 2030
- 212,816 · +1.4%
- By 2040
- 214,360 · +2.1%
- By 2050
- 210,350 · +0.2%
- By 2075
- 201,686 · -3.9%
- By 2100
- 183,392 · -12.7%
Race, ethnicity, and origin ACS 2023
- Neighborhood character
- Predominantly White (94%)
- Race & ethnicity
- White 94% Hispanic / Latino 3% Two or more races 2% Asian 2%
- Common ancestry
- Lithuanian 8% Slovak 5% Serbian 3%
- Foreign-born
- 8% · Canada, Vietnam
- Languages at home
- 95% English-only · French/Haitian/Cajun 2% Spanish 2% German/W. Germanic 1%
Political lean MEDSL · York
- 2024 margin
- D (+10.5) · D 54.3% · R 43.8% · Other 1.9%
- 2008→2024 swing
- -10.1pp toward R · 2008: 20.5pp · 2024: 10.5pp
- All cycles
- 2024: D+10.5 2020: D+12.6 2016: D+4.8 2012: D+16.4 2008: D+20.5
Not yet ingested
- Civics
- —
Market trends
- HPI YoY
- ▼ -108.54%
- Current HPI
- 398.495
- Rent YoY
- —
- Metro
- —
- State GDP YoY
- —
- F500 in state
- 0
Price history
+1614.0% since first listed2 events — show timeline
- 2026-06-18 Listed $599,900 MREIS
- 2001-10-16 Sold (Public Records) $35,000 Public Records
Property tax history
+6.1%/yrLatest (2025): $5,218 · +28.2% YoY. Source: county tax records.
Cash-flow waterfall
monthlySold comps — $/sqft
last 12 mo · ≤1 miLoading sold comps…