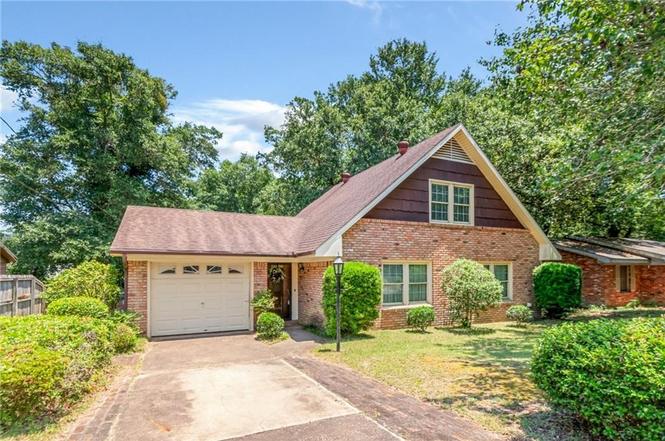
324 Syracuse St · Mobile, AL
Flood risk 1/10 · Minimal
- FEMA flood zone
- X (unshaded)
- Chance of flooding over 30 yrs
- 0.0%
- Est. flood insurance / yr
- $507 – $1,088
Fire risk 3/10 · Minor
- Est. fire insurance / yr
- $916 – $1,700
Heat risk 9/10 · Severe
- Hot days now (above 104°F)
- 7 days/yr
- Hot days in 30 yrs
- 21 days/yr
Wind risk 9/10 · Severe
- Chance of severe wind over 30 yrs
- 99.0%
Air-quality risk 1/10 · Minimal
- Unhealthy air days now
- 0 days/yr
- Unhealthy air days in 30 yrs
- 0 days/yr
Risk factors via First Street. Map © Google.
Why this score? — see what drove the D grade
The composite is a weighted blend of 9 inputs, each scored 0–100. Each bar is that input's sub-score; the figure is the points it added to the 100-point composite (weight × sub-score).
- Cash flow +15.3/30.0
- ARV discount +7.7/15.0
- DSCR +4.7/10.0
- Rent growth +4.0/5.0
- Livability +3.8/5.0
- 1% rule +3.0/10.0
- Condition / age +2.5/5.0
- Schools +2.3/10.0
- Appreciation +0.0/10.0
$235,000
🖨 Deal sheet (PDF) 📄 Offer letter ✓ Due diligence
Listing remarks
Welcome to one of Mobile's most convenient locations! Situated directly across from the University of South Alabama and just minutes from Langan Park, the Mobile Tennis Center, Playhouse in the Park, the Mobile Museum of Art, USA Health, restaurants, and numerous places of worship. Step inside through the welcoming foyer. To the right, you'll find a spacious and versatile formal living room that could also serve as a formal dining room. The spacious family room features attractive wood laminate flooring, a corner ventless fireplace, and overlooks the kitchen, creating a comfortable gathering space for family and friends. The family room also has lovely french doors offering access and view
Key facts
- Wall oven
- Private backyard
- Formal living room
Tags
Property features AI
Exterior
- Parking: Attached garage; Garage faces front; Driveway parking; Level driveway; 2 total parking spaces (1 garage space)
- Utilities: Electricity available (110 volts); Natural gas available; Public sewer; Water available
- Home design: Single family residence; Residential property
- Construction: Built in 1964; Brick on all sides and wood siding exterior; Shingle roof; Slab foundation; Insulated windows
- Exterior features: Gas grill; Rain gutters; Back yard fencing; Property has a view
Interior
- Kitchen: Breakfast bar; Eat-in kitchen; Electric cooktop; Electric oven; Dishwasher; Refrigerator
- Bedrooms: 3 bedrooms
- Flooring: Carpet; Ceramic tile; Hardwood; Laminate
- Bathrooms: 2 full bathrooms
- Fireplace: Gas log fireplace with gas starter and ventless installation in family room
- Heating & cooling: Central heating (natural gas); Central air; Ceiling fan(s); Electric air filter
- Interior features: Double vanity; Walk-in closet(s); Open floorplan between dining and other living areas; View to family room
- Laundry & utility: Washer; Dryer; Gas water heater
Neighborhood map
What this means for you Summary
Snapshot
- This is a 3-bed/2.0-bath single-family listed at $235k.
Deal economics
- At list price, monthly cash flow is $86 ($1k/yr) — positive.
- The deal already cash-flows at list — no discount required.
- To meet the 1% rule (rent ≥ 1% of price), the offer needs to be $188k (19.9% below list).
- Recommended offer: $188k (19.9% below list) — sets the bar for 1% rule.
- Cap rate 6.7% vs local median 4.9% in Mobile — top-decile yield for the area; either an underpriced asset or a hidden risk that comps aren't pricing in. Stress-test before assuming the spread holds.
Location & tenants
- Location reads 75/100 on livability (#20 in AL, #4,262 nationally) — a middle-class / working-renter tenant base. Strengths: commute A+, cost of living A+, housing A+; Watch: crime F, employment D-.
- Mobile County (urban): math 15% / reading 39% proficiency, ranked #81 of 129 in AL (top 63%) — low school quality limits family demand, transient renter base, plan for 1-2y turnover; 67% free/reduced lunch — lower-income household profile, screen leases tightly.
- Zoned schools: Mary B Austin Elementary School (math 29% / reading 59%, grade F, #194 of 627 statewide, top 32%, 511 students, 51% FRL); Denton Magnet School of Technology (math 26% / reading 69%, grade C-, #32 of 257 statewide, top 12%, 314 students, 94% FRL); Mattie T Blount High School (math 2% / reading 3%, grade F, #291 of 305 statewide, top 100%, 1,176 students, 86% FRL).
- Market conditions: Rents rising fast (+6.2%/yr); 341 active listings in the ZIP; 14 comparable units currently listed for rent nearby; rentals at typical pace (median 23d on market — plan ~3-4 weeks tenant-placement turnaround); 1,678 units permitted in Mobile County in 2024 (264 in 5+ unit buildings).
- This rent runs 37% of the median local income ($61k/yr) — at the standard rent-burdened threshold; future hikes will face affordability resistance.
Forward outlook
- Local home prices are declining (-3.0%/yr); year-one equity from $2k of loan paydown is wiped out by about $7k of value loss. Plan a longer hold.
- Mobile County population projected to shrink 8% by 2050 — rents likely to lag national; underwrite the cash flow, not the appreciation.
Negotiation context
- Only 6 days on market — expect competitive offers; lowballing is unlikely to land.
Risks & watch-outs
- Climate carrying-cost: severe wind risk, 99% chance of damaging wind over 30y; extreme-heat days projected 7→21/yr by 2055 (HVAC capex compounding) — expect insurance premiums to compound above CPI over the hold.
Questions for the listing agent
- Built in 1964 — when were the roof, HVAC, electrical panel, plumbing, and water heater last replaced?
- Is there a deadline driving the sale (1031 exchange, divorce, estate, relocation)? That informs how much negotiation room exists.
- Schools are D-rated, which usually means shorter tenancies and higher turnover. Who's the typical renter profile here, and what's been the actual vacancy rate?
- Crime grade is F in this area — have there been break-ins, vandalism, or insurance claims at this property in the last 3 years? What carrier currently insures it and at what premium?
- The area grade is low — what's the realistic commute time and amenity access for the typical tenant pool here? Any planned neighborhood developments (good or bad) we should know about?
- What's the average days-on-market for RENTAL listings here right now (not sales)? A rising rental-DOM trend means longer vacancies and softer asking-rent achievability than the comps imply.
- What's the recent tenant-quality profile in this submarket — average credit score on applications, eviction rate, late-payment / NSF rate, and stable-employment percentage? A property-management company in the area should have these aggregated.
- How much new for-sale + rental construction is in the pipeline within 1–3 miles? Heavy new supply typically softens prices + rents 12–24 months out; constrained supply supports both.
Investment metrics
- 1% rule
- 0.80% ✗
- Cap rate
- 6.73%
- Cash-on-cash
- 1.56%
- DSCR
- 1.07
- GRM
- 10.4
CMA / ARV
- ARV (on-the-fly)
- $236,128
- Comps found
- 12
Show comp detail 12 sales within ~0.75 mi
| Address | Dist | Beds/Ba | Sqft | Sold | Price | $/sf | Match |
|---|---|---|---|---|---|---|---|
| 104 University Blvd N | 0.31mi | 3/2.0 | 1,525 (+1%) | 2mo | $150,000 | $98 | 82 |
| 312 Vanderbilt Dr | 0.20mi | 3/2.0 | 1,436 (-4%) | 3mo | $230,000 | $160 | 81 |
| 5516 Brightwood Ln | 0.15mi | 3/2.0 | 1,390 (-8%) | 1mo | $170,000 | $122 | 79 |
| 5405 Hilltop Dr N | 0.46mi | 3/2.0 | 1,415 (-6%) | 2mo | $229,600 | $162 | 67 |
| 204 Cosgrove Dr | 0.36mi | 3/2.0 | 1,376 (-8%) | 3mo | $219,000 | $159 | 66 |
| 54 University Blvd N | 0.35mi | 3/2.0 | 1,344 (-11%) | 1mo | $190,000 | $141 | 65 |
| 116 N University Blvd | 0.27mi | 4/2.0 (+1) | 1,350 (-10%) | 1mo | $225,000 | $167 | 65 |
| 209 Norden Dr E | 0.42mi | 3/2.0 | 1,284 (-15%) | 0mo | $247,900 | $193 | 56 |
| 113 Hilltop Dr E | 0.49mi | 4/2.0 (+1) | 1,625 (+8%) | 4mo | $250,000 | $154 | 56 |
| 105 Village Cir W | 0.71mi | 3/2.0 | 1,403 (-7%) | 1mo | $185,500 | $132 | 54 |
| 301 Azalea Cir | 0.50mi | 2/2.0 (-1) | 1,310 (-13%) | 2mo | $205,000 | $156 | 48 |
| 814 Nassau Dr | 0.71mi | 3/2.0 | 1,719 (+14%) | 4mo | $269,900 | $157 | 40 |
Match score weights: distance 35% · size 25% · config 20% · recency 20%. Top-matched comps best support the ARV.
Projected returns pro-forma
-3.0% appreciation · 6.15% rent growth · sell at horizon
- IRR
- -10.8%
- Equity multiple
- 0.60×
- Total profit
- $-26,572
- Equity at exit
- $35,039
- IRR
- 2.0%
- Equity multiple
- 1.16×
- Total profit
- $10,404
- Equity at exit
- $20,319
Cash invested: $65,800 (down + closing). Projections, not guarantees.
Landlord ↔ Tenant lean methodology
- Overall (STATE)
- 90 Strongly Landlord-Friendly
- State Alabama
- 90 Strongly Landlord-Friendly · R+15
- County
- — inherits STATE
- City
- — inherits STATE
ZIP-level market 36608
- Rents YoY
- 6.2%
- Active inventory
- 341
- Price-to-rent
- 10.4×
Monthly cashflow live
- Estimated rent
- $1,883 high interval (Pro) →
- Mortgage (P&I)
- −$1,232
- Tax from tax record
- −$71 /mo · $857/yr
- Insurance
- −$98
- HOA
- −$0
- Vacancy / Maint / Mgmt
- −$395
- Net cashflow
- $86
Break-even live
Sensitivity live
| Price | -10% $219 | -5% $152 | +0% $86 | +5% $19 | +10% $-47 |
|---|---|---|---|---|---|
| Rent | -10% $-63 | -5% $11 | +0% $86 | +5% $160 | +10% $234 |
| Rate | -1.0pp $204 | -0.5pp $146 | base $86 | +0.5pp $25 | +1.0pp $-37 |
UW: 25.0% down · 7.5% · 30yr · 1.5% tax · 5.0% vac · 8.0% maint · 8.0% mgmt
Financing live
Cash to close
- Down payment
- $58,750
- Closing costs
- $7,050
- Reserves months
- —
- Total cash needed
- —
Loan-product check · same deal, 3 products live
Conventional
25% down · 7.5% · 30yr
- Down + closing
- —
- Monthly P&I
- —
- Monthly cashflow
- —
- DSCR
- —
- Eligible?
- —
Personal DTI + credit; lowest rate.
DSCR
20% down · 8.5% · 30yr
- Down + closing
- —
- Monthly P&I
- —
- Monthly cashflow
- —
- DSCR
- —
- Eligible?
- —
No personal income docs; deal must DSCR.
Hard money
10% down · 12.0% · 12mo
- Down + closing
- —
- Monthly P&I
- —
- Monthly cashflow
- —
- DSCR
- —
- Eligible?
- —
Short-term bridge; refi at stabilization.
Rent comps 14 comps
| Address | Beds | Baths | Sqft | Rent | $/sqft | DOM | Units | Dist |
|---|---|---|---|---|---|---|---|---|
| 316 Syracuse St Mobile, AL | 3.0 | 2.0 | 1776 | $1,875 | $1.06 | 15d | 1 | 0.04mi |
| 304 N University Blvd Unit 1043721P Mobile, AL | 4.0 | 2.5 | 1496 | $4,148 | $2.77 | 23d | 1 | 0.10mi |
| 5213 Pineview Ln S Mobile, AL | 3.0 | 1.0 | 1176 | $1,575 | $1.34 | 45d | 1 | 0.55mi |
| 5207 Azalea Cir S Mobile, AL | 3.0 | 2.0 | 1100 | $1,490 | $1.35 | 23d | 1 | 0.56mi |
| 112 S University Blvd Mobile, AL | 4.0 | 4.5 | 1472 | $1,810 | $1.23 | 15d | 5 | 0.70mi |
| 6016 Magnolia Pl E Mobile, AL | 3.0 | 2.0 | 1600 | $1,800 | $1.12 | 45d | 1 | 0.93mi |
| 912 Wendover Rd Unit 1043703P Mobile, AL | 4.0 | 2.5 | 1496 | $3,190 | $2.13 | 23d | 1 | 0.94mi |
| 5477 Ardell Dr Unit 1043691P Mobile, AL | 3.0 | 2.0 | 1496 | $2,680 | $1.79 | 15d | 1 | 0.94mi |
| 5855 Woodvale Dr Mobile, AL | 3.0 | 1.5 | 1712 | $1,350 | $0.79 | 23d | 1 | 0.94mi |
| 5904 Saint Gallen Ave S Unit 1043743P Mobile, AL | 4.0 | 2.0 | 1496 | $3,719 | $2.49 | 23d | 1 | 1.14mi |
| 914 David Langan Dr E Mobile, AL | 3.0 | 1.0 | 1080 | $1,450 | $1.34 | 45d | 1 | 1.14mi |
| 4670 Rosewood Dr Mobile, AL | 3.0 | 2.0 | 1192 | $1,200 | $1.01 | 15d | 1 | 1.23mi |
| 1104 Garland St Mobile, AL | 3.0 | 1.0 | 1377 | $1,450 | $1.05 | 23d | 1 | 1.30mi |
| 6474B Cedar Bend Ct Mobile, AL | 2.0 | 2.0 | 1444 | $1,600 | $1.11 | 45d | 1 | 1.42mi |
Listing history 5 events
-
2026-06-21days on market $235,000 Active 6 DOM
-
2026-06-18days on market $235,000 Active 3 DOM
-
2026-06-17days on market $235,000 Active 2 DOM
-
2026-06-15remarks 699-char remark
-
2026-06-15$235,000 Active 1 DOM
ⓘ Source: listings_history table (triggers on properties + properties_extension) + one-shot
backfill from property_details.listing_events for pre-trigger history.
Tax reassessment forecast AL · Resets to sale price
- Current annual tax
- $857 · $71/mo
- Projected year-2 tax
- $964 · $80/mo
- Expected delta
- +$106/yr (+$9/mo · 12.4%)
ⓘ Screening estimate from a state-policy table — verify with the county assessor before closing.
Climate risk First Street
- Flood 1/10 Low FEMA zone X (unshaded) · 0% chance over 30 yrs
- Wildfire 3/10 Moderate
- Heat 9/10 Extreme 7 d/yr ≥104°F today · 21 d/yr by 30 yrs out
- Wind 9/10 Extreme 99% chance of damaging wind over 30 yrs
- Air quality 1/10 Low 0 unhealthy d/yr today · 0 by 30 yrs out
Nearby sold comps map
Loading sold comps map…
Walkable amenities ~0.75 mi
Loading nearby amenities…
Taxation est. · year 1
- Rental income
- $22,594
- − Mortgage interest
- −$13,164
- − Property taxes
- −$857
- − Insurance
- −$1,175
- − Repairs & maintenance
- −$1,808
- − Management
- −$1,808
- − Depreciation
- −$6,836
- Taxable loss
- −$3,053
- Est. tax savings @ 24.0%
- +$733
- After-tax cash flow
- $1,762/yr
For passive investors: Depreciation is non-cash, so a rental often shows a tax loss while cash-flowing — sheltering income. Rental losses are passive: they offset passive income freely, and up to $25,000/yr can offset ordinary (W-2) income if you actively participate and your MAGI is under $100k (phasing out to $0 by $150k); unused losses carry forward. On sale, claimed depreciation is recaptured at up to 25%, and gains may owe capital-gains tax (a 1031 exchange can defer both). Figures are a year-1 estimate at your 24.0% rate — not tax advice; consult a CPA.
Schools (NCES district)
- District
- Mobile County
- NCES district ID
- 0102370
- Math proficiency
- 15% ▼ -28.00%
- Reading proficiency
- 39% ▬ 0.00%
- Median HH income
- $42,455
- Composite
- 22.9/100
- National rank
- #8002
- State rank
- #81 of 129 in AL
Livability — Mobile
- Score
- 75/100
- State rank
- #20
- US rank
- #4262
Category grades
Schools grade is shown separately in the Schools card above.
Census & demographics
- Census place
- Mobile, AL
- County
- Mobile County · 246,577 people
- City population
- 205,729
- Metro
- Mobile, AL
- Population (ZIP)
- 38,890
- Household income
- $61,146
- Rent vs Own
- Severe rent burden
- 1823.0
Population outlook (Mobile County) Hauer SSP2
- Today (2025)
- 415,303 people
- By 2030
- 411,755 · -0.9%
- By 2040
- 399,670 · -3.8%
- By 2050
- 382,616 · -7.9%
- By 2075
- 337,353 · -18.8%
- By 2100
- 283,391 · -31.8%
Race, ethnicity, and origin ACS 2023
- Neighborhood character
- Diverse neighborhood (Simpson 0.56)
- Race & ethnicity
- White 56% Black 35% Two or more races 4% Hispanic / Latino 4% Asian 2%
- Common ancestry
- Lithuanian 3% Italian 2% Slovak 2%
- Foreign-born
- 4% · Canada
- Languages at home
- 95% English-only · Spanish 2% Arabic 1% Other Indo-European 1%
Political lean MEDSL · Mobile
- 2024 margin
- R (+16.4) · D 41.3% · R 57.7%
- 2008→2024 swing
- -7.7pp toward R · 2008: -8.7pp · 2024: -16.4pp
- All cycles
- 2024: R+16.4 2020: R+11.9 2016: R+13.9 2012: R+9.3 2008: R+8.7
Not yet ingested
- Civics
- —
Market trends
- HPI YoY
- ▼ -224.52%
- Current HPI
- 198.9469
- Rent YoY
- ▲ 6.15%
- Metro
- Mobile, AL
- State GDP YoY
- ▲ 2.94%
- F500 in state
- 4
Industry mix (Fortune 500 HQ in AL)
| Industry | F500 HQs | Revenue |
|---|---|---|
| Financial Services | 1 | $8B |
|
||
| Healthcare | 1 | $5B |
|
||
Price history
1 event — show timeline
- 2026-06-15 Listed $235,000 GCMLS AL
Property tax history
+4.9%/yrLatest (2025): $857 · +0.8% YoY. Source: county tax records.
Cash-flow waterfall
monthlySold comps — $/sqft
last 12 mo · ≤1 miLoading sold comps…