 Triplex
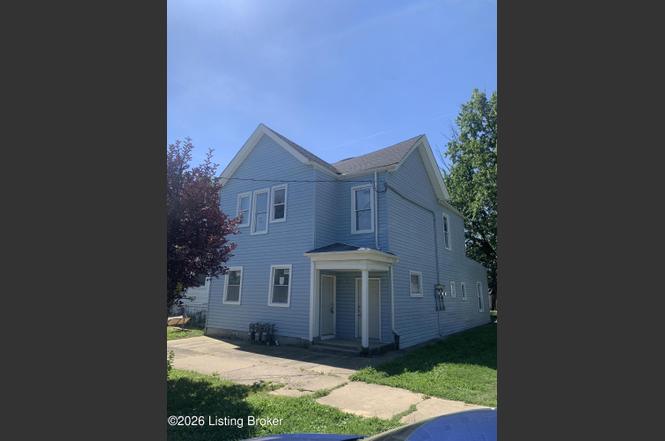
2202 Garland Ave · Louisville, KY
Flood risk 1/10 · Minimal
- FEMA flood zone
- X (unshaded)
- Chance of flooding over 30 yrs
- 0.0%
- Est. flood insurance / yr
- $473 – $860
Fire risk 1/10 · Minimal
- Est. fire insurance / yr
- $839 – $1,559
Heat risk 5/10 · Moderate
- Hot days now (above 105°F)
- 7 days/yr
- Hot days in 30 yrs
- 20 days/yr
Wind risk 2/10 · Minimal
- Chance of severe wind over 30 yrs
- 1.0%
Air-quality risk 2/10 · Minimal
- Unhealthy air days now
- 1 days/yr
- Unhealthy air days in 30 yrs
- 3 days/yr
Risk factors via First Street. Map © Google.
Why this score? — see what drove the B- grade
The composite is a weighted blend of 9 inputs, each scored 0–100. Each bar is that input's sub-score; the figure is the points it added to the 100-point composite (weight × sub-score).
- Cash flow +30.0/30.0
- 1% rule +10.0/10.0
- DSCR +10.0/10.0
- ARV discount +7.5/15.0
- Rent growth +3.7/5.0
- Livability +3.2/5.0
- Condition / age +2.5/5.0
- Schools +2.3/10.0
- Appreciation +0.0/10.0
$175,000
🖨 Deal sheet (PDF) 📄 Offer letter ✓ Due diligence
Multi-family units
County records classify this as Multi-Family (5+ Unit). Listing-text estimate: 3 units. estimate disagrees with records
5+ unit building — per-unit beds/baths from public records are typically unavailable; the breakdown below (if shown) is an estimate from the listing text.
Listing remarks MLS
All three units are currently rented. New windows in 2006. New insulation in 2007. New roof in 2011. Two apartments in the front, first and second floor, and one in the back on the first floor. Sold As Is Where Is with no warranties expressed or implied. Front bottom unit rents for $100 and owner pays water, front top unit rents for $325 and owner pays power and water. Back unit rents for $250 and owner pays water.
Key facts
- 4,456 sq ft lot
- Built 1910
- Listed 8 days
Property features AI
Finance
- HOA & community: No association fee
Exterior
- Parking: No covered parking
- Utilities: Utilities: Other
- Home design: Triplex; Main structure not in a flood plain
- Construction: Built in 1910; Wood frame construction; Asphalt roof
- Exterior features: See remarks (additional exterior details in remarks)
Interior
- Bedrooms: No bedrooms listed
- Interior features: Separate meters for units
Neighborhood map
What this means for you Summary
Snapshot
- This is a 3 × 2-bed/1.0-bath units multifamily listed at $175k.
Deal economics
- At list price, monthly cash flow is $2k ($20k/yr) — positive. Per door: $545/mo.
- The deal already cash-flows at list — no discount required.
- Meets the 1% rule at list price ($3k rent vs $175k).
- Cap rate 17.5% vs local median 5.0% in Louisville — top-decile yield for the area; either an underpriced asset or a hidden risk that comps aren't pricing in. Stress-test before assuming the spread holds.
Location & tenants
- Location reads 63/100 on livability (#333 in KY) — a middle-class / working-renter tenant base. Strengths: cost of living A+, housing A+; Watch: employment C-, health & safety D+, schools D-.
- Jefferson County (urban): math 19% / reading 35% proficiency, ranked #121 of 165 in KY (top 73%) — low school quality limits family demand, transient renter base, plan for 1-2y turnover.
- Market conditions: Rents rising fast (+4.9%/yr); 140 active listings in the ZIP; 40 comparable units currently listed for rent nearby; rentals at typical pace (median 24d on market — plan ~3-4 weeks tenant-placement turnaround); lower-income renter base — watch delinquency; 2,836 units permitted in Jefferson County in 2024 (1,558 in 5+ unit buildings).
- At $3,402/mo this rent would consume 129% of the median local household income ($32k/yr) (locally 1483% of renters already pay >50% of income on rent) — very limited rent-growth headroom before tenants either downsize or default.
Forward outlook
- Local home prices are declining (-3.0%/yr); year-one equity from $1k of loan paydown is wiped out by about $5k of value loss. Plan a longer hold.
- Jefferson County population projected at +13% by 2050 — modest demand growth; plan on rents tracking national, not racing it.
- At projected returns (-3.0% appreciation + 4.9% rent growth), your $49k cash investment doubles in ~3 years — after that, you're playing with house money.
Negotiation context
- Only 8 days on market — expect competitive offers; lowballing is unlikely to land.
- 8 sale attempts since 22y ago with the ask held roughly flat each time — persistent listings suggest the price (not the market) is what's stuck; bring a comps-based counter.
- Current owner paid $6k; list at $175k implies a 2592% gain — meaningful room to come down on a strong offer.
Risks & watch-outs
- Watch-outs: built in 1910 — expect roof / HVAC / electrical / plumbing capex.
- Climate carrying-cost: extreme-heat days projected 7→20/yr by 2055 (HVAC capex compounding) — expect insurance premiums to compound above CPI over the hold.
Questions for the listing agent
- Can we see the unit-by-unit rent roll, current vacancy, and any below-market leases? What's the average tenancy length?
- What capital expenditures (roof, boiler, parking lot, exteriors) have been made in the last 5 years, and what's planned in the next 2?
- Built in 1910 — when were the roof, HVAC, electrical panel, plumbing, and water heater last replaced?
- Is there a deadline driving the sale (1031 exchange, divorce, estate, relocation)? That informs how much negotiation room exists.
- Schools are D-rated, which usually means shorter tenancies and higher turnover. Who's the typical renter profile here, and what's been the actual vacancy rate?
- Crime grade is F in this area — have there been break-ins, vandalism, or insurance claims at this property in the last 3 years? What carrier currently insures it and at what premium?
- What's the average days-on-market for RENTAL listings here right now (not sales)? A rising rental-DOM trend means longer vacancies and softer asking-rent achievability than the comps imply.
- What's the recent tenant-quality profile in this submarket — average credit score on applications, eviction rate, late-payment / NSF rate, and stable-employment percentage? A property-management company in the area should have these aggregated.
- How much new apartment / multifamily construction is in the pipeline within 1–3 miles? Heavy new supply (>2% of stock underway) typically softens rents 12–24 months out; light construction supports rent growth.
Investment metrics
- 1% rule
- 1.94% ✓
- Cap rate
- 17.50%
- Cash-on-cash
- 40.03%
- DSCR
- 2.78
- GRM
- 4.3
CMA / ARV
No comps found within radius.
Show comp detail 8 sales within ~0.75 mi
| Address | Dist | Beds/Ba | Sqft | Sold | Price | $/sf | Match |
|---|---|---|---|---|---|---|---|
| 2612 W Kentucky St | 0.38mi | 3/2.0 | 1,379 | 15mo | $30,000 | $22 | 57 |
| 2317 Magazine St | 0.52mi | 3/2.0 | 2,330 | 8mo | $63,000 | $27 | 57 |
| 1000 S 28th St | 0.56mi | 5/2.5 | 2,178 | 10mo | $160,000 | $73 | 54 |
| 2009-2011 W Chestnut St | 0.60mi | 6/3.0 | 2,204 | 11mo | $184,750 | $84 | 50 |
| 1156 S 28th St | 0.71mi | 4/2.0 | 2,654 | 8mo | $82,000 | $31 | 48 |
| 527 S 20th St | 0.67mi | 8/4.0 | 4,000 | 11mo | $185,000 | $46 | 47 |
| 2228 W Madison St | 0.64mi | 5/1.0 | 1,979 | 20mo | $120,000 | $61 | 41 |
| 2615 Virginia Ave | 0.58mi | 12/6.0 | 5,940 | 24mo | $185,000 | $31 | 41 |
Match score weights: distance 35% · size 25% · config 20% · recency 20%. Top-matched comps best support the ARV.
Projected returns pro-forma
-3.0% appreciation · 4.87% rent growth · sell at horizon
- IRR
- 38.4%
- Equity multiple
- 2.68×
- Total profit
- $82,219
- Equity at exit
- $26,093
- IRR
- 45.7%
- Equity multiple
- 5.76×
- Total profit
- $233,257
- Equity at exit
- $15,131
Cash invested: $49,000 (down + closing). Projections, not guarantees.
Landlord ↔ Tenant lean methodology
- Overall (STATE)
- 83 Strongly Landlord-Friendly
- State Kentucky
- 83 Strongly Landlord-Friendly · R+16
- County
- — inherits STATE
- City
- — inherits STATE
ZIP-level market 40211
- Home prices YoY
- -33.4%
- Rents YoY
- 4.9%
- Active inventory
- 140
- Price-to-rent
- 12.9×
Monthly cashflow live
- Estimated rent
- $3,402 high interval (Pro) →
- Mortgage (P&I)
- −$918
- Tax from tax record
- −$62 /mo · $750/yr
- Insurance
- −$73
- HOA
- −$0
- Vacancy / Maint / Mgmt
- −$714
- Net cashflow
- $1,634
Break-even live
Sensitivity live
| Price | -10% $1,734 | -5% $1,684 | +0% $1,634 | +5% $1,585 | +10% $1,535 |
|---|---|---|---|---|---|
| Rent | -10% $1,366 | -5% $1,500 | +0% $1,634 | +5% $1,769 | +10% $1,903 |
| Rate | -1.0pp $1,723 | -0.5pp $1,679 | base $1,634 | +0.5pp $1,589 | +1.0pp $1,543 |
3-unit breakdown (identical units grouped — click to expand)
| Units | Beds | Baths | Est. rent |
|---|---|---|---|
| 3× units | 2 | 1 | $3,402 |
| #1 | 2 | 1 | $1,134 |
| #2 | 2 | 1 | $1,134 |
| #3 | 2 | 1 | $1,134 |
| Total (3 units) | $3,402 | ||
UW: 25.0% down · 7.5% · 30yr · 1.5% tax · 5.0% vac · 8.0% maint · 8.0% mgmt
Financing live
Cash to close
- Down payment
- $43,750
- Closing costs
- $5,250
- Reserves months
- —
- Total cash needed
- —
Loan-product check · same deal, 3 products live
Conventional
25% down · 7.5% · 30yr
- Down + closing
- —
- Monthly P&I
- —
- Monthly cashflow
- —
- DSCR
- —
- Eligible?
- —
Personal DTI + credit; lowest rate.
DSCR
20% down · 8.5% · 30yr
- Down + closing
- —
- Monthly P&I
- —
- Monthly cashflow
- —
- DSCR
- —
- Eligible?
- —
No personal income docs; deal must DSCR.
Hard money
10% down · 12.0% · 12mo
- Down + closing
- —
- Monthly P&I
- —
- Monthly cashflow
- —
- DSCR
- —
- Eligible?
- —
Short-term bridge; refi at stabilization.
Rent comps 40 comps
| Address | Beds | Baths | Sqft | Rent | $/sqft | DOM | Units | Dist |
|---|---|---|---|---|---|---|---|---|
| 848 S 23rd St Louisville, KY | 3.0 | 1.5 | 1050 | $1,450 | $1.38 | 24d | 1 | 0.12mi |
| 1847 W Kentucky St Louisville, KY | 2.0 | 1.0 | 1368 | $895 | $0.65 | 4d | 1 | 0.15mi |
| 2416 Garland Ave Louisville, KY | 3.0 | 2.0 | 1172 | $1,600 | $1.37 | 24d | 1 | 0.24mi |
| 2513 Date St Unit 2 Louisville, KY | 1.0 | 1.0 | 700 | $745 | $1.06 | 3d | 1 | 0.30mi |
| 1723 W Kentucky St Unit 3 Louisville, KY | 3.0 | 1.0 | 1200 | $1,300 | $1.08 | 24d | 1 | 0.35mi |
| 2310 W Broadway Unit 1 Louisville, KY | 1.0 | 1.0 | 1100 | $975 | $0.89 | 3d | 1 | 0.35mi |
| 1644 W Kentucky St Unit 3 Louisville, KY | 3.0 | 1.0 | 900 | $950 | $1.06 | 24d | 1 | 0.40mi |
| 2634 Garland Ave Unit B Louisville, KY | 3.0 | 1.0 | 1152 | $895 | $0.78 | 21d | 1 | 0.44mi |
| 2634 Garland Ave Unit A Louisville, KY | 3.0 | 1.0 | 1152 | $940 | $0.82 | 24d | 1 | 0.44mi |
| 1148 S 17th St Unit 2 Louisville, KY | 3.0 | 1.0 | 1000 | $895 | $0.90 | 24d | 1 | 0.47mi |
| 2411 Elliott Ave Louisville, KY | 2.0 | 1.0 | 892 | $895 | $1.00 | 24d | 1 | 0.48mi |
| 1705 1/2 Hale Ave Louisville, KY | 3.0 | 2.0 | 1257 | $1,400 | $1.11 | 11d | 1 | 0.48mi |
| 2711 W Kentucky St Louisville, KY | 3.0 | 1.0 | 1155 | $1,100 | $0.95 | 24d | 1 | 0.49mi |
| 2710 W Kentucky St Apt 2 Louisville, KY | 3.0 | 1.0 | 1015 | $1,300 | $1.28 | 24d | 1 | 0.50mi |
| 2115 Dumesnil St Louisville, KY | 2.0 | 1.0 | — | $1,075 | — | 24d | 1 | 0.51mi |
| 2724 Garland Ave Unit 202 Louisville, KY | 2.0 | 1.0 | 950 | $745 | $0.78 | 4d | 1 | 0.52mi |
| 1713 W Oak St Louisville, KY | 2.0 | 1.0 | — | $1,000 | — | 24d | 1 | 0.52mi |
| 2708 Greenwood Ave Apt 1 Louisville, KY | 3.0 | 1.0 | 1100 | $1,300 | $1.18 | 24d | 1 | 0.52mi |
| 1616 Gallagher St Louisville, KY | 3.0 | 1.5 | 1056 | $1,400 | $1.33 | 24d | 1 | 0.55mi |
| 2322 W Chestnut St Louisville, KY | 3.0 | 2.0 | — | $1,200 | — | 22d | 1 | 0.57mi |
| 2322 W Chestnut St Unit 3 Louisville, KY | 3.0 | 2.0 | — | $1,200 | — | 4d | 1 | 0.57mi |
| 1810 Magazine St Louisville, KY | 3.0 | 1.5 | 1248 | $1,450 | $1.16 | 11d | 1 | 0.57mi |
| 1854 W Ormsby Ave Louisville, KY | 2.0 | 2.0 | 1094 | $800 | $0.73 | 16d | 1 | 0.59mi |
| 2706 Hale Ave Unit 2 Louisville, KY | 2.0 | 1.0 | 900 | $1,250 | $1.39 | 24d | 1 | 0.61mi |
| 2706 Hale Ave Unit 1 Louisville, KY | 3.0 | 1.0 | 1100 | $1,400 | $1.27 | 24d | 1 | 0.61mi |
| 2003 Wilson Ave Louisville, KY | 1.0 | 1.0 | — | $950 | — | 16d | 1 | 0.62mi |
| 2614 Virginia Ave Louisville, KY | 2.0 | 1.0 | 975 | $925 | $0.95 | 24d | 1 | 0.62mi |
| 1309 Dixie Hwy Louisville, KY | 1.0 | 1.0 | — | $600 | — | 24d | 1 | 0.63mi |
| 725 S 16th St Louisville, KY | 2.0 | 1.0 | — | $800 | — | 4d | 1 | 0.63mi |
| 2821 Greenwood Ave #1 Louisville, KY | 3.0 | 1.0 | 1113 | $1,300 | $1.17 | 24d | 1 | 0.64mi |
| 1303 S 26th St Louisville, KY | 3.0 | 1.0 | — | $1,300 | — | 4d | 1 | 0.64mi |
| 1700 Magazine St Unit 3 Louisville, KY | 2.0 | 1.0 | 900 | $1,150 | $1.28 | 17d | 1 | 0.64mi |
| 2825 Greenwood Ave #2 Louisville, KY | 2.0 | 1.0 | 1300 | $995 | $0.77 | 24d | 1 | 0.65mi |
| 2825 Greenwood Ave #4 Louisville, KY | 3.0 | 1.0 | 1440 | $1,250 | $0.87 | 24d | 1 | 0.65mi |
| 2300 W Madison St Louisville, KY | 2.0 | 1.0 | 900 | $850 | $0.94 | 24d | 1 | 0.65mi |
| 527 S 20th St Unit 1 Louisville, KY | 2.0 | 1.0 | — | $850 | — | 24d | 1 | 0.66mi |
| 2733 Chase Ct Louisville, KY | 2.0 | 1.0 | 900 | $900 | $1.00 | 16d | 1 | 0.66mi |
| 1934 W Madison St Louisville, KY | 3.0 | 2.0 | — | $900 | — | 24d | 1 | 0.66mi |
| 2221 W Madison St Louisville, KY | 2.0 | 1.0 | 1000 | $1,350 | $1.35 | 22d | 1 | 0.67mi |
| 2221 W Madison St Louisville, KY | 3.0 | 1.0 | 1000 | $1,350 | $1.35 | 24d | 1 | 0.67mi |
Listing history 6 events
-
2026-06-18days on market $175,000 Active 8 DOM
-
2026-06-17days on market $175,000 Active 7 DOM
-
2026-06-16days on market $175,000 Active 6 DOM
-
2026-06-15days on market $175,000 Active 5 DOM
-
2026-06-13remarks 56-char remark
-
2026-06-13$175,000 Active 3 DOM
ⓘ Source: listings_history table (triggers on properties + properties_extension) + one-shot
backfill from property_details.listing_events for pre-trigger history.
Tax reassessment forecast KY · Resets to sale price
- Current annual tax
- $750 · $62/mo
- Projected year-2 tax
- $1,505 · $125/mo
- Expected delta
- +$755/yr (+$63/mo · 100.8%)
ⓘ Screening estimate from a state-policy table — verify with the county assessor before closing.
Climate risk First Street
- Flood 1/10 Low FEMA zone X (unshaded) · 0% chance over 30 yrs
- Wildfire 1/10 Low
- Heat 5/10 Major 7 d/yr ≥105°F today · 20 d/yr by 30 yrs out
- Wind 2/10 Low 100% chance of damaging wind over 30 yrs
- Air quality 2/10 Low 1 unhealthy d/yr today · 3 by 30 yrs out
Nearby sold comps map
Loading sold comps map…
Walkable amenities ~0.75 mi
Loading nearby amenities…
Taxation est. · year 1
- Rental income
- $40,824
- − Mortgage interest
- −$9,803
- − Property taxes
- −$750
- − Insurance
- −$875
- − Repairs & maintenance
- −$3,266
- − Management
- −$3,266
- − Depreciation
- −$5,091
- Taxable income
- $17,774
- Est. tax owed @ 24.0%
- −$4,266
- After-tax cash flow
- $15,348/yr
For passive investors: Depreciation is non-cash, so a rental often shows a tax loss while cash-flowing — sheltering income. Rental losses are passive: they offset passive income freely, and up to $25,000/yr can offset ordinary (W-2) income if you actively participate and your MAGI is under $100k (phasing out to $0 by $150k); unused losses carry forward. On sale, claimed depreciation is recaptured at up to 25%, and gains may owe capital-gains tax (a 1031 exchange can defer both). Figures are a year-1 estimate at your 24.0% rate — not tax advice; consult a CPA.
Schools (NCES district)
- District
- Jefferson County
- NCES district ID
- 2102990
- Math proficiency
- 19% ▼ -17.00%
- Reading proficiency
- 35% ▼ -11.00%
- Median HH income
- $47,885
- Composite
- 23.45/100
- National rank
- #7884
- State rank
- #121 of 165 in KY
Livability — Louisville
- Score
- 63/100
- State rank
- #333
- US rank
- #15887
Category grades
Schools grade is shown separately in the Schools card above.
Census & demographics
- Census place
- Louisville, KY
- County
- Jefferson County · 790,184 people
- City population
- 769,292
- Metro
- Louisville/Jefferson County, KY-IN
- Population (ZIP)
- 20,407
- Household income
- $31,749
- Rent vs Own
- Severe rent burden
- 1483.0
Population outlook (Jefferson County) Hauer SSP2
- Today (2025)
- 823,112 people
- By 2030
- 849,343 · +3.2%
- By 2040
- 895,696 · +8.8%
- By 2050
- 933,630 · +13.4%
- By 2075
- 1,028,262 · +24.9%
- By 2100
- 1,072,675 · +30.3%
Race, ethnicity, and origin ACS 2023
- Neighborhood character
- Predominantly Black (90%)
- Race & ethnicity
- Black 90% White 5% Two or more races 4% Hispanic / Latino 1%
- Common ancestry
- Italian 1%
- Foreign-born
- 1% · Canada
- Languages at home
- 98% English-only · Spanish 1%
Political lean MEDSL · Jefferson
- 2024 margin
- D (+16.6) · D 57.4% · R 40.9% · Other 1.7%
- 2008→2024 swing
- +4.5pp toward D · 2008: 12.0pp · 2024: 16.6pp
- All cycles
- 2024: D+16.6 2020: D+20.1 2016: D+13.3 2012: D+11.1 2008: D+12.0
Not yet ingested
- Civics
- —
Market trends
- HPI YoY
- ▼ -88.22%
- Current HPI
- 176.337
- Rent YoY
- ▲ 4.87%
- Metro
- Louisville/Jefferson County, KY-IN
- State GDP YoY
- ▲ 1.81%
- F500 in state
- 4
Industry mix (Fortune 500 HQ in KY)
| Industry | F500 HQs | Revenue |
|---|---|---|
| Healthcare | 1 | $118B |
|
||
| Food / Beverage | 1 | $7B |
|
||
Price history
+169.2% since first listed21 events — show timeline
- 2026-06-09 Listed $175,000 Metro Search MLS
- 2023-05-09 Listing Removed — Metro Search MLS
- 2022-09-25 Relisted — Metro Search MLS
- 2022-09-25 Price Changed $85,000 Metro Search MLS
- 2022-09-25 Price Changed $105,000 Metro Search MLS
- 2022-09-25 Price Changed $85,000 Metro Search MLS
- 2022-09-08 Pending — Metro Search MLS
- 2022-09-06 Relisted — Metro Search MLS
- 2022-09-06 Price Changed $110,000 Metro Search MLS
- 2022-09-05 Listing Removed — Metro Search MLS
- 2022-07-28 Listed $150,000 Metro Search MLS
- 2015-03-06 Sold (Public Records) $6,500 Public Records
- 2015-03-04 Sold (MLS) $6,500 Metro Search MLS
- 2014-12-16 Listed $20,000 Metro Search MLS
- 2010-10-08 Sold (Public Records) $24,000 Public Records
- 2009-06-30 Listing Removed — Metro Search MLS
- 2009-01-02 Listed $27,900 Metro Search MLS
- 2005-12-05 Sold (MLS) $10,000 Metro Search MLS
- 2005-06-12 Listed $34,900 Metro Search MLS
- 2005-03-30 Listing Removed — Metro Search MLS
- 2004-06-24 Listed $65,000 Metro Search MLS
Property tax history
+0.6%/yrLatest (2025): $750 · -1.9% YoY. Source: county tax records.
Cash-flow waterfall
monthlySold comps — $/sqft
last 12 mo · ≤1 miLoading sold comps…