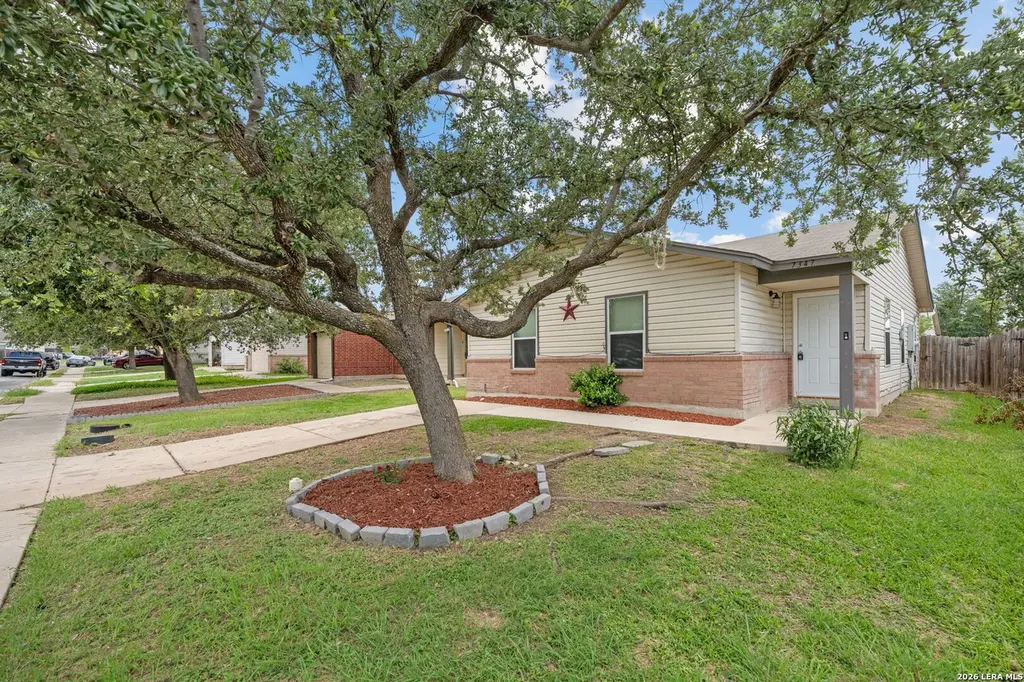
7347 Booker Bay · San Antonio, TX
Flood risk 1/10 · Minimal
- FEMA flood zone
- X (unshaded)
- Chance of flooding over 30 yrs
- 0.0%
- Est. flood insurance / yr
- $507 – $1,088
Fire risk 4/10 · Minor
- Est. fire insurance / yr
- $1,222 – $2,270
Heat risk 8/10 · Major
- Hot days now (above 108°F)
- 7 days/yr
- Hot days in 30 yrs
- 22 days/yr
Wind risk 8/10 · Major
- Chance of severe wind over 30 yrs
- 80.0%
Air-quality risk 1/10 · Minimal
- Unhealthy air days now
- 0 days/yr
- Unhealthy air days in 30 yrs
- 0 days/yr
Risk factors via First Street. Map © Google.
Why this score? — see what drove the D- grade
The composite is a weighted blend of 9 inputs, each scored 0–100. Each bar is that input's sub-score; the figure is the points it added to the 100-point composite (weight × sub-score).
- Cash flow +9.2/30.0
- ARV discount +5.1/15.0
- Appreciation +5.0/10.0
- Livability +4.0/5.0
- 1% rule +3.4/10.0
- DSCR +2.6/10.0
- Rent growth +2.5/5.0
- Condition / age +2.5/5.0
- Schools +2.4/10.0
$169,900
🖨 Deal sheet (PDF) 📄 Offer letter ✓ Due diligence
Listing remarks
Nice home near much shopping and HEB and Walmart. Close to both military bases. Ceramic tile throughout. No carpet. Newer stove 2023. HVAC & Ducts replaced 2023. Updated lights in hallway and utility/laundry room. New ceiling fans in 2nd and 3rd bedrooms, new blinds throughout 2026. Large back yard. Clean and Ready for move in.
Key facts
- Newer stove
- Hvac replaced
- New ceiling fans
Tags
Property features AI
Finance
- HOA & community: Mandatory HOA; HOA fee $220 annually; Association transfer fee $250; Subdivision: BRADBURY COURT
Exterior
- Security: Leased security system (pre-wired for security)
- Utilities: Water system; Electric water heater
- Home design: Pre-owned single-family home built by K B Home; Recent rehab
- Construction: Brick, siding and vinyl exterior with one-side masonry; Slab foundation; Composition roof; Approximately 23 years old
- Exterior features: Privacy fence; Mature trees; City view; Street paved with curbs, gutters and sidewalks on a city street
Interior
- Kitchen: Stove/Range; Dishwasher; Disposal
- Bedrooms: Master bedroom (lower level) with ceiling fan and full bath; Second bedroom; Third bedroom; Master bedroom dimensions approximately 13 x 11; Bedroom 2 dimensions approximately 10 x 10; Bedroom 3 dimensions approximately 10 x 10
- Flooring: Ceramic tile floors
- Bathrooms: Two full bathrooms; Master bath with tub/shower combination and single vanity; Master bath dimensions approximately 5 x 6
- Heating & cooling: Central heating (electric); Central air conditioning
- Interior features: Ceiling fans; Washer and dryer connections; Disposal; Dishwasher; Stove/Range; Smoke alarm; Leased security system (pre-wired for security); Electric water heater; Some window coverings remain; One living area
- Laundry & utility: Washer connection; Dryer connection; Utility room dimensions approximately 8 x 6
Neighborhood map
What this means for you Summary
Snapshot
- This is a 3-bed/1.0-bath single-family listed at $170k.
Deal economics
- At list price, monthly cash flow is $-126 ($-2k/yr) — negative.
- To cash-flow at today's rent, offer at most $148k (13.1% below list).
- To meet the 1% rule (rent ≥ 1% of price), the offer needs to be $143k (15.9% below list).
- Recommended offer: $143k (15.9% below list) — sets the bar for 1% rule.
- Cap rate 5.4% vs local median 3.8% in San Antonio — top-decile yield for the area; either an underpriced asset or a hidden risk that comps aren't pricing in. Stress-test before assuming the spread holds.
Location & tenants
- Location reads 80/100 on livability (#31 in TX, #1,616 nationally) — a professional / high-income tenant draw. Strengths: amenities A+, commute A+, cost of living A+; Watch: crime F.
- Judson ISD (suburban): math 21% / reading 33% proficiency, ranked #660 of 826 in TX (top 80%) — low school quality limits family demand, transient renter base, plan for 1-2y turnover.
- Zoned schools: Spring Meadows El (math 12% / reading 21%, grade F, #3,946 of 4,322 statewide, top 92%, 744 students, 80% FRL); Judson H S (math 19% / reading 38%, grade F, #1,157 of 1,632 statewide, top 72%, 2,666 students, 62% FRL).
- Market conditions: 1 active listings in the ZIP; 40 comparable units currently listed for rent nearby; rentals at typical pace (median 25d on market — plan ~3-4 weeks tenant-placement turnaround); 8,308 units permitted in Bexar County in 2024 (2,506 in 5+ unit buildings).
Forward outlook
- In year one you build about $6k of equity ($1k loan paydown + $5k appreciation (3.0% local appreciation)).
- Bexar County population projected at +50% by 2050 — long-run rental-demand tailwind backs the buy-and-hold thesis.
- By year 6, paydown + projected appreciation supports a ~$33k cash-out refi (75% LTV) — recoverable capital for the next deal without selling this one.
Negotiation context
- It's been on market 32 days — a 3% lower offer ($165k) is reasonable based on typical stale-listing flexibility.
Risks & watch-outs
- Climate carrying-cost: severe wind risk, 80% chance of damaging wind over 30y; extreme-heat days projected 7→22/yr by 2055 (HVAC capex compounding) — expect insurance premiums to compound above CPI over the hold.
Questions for the listing agent
- What do current leases actually rent for vs. the listed asking? Can we see a recent rent roll and the last 12 months of T-12 income?
- It's been on market 32 days. Have you received any prior offers? Is the seller open to a 16% concession, seller financing, or rate buy-down credit?
- What does the HOA fee cover, when was the last increase, and are there any pending special assessments or reserve-fund shortfalls?
- Is there a deadline driving the sale (1031 exchange, divorce, estate, relocation)? That informs how much negotiation room exists.
- Crime grade is F in this area — have there been break-ins, vandalism, or insurance claims at this property in the last 3 years? What carrier currently insures it and at what premium?
- The area grade is low — what's the realistic commute time and amenity access for the typical tenant pool here? Any planned neighborhood developments (good or bad) we should know about?
- What's the average days-on-market for RENTAL listings here right now (not sales)? A rising rental-DOM trend means longer vacancies and softer asking-rent achievability than the comps imply.
- What's the recent tenant-quality profile in this submarket — average credit score on applications, eviction rate, late-payment / NSF rate, and stable-employment percentage? A property-management company in the area should have these aggregated.
- How much new for-sale + rental construction is in the pipeline within 1–3 miles? Heavy new supply typically softens prices + rents 12–24 months out; constrained supply supports both.
Investment metrics
- 1% rule
- 0.84% ✗
- Cap rate
- 5.40%
- Cash-on-cash
- -3.18%
- DSCR
- 0.86
- GRM
- 9.9
CMA / ARV
- ARV (on-the-fly)
- $161,240
- Comps found
- 12
Show comp detail 12 sales within ~0.75 mi
| Address | Dist | Beds/Ba | Sqft | Sold | Price | $/sf | Match |
|---|---|---|---|---|---|---|---|
| 7207 Glen Pt | 0.65mi | 3/1.0 | 1,152 (-1%) | 6mo | $99,000 | $86 | 63 |
| 7322 Goya | 0.61mi | 3/2.0 | 1,156 (-0%) | 12mo | $150,000 | $130 | 57 |
| 7110 Glen Grv | 0.58mi | 3/2.0 | 1,226 (+6%) | 6mo | $170,000 | $139 | 55 |
| 7350 Rubens | 0.56mi | 3/2.0 | 1,186 (+2%) | 17mo | $129,900 | $110 | 52 |
| 7314 Montgomery Dr | 0.59mi | 3/2.0 | 1,205 (+4%) | 14mo | $200,000 | $166 | 50 |
| 7207 Glen Bay | 0.31mi | 2/1.0 (-1) | 1,024 (-12%) | 14mo | $100,000 | $98 | 49 |
| 7659 Glen Shire | 0.49mi | 3/2.0 | 1,250 (+8%) | 14mo | $199,975 | $160 | 49 |
| 7227 Sunlit Trl | 0.61mi | 3/2.0 | 1,267 (+9%) | 13mo | $140,000 | $110 | 42 |
| 7259 Sunlit Trl | 0.67mi | 3/2.0 | 1,268 (+9%) | 10mo | $210,000 | $166 | 41 |
| 7938 Corona Rdg | 0.64mi | 3/2.0 | 1,268 (+9%) | 15mo | $185,000 | $146 | 38 |
| 7959 Pepper Trl | 0.64mi | 3/2.0 | 1,268 (+9%) | 16mo | $205,000 | $162 | 37 |
| 7107 Glen Point Dr | 0.69mi | 4/1.5 (+1) | 1,298 (+12%) | 14mo | $120,000 | $92 | 29 |
Match score weights: distance 35% · size 25% · config 20% · recency 20%. Top-matched comps best support the ARV.
Projected returns pro-forma
3.0% appreciation · 3.0% rent growth · sell at horizon
- IRR
- 4.6%
- Equity multiple
- 1.26×
- Total profit
- $12,518
- Equity at exit
- $76,394
- IRR
- 7.7%
- Equity multiple
- 2.18×
- Total profit
- $55,928
- Equity at exit
- $117,733
Cash invested: $47,572 (down + closing). Projections, not guarantees.
Landlord ↔ Tenant lean methodology
- Overall (STATE)
- 87 Strongly Landlord-Friendly
- State Texas
- 87 Strongly Landlord-Friendly · R+5
- County
- — inherits STATE
- City
- — inherits STATE
ZIP-level market 78244-2279
- Active inventory
- 1
- Price-to-rent
- 9.9×
Monthly cashflow live
- Estimated rent
- $1,429 high interval (Pro) →
- Mortgage (P&I)
- −$891
- Tax from tax record
- −$275 /mo · $3,303/yr
- Insurance
- −$71
- HOA
- −$18
- Vacancy / Maint / Mgmt
- −$300
- Net cashflow
- $-126
Break-even live
Sensitivity live
| Price | -10% $-30 | -5% $-78 | +0% $-126 | +5% $-174 | +10% $-222 |
|---|---|---|---|---|---|
| Rent | -10% $-239 | -5% $-182 | +0% $-126 | +5% $-69 | +10% $-13 |
| Rate | -1.0pp $-40 | -0.5pp $-83 | base $-126 | +0.5pp $-170 | +1.0pp $-215 |
UW: 25.0% down · 7.5% · 30yr · 1.5% tax · 5.0% vac · 8.0% maint · 8.0% mgmt
Financing live
Cash to close
- Down payment
- $42,475
- Closing costs
- $5,097
- Reserves months
- —
- Total cash needed
- —
Loan-product check · same deal, 3 products live
Conventional
25% down · 7.5% · 30yr
- Down + closing
- —
- Monthly P&I
- —
- Monthly cashflow
- —
- DSCR
- —
- Eligible?
- —
Personal DTI + credit; lowest rate.
DSCR
20% down · 8.5% · 30yr
- Down + closing
- —
- Monthly P&I
- —
- Monthly cashflow
- —
- DSCR
- —
- Eligible?
- —
No personal income docs; deal must DSCR.
Hard money
10% down · 12.0% · 12mo
- Down + closing
- —
- Monthly P&I
- —
- Monthly cashflow
- —
- DSCR
- —
- Eligible?
- —
Short-term bridge; refi at stabilization.
Rent comps 40 comps
| Address | Beds | Baths | Sqft | Rent | $/sqft | DOM | Units | Dist |
|---|---|---|---|---|---|---|---|---|
| 7323 Booker Bay San Antonio, TX | 3.0 | 2.0 | 1388 | $1,495 | $1.08 | 44d | 1 | 0.05mi |
| 7223 Archers Coach San Antonio, TX | 3.0 | 2.0 | 1370 | $1,485 | $1.08 | 4d | 1 | 0.09mi |
| 7237 Glen Bay San Antonio, TX | 3.0 | 2.0 | 1400 | $1,050 | $0.75 | 44d | 1 | 0.24mi |
| 7507 Echo Trl San Antonio, TX | 3.0 | 2.0 | 1456 | $1,600 | $1.10 | 44d | 1 | 0.27mi |
| 7614 Glen Hurst San Antonio, TX | 3.0 | 1.0 | 1100 | $1,400 | $1.27 | 3d | 1 | 0.33mi |
| 7042 Glen Mist San Antonio, TX | 3.0 | 2.0 | 1284 | $950 | $0.74 | 44d | 1 | 0.36mi |
| 7114 Elm Trail Dr San Antonio, TX | 3.0 | 2.0 | 1332 | $1,600 | $1.20 | 44d | 1 | 0.40mi |
| 7222 Glen Hvn San Antonio, TX | 4.0 | 2.0 | 1320 | $1,350 | $1.02 | 25d | 1 | 0.44mi |
| 7134 Winding Draw San Antonio, TX | 3.0 | 2.0 | 1440 | $1,565 | $1.09 | 16d | 1 | 0.46mi |
| 7603 Glen Vis San Antonio, TX | 3.0 | 2.0 | 980 | $1,200 | $1.22 | 8d | 1 | 0.46mi |
| 7643 Glen Shire San Antonio, TX | 3.0 | 2.0 | 868 | $1,475 | $1.70 | 25d | 1 | 0.47mi |
| 7326 Glen Trl San Antonio, TX | 4.0 | 2.0 | 1370 | $1,549 | $1.13 | 4d | 1 | 0.49mi |
| 7318 Glen Trl San Antonio, TX | 3.0 | 2.0 | 1226 | $1,900 | $1.55 | 44d | 1 | 0.50mi |
| 7226 Winding Cloud San Antonio, TX | 3.0 | 2.0 | 1440 | $1,565 | $1.09 | 25d | 1 | 0.50mi |
| 7211 Winding Finger San Antonio, TX | 3.0 | 2.0 | 1440 | $1,515 | $1.05 | 44d | 1 | 0.53mi |
| 7810 Walzem Rd San Antonio, TX | 2.0–3.0 | 2.0 | 1052 | $1,251 | $1.19 | 2d | 1 | 0.54mi |
| 7107 Winding Shelf San Antonio, TX | 3.0 | 1.0 | 1016 | $1,408 | $1.39 | 25d | 1 | 0.54mi |
| 7919 Wayside Trl San Antonio, TX | 3.0 | 2.0 | 1453 | $1,400 | $0.96 | 44d | 1 | 0.55mi |
| 7011 Winding Shelf San Antonio, TX | 3.0 | 2.0 | 1266 | $1,449 | $1.14 | 5d | 1 | 0.60mi |
| 7135 Grassy Trl San Antonio, TX | 3.0 | 2.0 | 1422 | $2,000 | $1.41 | 44d | 1 | 0.62mi |
| 7006 Glen Grv San Antonio, TX | 3.0 | 2.0 | 1036 | $1,495 | $1.44 | 44d | 1 | 0.66mi |
| 7443 Longing Trl San Antonio, TX | 3.0 | 2.0 | 1487 | $1,495 | $1.01 | 13d | 1 | 0.67mi |
| 6811 Avila San Antonio, TX | 3.0 | 2.0 | 1260 | $1,555 | $1.23 | 21d | 1 | 0.69mi |
| 7904 Mallow San Antonio, TX | 3.0 | 2.0 | 1135 | $1,145 | $1.01 | 16d | 1 | 0.72mi |
| 8219 Glen Lark San Antonio, TX | 4.0 | 2.0 | 1260 | $1,250 | $0.99 | 23d | 1 | 0.78mi |
| 7858 Hedrick Farm San Antonio, TX | 3.0 | 2.5 | 1437 | $1,485 | $1.03 | 4d | 1 | 0.78mi |
| 7210 John Palmer Dr Unit 101 San Antonio, TX | 3.0 | 2.5 | 1426 | $1,650 | $1.16 | 17d | 1 | 0.80mi |
| 7210 John Palmer Dr Unit 101 San Antonio, TX | 3.0 | 2.5 | 1426 | $1,700 | $1.19 | 25d | 1 | 0.80mi |
| 7812 Broadwick San Antonio, TX | 2.0 | 1.0 | 884 | $1,075 | $1.22 | 18d | 1 | 0.81mi |
| 7809 Sarepto San Antonio, TX | 2.0 | 2.0 | 1152 | $950 | $0.82 | 25d | 1 | 0.81mi |
| 7138 Brecon San Antonio, TX | 3.0 | 2.5 | 1276 | $1,065 | $0.83 | 44d | 1 | 0.82mi |
| 7923 Langport San Antonio, TX | 3.0 | 2.0 | 1095 | $1,800 | $1.64 | 44d | 1 | 0.83mi |
| 7331 Glen Hts San Antonio, TX | 3.0 | 2.0 | 1184 | $1,390 | $1.17 | 25d | 1 | 0.89mi |
| 6918 Stockport San Antonio, TX | 3.0 | 2.0 | 1390 | $1,050 | $0.76 | 44d | 1 | 0.91mi |
| 7027 FM 78 San Antonio, TX | 1.0–3.0 | 1.0–2.0 | 868 | $2,351 | $2.71 | 21d | 10 | 0.99mi |
| 6814 Oldham San Antonio, TX | 3.0 | 2.0 | 1238 | $1,300 | $1.05 | 25d | 1 | 1.01mi |
| 7027 Farm-To-Market Road 78 Unit 9204 San Antonio, TX | 2.0 | 2.0 | 954 | $1,780 | $1.87 | 5d | 1 | 1.01mi |
| 7027 Farm to Market Road 78 Unit 710 San Antonio, TX | 2.0 | 2.0 | 881 | $1,123 | $1.27 | 4d | 1 | 1.01mi |
| 7027 Farm to Market Road 78 Unit 14203 San Antonio, TX | 2.0 | 1.0 | 881 | $1,580 | $1.79 | 4d | 1 | 1.01mi |
| 8304 Heights Vly Converse, TX | 3.0 | 2.0 | 1249 | $1,450 | $1.16 | 16d | 1 | 1.03mi |
HOA detail
- Monthly dues
- $18 · $216/yr
Listing history 16 events
-
2026-06-21days on market $169,900 Active 32 DOM
-
2026-06-18days on market $169,900 Active 29 DOM
-
2026-06-17days on market $169,900 Active 28 DOM
-
2026-06-16days on market $169,900 Active 27 DOM
-
2026-06-15days on market $169,900 Active 26 DOM
-
2026-06-13days on market $169,900 Active 24 DOM
-
2026-06-09days on market $169,900 Active 20 DOM
-
2026-06-08statusdays on market $169,900 Active 19 DOM
-
2026-06-07days on market $169,900 New 18 DOM
-
2026-06-04days on market $169,900 New 15 DOM
-
2026-06-03days on market $169,900 New 14 DOM
-
2026-06-02days on market $169,900 New 13 DOM
-
2026-06-01days on market $169,900 New 12 DOM
-
2026-05-31days on market $169,900 New 11 DOM
-
2026-05-21price $169,900
-
2026-05-20$1,699,000 New
ⓘ Source: listings_history table (triggers on properties + properties_extension) + one-shot
backfill from property_details.listing_events for pre-trigger history.
Tax reassessment forecast TX · Resets to sale price
- Current annual tax
- $3,303 · $275/mo
- Projected year-2 tax
- $3,303 · $275/mo
- Expected delta
- $0/yr ($0/mo · 0.0%)
ⓘ Screening estimate from a state-policy table — verify with the county assessor before closing.
Climate risk First Street
- Flood 1/10 Low FEMA zone X (unshaded) · 0% chance over 30 yrs
- Wildfire 4/10 Moderate
- Heat 8/10 Severe 7 d/yr ≥108°F today · 22 d/yr by 30 yrs out
- Wind 8/10 Severe 80% chance of damaging wind over 30 yrs
- Air quality 1/10 Low 0 unhealthy d/yr today · 0 by 30 yrs out
Nearby sold comps map
Loading sold comps map…
Walkable amenities ~0.75 mi
Loading nearby amenities…
Taxation est. · year 1
- Rental income
- $17,150
- − Mortgage interest
- −$9,517
- − Property taxes
- −$3,303
- − Insurance
- −$850
- − Repairs & maintenance
- −$1,372
- − Management
- −$1,372
- − HOA
- −$216
- − Depreciation
- −$4,943
- Taxable loss
- −$4,421
- Est. tax savings @ 24.0%
- +$1,061
- After-tax cash flow
- $-450/yr
For passive investors: Depreciation is non-cash, so a rental often shows a tax loss while cash-flowing — sheltering income. Rental losses are passive: they offset passive income freely, and up to $25,000/yr can offset ordinary (W-2) income if you actively participate and your MAGI is under $100k (phasing out to $0 by $150k); unused losses carry forward. On sale, claimed depreciation is recaptured at up to 25%, and gains may owe capital-gains tax (a 1031 exchange can defer both). Figures are a year-1 estimate at your 24.0% rate — not tax advice; consult a CPA.
Schools (NCES district)
- District
- Judson ISD
- NCES district ID
- 4824990
- Math proficiency
- 21% ▼ -21.00%
- Reading proficiency
- 33% ▼ -7.00%
- Median HH income
- $57,542
- Composite
- 24.39/100
- National rank
- #7689
- State rank
- #660 of 826 in TX
Livability — San Antonio
- Score
- 80/100
- State rank
- #31
- US rank
- #1616
Category grades
Schools grade is shown separately in the Schools card above.
Census & demographics
No demographic data for this ZIP.
Market trends
- HPI YoY
- —
- Current HPI
- —
- Rent YoY
- —
- Metro
- —
- State GDP YoY
- ▲ 3.95%
- F500 in state
- 110
Industry mix (Fortune 500 HQ in TX)
| Industry | F500 HQs | Revenue |
|---|---|---|
| Energy | 16 | $1,198B |
|
||
| Technology | 5 | $198B |
|
||
| Engineering / Construction | 4 | $72B |
|
||
| Energy Services | 3 | $60B |
|
||
| Utilities | 3 | $41B |
|
||
| Healthcare | 2 | $330B |
|
||
Price history
-90.0% since first listed2 events — show timeline
- 2026-05-21 Price Changed $169,900 LERA
- 2026-05-20 Listed $1,699,000 LERA
Property tax history
+13.7%/yrLatest (2025): $3,303 · +0.2% YoY. Source: county tax records.
Cash-flow waterfall
monthlySold comps — $/sqft
last 12 mo · ≤1 miLoading sold comps…