806 Crawford Ave · Augusta-Richmond County consolidated government (balance), GA
Flood risk 1/10 · Minimal
- FEMA flood zone
- X (unshaded)
- Chance of flooding over 30 yrs
- 0.0%
- Est. flood insurance / yr
- $507 – $1,088
Fire risk 1/10 · Minimal
- Est. fire insurance / yr
- $963 – $1,789
Heat risk 8/10 · Major
- Hot days now (above 108°F)
- 7 days/yr
- Hot days in 30 yrs
- 17 days/yr
Wind risk 6/10 · Moderate
- Chance of severe wind over 30 yrs
- 66.0%
Air-quality risk 4/10 · Minor
- Unhealthy air days now
- 4 days/yr
- Unhealthy air days in 30 yrs
- 4 days/yr
Risk factors via First Street. Map © Google.
Why this score? — see what drove the D grade
The composite is a weighted blend of 9 inputs, each scored 0–100. Each bar is that input's sub-score; the figure is the points it added to the 100-point composite (weight × sub-score).
- Cash flow +20.7/30.0
- DSCR +6.6/10.0
- 1% rule +4.8/10.0
- Rent growth +3.6/5.0
- Livability +2.5/5.0
- Condition / age +2.5/5.0
- Schools +1.3/10.0
- ARV discount +0.0/15.0
- Appreciation +0.0/10.0
$180,000
🖨 Deal sheet 📄 Offer letter ✓ Due diligence
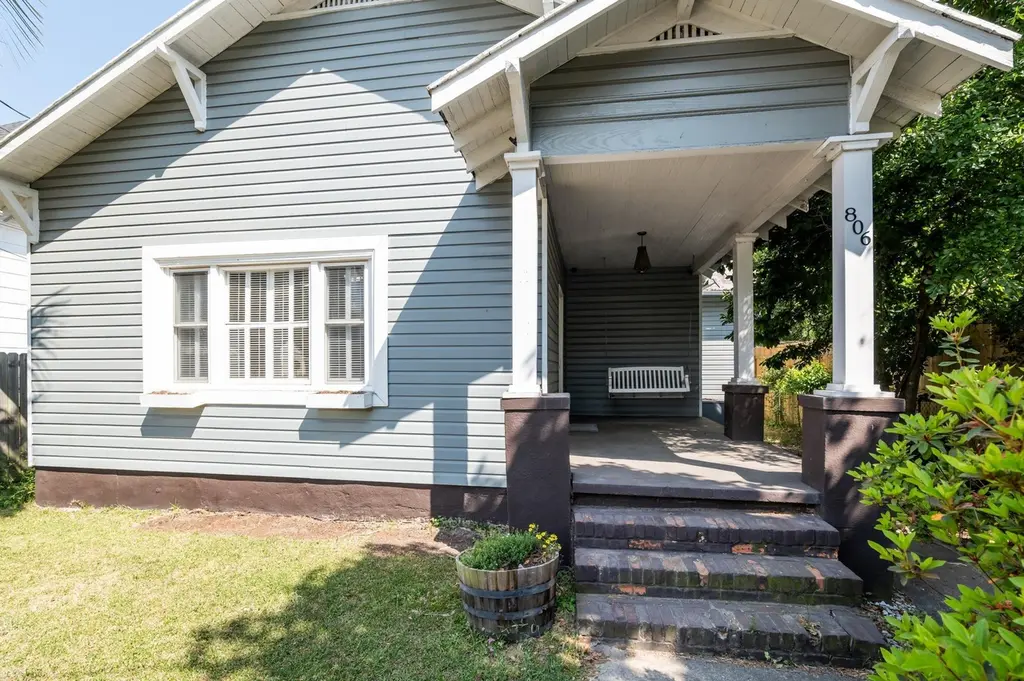
Listing remarks
Located in the heart of Harrisburg, just one block from Walton Way and minutes from Augusta's medical district, this historic home offers an unbeatable location close to everything downtown has to offer. This charming property blends classic character with modern updates, including newer windows and blinds, updated flooring, fresh paint, and a remodeled kitchen featuring stainless steel appliances. Both the electrical and plumbing systems have been updated throughout the home. The original bathroom preserves its timeless appeal with a classic clawfoot tub, while the second bathroom offers a more modern feel with a tub/shower combo and glass shower door. Inside, you'll find spacious rooms wi
Key facts
- Remodeled kitchen
- Newer windows
- Updated flooring
Tags
Property features AI
Finance
- Other: Subdivision: Harrisburg; Directions: Take Walton Way to Crawford Ave.; home on the right one block down from Walton Way.
- HOA & community: Sidewalks in the community
Exterior
- Parking: Carport (1 space); Detached parking; Other parking (see remarks)
- Utilities: Public water; Public sewer; Sewer connected; Water connected
- Home design: Single-family residence; One story; Entry on level 1; R1 zoning
- Construction: Aluminum siding and wood siding over frame construction; Metal roof; Crawl space / no basement
- Exterior features: Deck; Front porch; Fenced yard; Has a view; Landscaped lot; Other lot features (see remarks)
Interior
- Kitchen: Refrigerator; Range; Dishwasher
- Bedrooms: 6 total rooms (bedroom count not specified)
- Flooring: Vinyl; Hardwood
- Bathrooms: 2 full bathrooms
- Heating & cooling: Central air; Ceiling fans; Electric heating; Forced air; Natural gas heating
- Interior features: Built-in features; Window coverings
- Laundry & utility: No specific laundry appliances listed
Neighborhood map
What this means for you Summary
Snapshot
- This is a 4-bed/1.0-bath single-family listed at $180k.
Deal economics
- At list price, monthly cash flow is $244 ($3k/yr) — positive.
- The deal already cash-flows at list — no discount required.
- To meet the 1% rule (rent ≥ 1% of price), the offer needs to be $177k (1.7% below list).
- Recommended offer: $175k (3.0% below list) — sets the bar for market timing.
- Cap rate 7.9% vs local median 5.3% in Augusta-Richmond County consolidated government (balance) — top-decile yield for the area; either an underpriced asset or a hidden risk that comps aren't pricing in. Stress-test before assuming the spread holds.
Location & tenants
- Location reads: area grade D — affects rentability + tenant quality, not the cash-flow math above.
- Richmond County (urban): math 12% / reading 20% proficiency, ranked #154 of 174 in GA (top 88%) — low school quality limits family demand, transient renter base, plan for 1-2y turnover; 72% free/reduced lunch — lower-income household profile, screen leases tightly.
- Zoned schools: Lamar - Milledge Elementary School (math 12% / reading 12%, grade F, #1,041 of 1,228 statewide, top 87%, 301 students, 98% FRL); W.S. Hornsby Middle School (math 2% / reading 5%, grade F, #468 of 470 statewide, top 100%, 399 students, 98% FRL) — zoned schools average 98% FRL vs 72% district-wide (26 pts higher); higher-poverty schools than district average — tighter screening recommended.
- Market conditions: Rents rising fast (+4.3%/yr); 222 active listings in the ZIP; 16 comparable units currently listed for rent nearby; rentals at typical pace (median 23d on market — plan ~3-4 weeks tenant-placement turnaround); 44% of comp listings sitting > 30 days — soft ceiling on asking rent; 561 units permitted in Richmond County in 2024 (0 in 5+ unit buildings).
- At $1,769/mo this rent would consume 45% of the median local household income ($47k/yr) (locally 1594% of renters already pay >50% of income on rent) — very limited rent-growth headroom before tenants either downsize or default.
Forward outlook
- Local home prices are declining (-3.0%/yr); year-one equity from $1k of loan paydown is wiped out by about $5k of value loss. Plan a longer hold.
- Richmond County population projected to shrink 5% by 2050 — rents likely to lag national; underwrite the cash flow, not the appreciation.
Negotiation context
- It's been on market 38 days — a 3% lower offer ($175k) is reasonable based on typical stale-listing flexibility.
- 6 sale attempts since 20y ago with the ask held roughly flat each time — persistent listings suggest the price (not the market) is what's stuck; bring a comps-based counter.
- Current owner paid $44k; list at $180k implies a 314% gain — meaningful room to come down on a strong offer.
Risks & watch-outs
- Watch-outs: built in 1919 — expect roof / HVAC / electrical / plumbing capex.
- Climate carrying-cost: major wind risk, 66% chance of damaging wind over 30y; extreme-heat days projected 7→17/yr by 2055 (HVAC capex compounding) — expect insurance premiums to compound above CPI over the hold.
Questions for the listing agent
- It's been on market 38 days. Have you received any prior offers? Is the seller open to a 3% concession, seller financing, or rate buy-down credit?
- Built in 1919 — when were the roof, HVAC, electrical panel, plumbing, and water heater last replaced?
- Is there a deadline driving the sale (1031 exchange, divorce, estate, relocation)? That informs how much negotiation room exists.
- The area grade is low — what's the realistic commute time and amenity access for the typical tenant pool here? Any planned neighborhood developments (good or bad) we should know about?
- What's the average days-on-market for RENTAL listings here right now (not sales)? A rising rental-DOM trend means longer vacancies and softer asking-rent achievability than the comps imply.
- What's the recent tenant-quality profile in this submarket — average credit score on applications, eviction rate, late-payment / NSF rate, and stable-employment percentage? A property-management company in the area should have these aggregated.
- How much new for-sale + rental construction is in the pipeline within 1–3 miles? Heavy new supply typically softens prices + rents 12–24 months out; constrained supply supports both.
Investment metrics
- 1% rule
- 0.98% ✗
- Cap rate
- 7.92%
- Cash-on-cash
- 5.82%
- DSCR
- 1.26
- GRM
- 8.5
CMA / ARV
- ARV (median comp)
- $145,966
- List price
- $180,000
- Delta
- 23.32%
- Verdict
- OVERPRICED
- Comps
- 20 within 1.0 mi
Show comp detail 12 sales within ~0.75 mi
| Address | Dist | Beds/Ba | Sqft | Sold | Price | $/sf | Match |
|---|---|---|---|---|---|---|---|
| 807 Crawford Ave | 0.03mi | 3/2.0 (-1) | 1,830 (+6%) | 10mo | $195,000 | $107 | 71 |
| 930 Heard Ave | 0.67mi | 3/2.0 (-1) | 1,688 (-2%) | 2mo | $310,000 | $184 | 55 |
| 1940 Telfair St | 0.46mi | 3/2.0 (-1) | 1,825 (+6%) | 9mo | $135,000 | $74 | 53 |
| 2064 Ellis St | 0.71mi | 4/2.0 | 1,822 (+5%) | 6mo | $125,000 | $69 | 48 |
| 812 Russell St | 0.49mi | 3/2.0 (-1) | 1,523 (-12%) | 2mo | $292,500 | $192 | 47 |
| 946 Russell St | 0.67mi | 3/1.0 (-1) | 1,564 (-10%) | 2mo | $266,000 | $170 | 46 |
| 1210 Murphy St | 0.62mi | 3/2.5 (-1) | 1,862 (+8%) | 5mo | $125,000 | $67 | 43 |
| 1818 Hampton Ave | 0.58mi | 4/1.0 | 1,482 (-14%) | 10mo | $125,400 | $85 | 41 |
| 707 Hickman Rd | 0.66mi | 3/3.5 (-1) | 1,851 (+7%) | 2mo | $424,500 | $229 | 41 |
| 1931 Telfair St | 0.44mi | 3/2.5 (-1) | 1,472 (-15%) | 9mo | $150,000 | $102 | 36 |
| 1315 Murphy St | 0.74mi | 3/2.0 (-1) | 1,516 (-12%) | 3mo | $215,000 | $142 | 33 |
| 1307 Merry St | 0.68mi | 3/2.0 (-1) | 1,509 (-13%) | 11mo | $90,000 | $60 | 29 |
Match score weights: distance 35% · size 25% · config 20% · recency 20%. Top-matched comps best support the ARV.
Projected returns pro-forma
-3.0% appreciation · 4.29% rent growth · sell at horizon
- IRR
- -6.0%
- Equity multiple
- 0.78×
- Total profit
- $-11,309
- Equity at exit
- $26,839
- IRR
- 5.1%
- Equity multiple
- 1.39×
- Total profit
- $19,871
- Equity at exit
- $15,563
Cash invested: $50,400 (down + closing). Projections, not guarantees.
Landlord ↔ Tenant lean methodology
- Overall (STATE)
- 90 Strongly Landlord-Friendly
- State Georgia
- 90 Strongly Landlord-Friendly · R+3
- County
- — inherits STATE
- City
- — inherits STATE
ZIP-level market 30904
- Rents YoY
- 4.3%
- Active inventory
- 222
- Price-to-rent
- 8.5×
Monthly cashflow live
- Estimated rent
- $1,769 high interval (Pro) →
- Mortgage (P&I)
- −$944
- Tax from tax record
- −$134 /mo · $1,614/yr
- Insurance
- −$75
- HOA
- −$0
- Vacancy / Maint / Mgmt
- −$372
- Net cashflow
- $244
Break-even live
UW: 25.0% down · 7.5% · 30yr · 1.5% tax · 5.0% vac · 8.0% maint · 8.0% mgmt
Financing live
Cash to close
- Down payment
- $45,000
- Closing costs
- $5,400
- Reserves months
- —
- Total cash needed
- —
Loan-product check · same deal, 3 products live
Conventional
25% down · 7.5% · 30yr
- Down + closing
- —
- Monthly P&I
- —
- Monthly cashflow
- —
- DSCR
- —
- Eligible?
- —
Personal DTI + credit; lowest rate.
DSCR
20% down · 8.5% · 30yr
- Down + closing
- —
- Monthly P&I
- —
- Monthly cashflow
- —
- DSCR
- —
- Eligible?
- —
No personal income docs; deal must DSCR.
Hard money
10% down · 12.0% · 12mo
- Down + closing
- —
- Monthly P&I
- —
- Monthly cashflow
- —
- DSCR
- —
- Eligible?
- —
Short-term bridge; refi at stabilization.
Rent comps 16 comps
| Address | Beds | Baths | Sqft | Rent | $/sqft | DOM | Units | Dist |
|---|---|---|---|---|---|---|---|---|
| 1742 Walker St Augusta, GA | 3.0 | 2.0 | 1384 | $1,600 | $1.16 | 44d | 1 | 0.25mi |
| 1912 Watkins St #1912 Augusta, GA | 3.0 | 1.0 | 1126 | $1,425 | $1.27 | 43d | 1 | 0.27mi |
| 1912 Watkins St #1912 Augusta, GA | 3.0 | 1.0 | 1126 | $1,325 | $1.18 | 23d | 1 | 0.27mi |
| 1105 Merry St Augusta, GA | 3.0 | 1.0 | 1281 | $1,350 | $1.05 | 23d | 1 | 0.41mi |
| 1701 Goodrich St Augusta, GA | 1.0–3.0 | 1.0–2.0 | 1056 | $2,756 | $2.61 | 13d | 11 | 0.61mi |
| 1812 Central Ave Unit 1 Augusta, GA | 3.0 | 1.5 | 1528 | $2,600 | $1.70 | 43d | 1 | 0.67mi |
| 1812 Central Ave Augusta, GA | 3.0 | 1.5 | 1568 | $2,200 | $1.40 | 23d | 1 | 0.67mi |
| 1812 Central Ave Augusta, GA | 3.0 | 1.5 | 1568 | $2,200 | $1.40 | 43d | 1 | 0.67mi |
| 1315 Merry St Augusta, GA | 3.0 | 2.0 | 1610 | $1,450 | $0.90 | 23d | 1 | 0.71mi |
| 1480 Wrightsboro Rd Augusta, GA | 1.0–3.0 | 1.0–2.0 | 1046 | $2,375 | $2.27 | 21d | 13 | 0.87mi |
| 1432 Heard Ave Augusta, GA | 3.0 | 2.0 | 1278 | $1,500 | $1.17 | 43d | 1 | 1.16mi |
| 2139 Holt St Augusta, GA | 3.0 | 2.0 | 1611 | $1,550 | $0.96 | 43d | 1 | 1.22mi |
| 2139 Holt St Augusta, GA | 3.0 | 2.0 | 1611 | $1,475 | $0.92 | 23d | 1 | 1.22mi |
| 1508 Heard Ave Augusta, GA | 3.0 | 2.0 | 1314 | $1,400 | $1.07 | 43d | 1 | 1.24mi |
| 1712 Morgan St Augusta, GA | 3.0 | 1.0 | 1209 | $1,330 | $1.10 | 23d | 1 | 1.33mi |
| 1509 Troupe St Augusta, GA | 3.0 | 2.0 | 1200 | $1,695 | $1.41 | 13d | 1 | 1.48mi |
Listing history 27 events
-
2026-06-18days on market $180,000 Active 38 DOM
-
2026-06-17days on market $180,000 Active 37 DOM
-
2026-06-16days on market $180,000 Active 36 DOM
-
2026-06-15days on market $180,000 Active 35 DOM
-
2026-06-14days on market $180,000 Active 33 DOM
-
2026-06-10days on market $180,000 Active 30 DOM
-
2026-06-09days on market $180,000 Active 29 DOM
-
2026-06-08days on market $180,000 Active 28 DOM
-
2026-06-07days on market $180,000 Active 27 DOM
-
2026-06-03days on market $180,000 Active 23 DOM
-
2026-06-02days on market $180,000 Active 22 DOM
-
2026-06-01days on market $180,000 Active 21 DOM
-
2026-05-31days on market $180,000 Active 20 DOM
-
2026-05-30days on market $180,000 Active 19 DOM
-
2026-05-11historical
-
2026-05-11historical
-
2026-04-28$180,000 Active
-
2026-04-28$180,000 Active
-
2022-07-31historical
-
2022-07-29$49,900
-
2021-10-19historical
-
2020-10-19$169,900
-
2020-10-19$169,900
-
2007-05-12soldstatus $43,500 Closed
-
2007-05-12soldstatus $43,500
-
2007-04-24price $49,900
-
2006-08-08$49,900
ⓘ Source: listings_history table (triggers on properties + properties_extension) + one-shot
backfill from property_details.listing_events for pre-trigger history.
Tax reassessment forecast GA · Resets to sale price
- Current annual tax
- $1,614 · $134/mo
- Projected year-2 tax
- $1,656 · $138/mo
- Expected delta
- +$42/yr (+$4/mo · 2.6%)
ⓘ Screening estimate from a state-policy table — verify with the county assessor before closing.
Climate risk First Street
- Flood 1/10 Low FEMA zone X (unshaded) · 0% chance over 30 yrs
- Wildfire 1/10 Low
- Heat 8/10 Severe 7 d/yr ≥108°F today · 17 d/yr by 30 yrs out
- Wind 6/10 Major 66% chance of damaging wind over 30 yrs
- Air quality 4/10 Moderate 4 unhealthy d/yr today · 4 by 30 yrs out
Nearby sold comps map
Loading sold comps map…
Walkable amenities ~0.75 mi
Loading nearby amenities…
Taxation est. · year 1
- Rental income
- $21,232
- − Mortgage interest
- −$10,083
- − Property taxes
- −$1,614
- − Insurance
- −$900
- − Repairs & maintenance
- −$1,699
- − Management
- −$1,699
- − Depreciation
- −$5,236
- Taxable income
- $2
- Est. tax owed @ 24.0%
- −$0
- After-tax cash flow
- $2,932/yr
For passive investors: Depreciation is non-cash, so a rental often shows a tax loss while cash-flowing — sheltering income. Rental losses are passive: they offset passive income freely, and up to $25,000/yr can offset ordinary (W-2) income if you actively participate and your MAGI is under $100k (phasing out to $0 by $150k); unused losses carry forward. On sale, claimed depreciation is recaptured at up to 25%, and gains may owe capital-gains tax (a 1031 exchange can defer both). Figures are a year-1 estimate at your 24.0% rate — not tax advice; consult a CPA.
Schools (NCES district)
- District
- Richmond County
- NCES district ID
- 1304380
- Math proficiency
- 12% ▼ -9.00%
- Reading proficiency
- 20% ▼ -6.00%
- Median HH income
- $38,069
- Composite
- 13.43/100
- National rank
- #9524
- State rank
- #154 of 174 in GA
Livability — Augusta-Richmond County consolidated government (balance)
No livability data for this city. (Only ~50 U.S. cities are tracked.)
Census & demographics
- Census place
- Augusta-Richmond County consolidated government (balance), GA
- County
- Richmond County · 190,917 people
- City population
- 154,035
- Metro
- Augusta-Richmond County, GA-SC
- Population (ZIP)
- 23,400
- Household income
- $46,696
- Rent vs Own
- Severe rent burden
- 1594.0
Population outlook (Richmond County) Hauer SSP2
- Today (2025)
- 200,753 people
- By 2030
- 200,232 · -0.3%
- By 2040
- 196,813 · -2.0%
- By 2050
- 190,347 · -5.2%
- By 2075
- 172,496 · -14.1%
- By 2100
- 146,284 · -27.1%
Race, ethnicity, and origin ACS 2023
- Neighborhood character
- Diverse neighborhood (Simpson 0.61)
- Race & ethnicity
- Black 47% White 41% Hispanic / Latino 6% Two or more races 6% Asian 2%
- Hispanic origin (detail)
- Mexican 1%
- Common ancestry
- Italian 1% Slovak 1% Romanian 1%
- Foreign-born
- 3% · Canada, South Korea, Jamaica
- Languages at home
- 93% English-only · Spanish 4% Korean 1%
Political lean MEDSL · Richmond
- 2024 margin
- Solid D (+36.1) · D 67.8% · R 31.7%
- 2008→2024 swing
- +4.3pp toward D · 2008: 31.8pp · 2024: 36.1pp
- All cycles
- 2024: D+36.1 2020: D+37.2 2016: D+32.4 2012: D+33.8 2008: D+31.8
Not yet ingested
- Civics
- —
Market trends
- HPI YoY
- ▼ -211.97%
- Current HPI
- 199.0807
- Rent YoY
- ▲ 4.29%
- Metro
- Augusta-Richmond County, GA-SC
- State GDP YoY
- ▲ 2.66%
- F500 in state
- 28
Industry mix (Fortune 500 HQ in GA)
| Industry | F500 HQs | Revenue |
|---|---|---|
| Paper / Packaging | 2 | $29B |
|
||
| Retail | 1 | $160B |
|
||
| Transportation / Logistics | 1 | $91B |
|
||
| Airlines | 1 | $62B |
|
||
| Consumer Goods | 1 | $47B |
|
||
| Utilities | 1 | $25B |
|
||
Price history
+260.7% since first listed13 events — show timeline
- 2026-05-11 Listing Removed — Hive MLS
- 2026-05-11 Listing Removed — Hive MLS
- 2026-04-28 Listed $180,000 Hive MLS
- 2026-04-28 Listed $180,000 Hive MLS
- 2022-07-31 Listing Removed — Hive MLS
- 2022-07-29 Listed $49,900 Hive MLS
- 2021-10-19 Listing Removed — Hive MLS
- 2020-10-19 Listed $169,900 Hive MLS
- 2020-10-19 Listed $169,900 Hive MLS
- 2007-05-12 Sold (MLS) $43,500 Hive MLS
- 2007-05-12 Sold (MLS) $43,500 Hive MLS
- 2007-04-24 Price Changed $49,900 Hive MLS
- 2006-08-08 Listed $49,900 Hive MLS
Property tax history
+3.8%/yrLatest (2025): $1,614 · +16.9% YoY. Source: county tax records.
Cash-flow waterfall
monthlySold comps — $/sqft
last 12 mo · ≤1 miLoading sold comps…