 Triplex
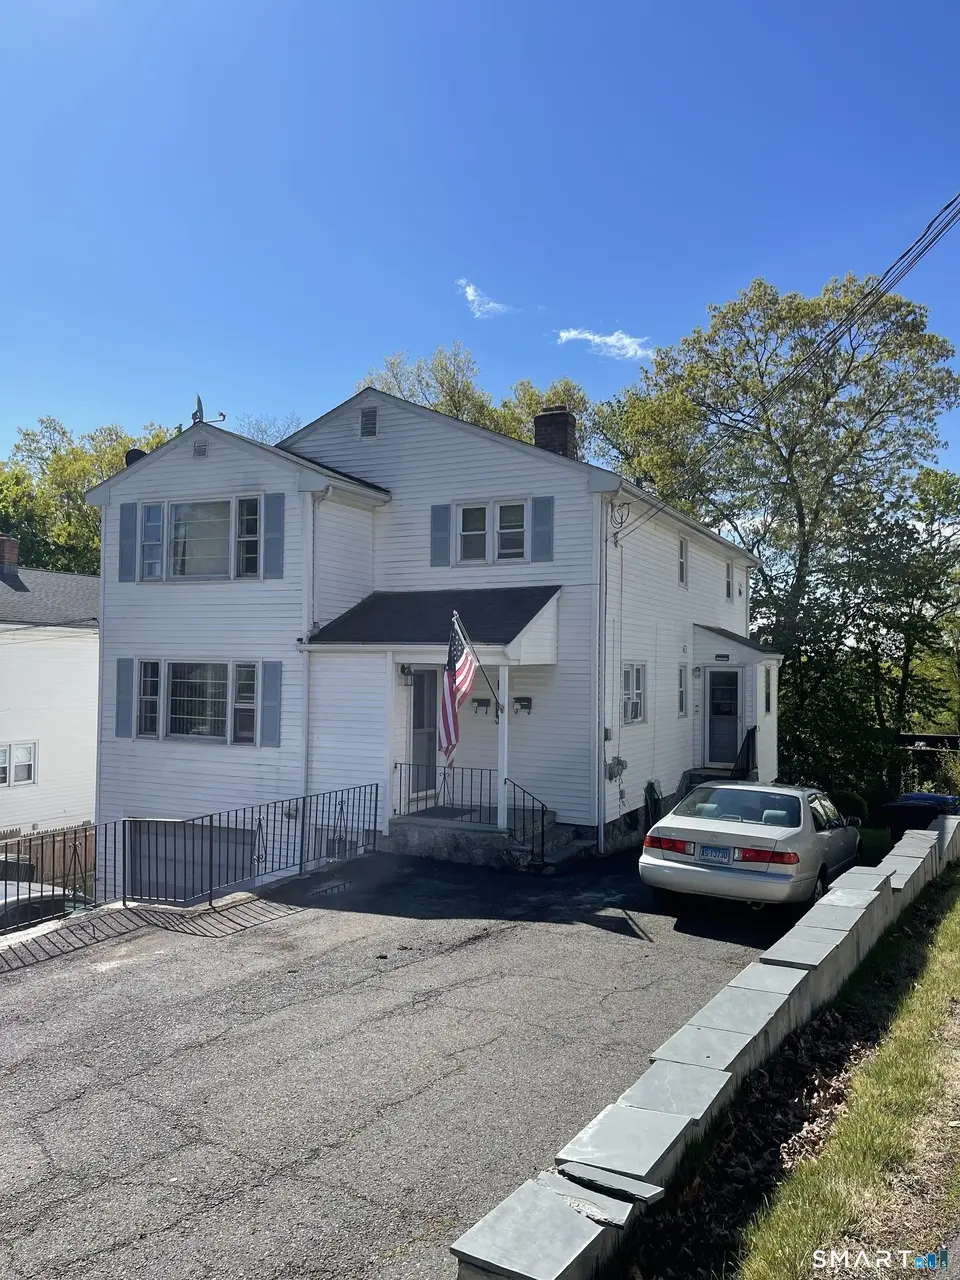
61 Gladiola St · New Britain, CT
Flood risk 1/10 · Minimal
- FEMA flood zone
- X (unshaded)
- Chance of flooding over 30 yrs
- 0.0%
- Est. flood insurance / yr
- $473 – $860
Fire risk 1/10 · Minimal
- Est. fire insurance / yr
- $829 – $1,539
Heat risk 5/10 · Moderate
- Hot days now (above 97°F)
- 7 days/yr
- Hot days in 30 yrs
- 16 days/yr
Wind risk 6/10 · Moderate
- Chance of severe wind over 30 yrs
- 27.0%
Air-quality risk 3/10 · Minor
- Unhealthy air days now
- 2 days/yr
- Unhealthy air days in 30 yrs
- 3 days/yr
Risk factors via First Street. Map © Google.
Why this score? — see what drove the B- grade
The composite is a weighted blend of 9 inputs, each scored 0–100. Each bar is that input's sub-score; the figure is the points it added to the 100-point composite (weight × sub-score).
- Cash flow +23.6/30.0
- Appreciation +10.0/10.0
- ARV discount +9.2/15.0
- DSCR +7.6/10.0
- 1% rule +6.4/10.0
- Rent growth +3.7/5.0
- Livability +3.7/5.0
- Condition / age +2.5/5.0
- Schools +1.0/10.0
$448,900
🖨 Deal sheet 📄 Offer letter ✓ Due diligence
Multi-family units
County records classify this as Multi-Family (2-4 Unit). Listing-text estimate: 3 units. confirmed
Listing remarks MLS
3 Family home in super condition. Spacious apartments, hardwood floors on 1st and 2nd floors. Great location. Won't last.
Key facts
- 7,405 sq ft lot
- Garage
- Built 1963
Property features AI
Finance
- Financial info: Assessed value listed (public record): $204,400
Exterior
- Parking: Under-house garage; 1 garage space
- Utilities: Public water connected; Public sewer connected
- Home design: Multi-family property (3-family)
- Construction: Frame construction; Concrete foundation; Built with typical multi-family construction
- Exterior features: Vinyl siding; Asphalt shingle roof
Interior
- Bedrooms: 8 total bedrooms
- Bathrooms: 3 full bathrooms
- Heating & cooling: Baseboard heating; Heat fuel: Electric and Natural Gas; Domestic hot water provided (Natural Gas)
- Interior features: 11 total rooms; Basement is partial with garage access and walk-out; includes an apartment; 3-family multi-unit (3 separate units)
- Laundry & utility: Basement laundry hook-ups
Neighborhood map
What this means for you Summary
Snapshot
- This is a 2×3bd/1.0ba + 1×2bd/1.0ba units multifamily listed at $449k.
Deal economics
- At list price, monthly cash flow is $845 ($10k/yr) — positive. Per door: $282/mo.
- The deal already cash-flows at list — no discount required.
- Meets the 1% rule at list price ($5k rent vs $449k).
- Cap rate 8.6% vs local median 4.4% in New Britain — top-decile yield for the area; either an underpriced asset or a hidden risk that comps aren't pricing in. Stress-test before assuming the spread holds.
Location & tenants
- Location reads 74/100 on livability (#67 in CT, #4,936 nationally) — a middle-class / working-renter tenant base. Strengths: health & safety A+, cost of living A, housing A; Watch: crime D, employment D.
- New Britain School District (suburban): math 6% / reading 17% proficiency, ranked #153 of 153 in CT (top 100%) — low school quality limits family demand, transient renter base, plan for 1-2y turnover; 71% free/reduced lunch — lower-income household profile, screen leases tightly.
- Zoned schools: Holmes Elementary School (math 11% / reading 23%, grade F, #459 of 553 statewide, top 84%, 460 students, 65% FRL); New Britain High School (math 10% / reading 31%, grade F, #162 of 194 statewide, top 83%, 2,331 students, 71% FRL) — zoned schools at 68% FRL track the district average.
- Market conditions: Rents rising fast (+4.9%/yr); 69 active listings in the ZIP; 1 comparable units currently listed for rent nearby; 1,867 units permitted in Capitol Planning Region in 2024 (1,399 in 5+ unit buildings).
- At $5,131/mo this rent would consume 98% of the median local household income ($63k/yr) (locally 1835% of renters already pay >50% of income on rent) — very limited rent-growth headroom before tenants either downsize or default.
Forward outlook
- In year one you build about $48k of equity ($3k loan paydown + $45k appreciation (10.0% local appreciation)).
- At projected returns (10.0% appreciation + 4.9% rent growth), your $126k cash investment doubles in ~3 years — after that, you're playing with house money.
- By year 2, paydown + projected appreciation supports a ~$77k cash-out refi (75% LTV) — recoverable capital for the next deal without selling this one.
Negotiation context
- Only 6 days on market — expect competitive offers; lowballing is unlikely to land.
- 2 sale attempts since 25y ago with the ask held roughly flat each time — persistent listings suggest the price (not the market) is what's stuck; bring a comps-based counter.
- Current owner paid $115k; list at $449k implies a 290% gain — meaningful room to come down on a strong offer.
Risks & watch-outs
- Climate carrying-cost: major wind risk, 27% chance of damaging wind over 30y; extreme-heat days projected 7→16/yr by 2055 (HVAC capex compounding) — expect insurance premiums to compound above CPI over the hold.
Questions for the listing agent
- Can we see the unit-by-unit rent roll, current vacancy, and any below-market leases? What's the average tenancy length?
- What capital expenditures (roof, boiler, parking lot, exteriors) have been made in the last 5 years, and what's planned in the next 2?
- Built in 1963 — when were the roof, HVAC, electrical panel, plumbing, and water heater last replaced?
- Is there a deadline driving the sale (1031 exchange, divorce, estate, relocation)? That informs how much negotiation room exists.
- Schools are F-rated, which usually means shorter tenancies and higher turnover. Who's the typical renter profile here, and what's been the actual vacancy rate?
- Crime grade is D in this area — have there been break-ins, vandalism, or insurance claims at this property in the last 3 years? What carrier currently insures it and at what premium?
- What's the average days-on-market for RENTAL listings here right now (not sales)? A rising rental-DOM trend means longer vacancies and softer asking-rent achievability than the comps imply.
- What's the recent tenant-quality profile in this submarket — average credit score on applications, eviction rate, late-payment / NSF rate, and stable-employment percentage? A property-management company in the area should have these aggregated.
- How much new apartment / multifamily construction is in the pipeline within 1–3 miles? Heavy new supply (>2% of stock underway) typically softens rents 12–24 months out; light construction supports rent growth.
Investment metrics
- 1% rule
- 1.14% ✓
- Cap rate
- 8.55%
- Cash-on-cash
- 8.07%
- DSCR
- 1.36
- GRM
- 7.3
CMA / ARV
- ARV (median comp)
- $466,727
- List price
- $448,900
- Delta
- -3.82%
- Verdict
- FAIR
- Comps
- 20 within 1.0 mi
Show comp detail 12 sales within ~0.75 mi
| Address | Dist | Beds/Ba | Sqft | Sold | Price | $/sf | Match |
|---|---|---|---|---|---|---|---|
| 16 Vincent Ave | 0.20mi | 7/3.0 | 2,939 (+5%) | 6mo | $535,000 | $182 | 78 |
| 18 Derby St | 0.19mi | 6/3.0 (-1) | 2,931 (+4%) | 9mo | $441,000 | $150 | 72 |
| 19 Hayes St | 0.45mi | 6/3.0 (-1) | 2,727 (-3%) | 7mo | $298,000 | $109 | 63 |
| 156 Wilcox St | 0.25mi | 6/2.0 (-1) | 2,608 (-7%) | 9mo | $395,000 | $151 | 60 |
| 116 Miller St | 0.62mi | 6/3.0 (-1) | 2,838 (+1%) | 10mo | $491,000 | $173 | 56 |
| 182 West St | 0.65mi | 6/3.0 (-1) | 2,910 (+4%) | 7mo | $485,000 | $167 | 53 |
| 154 Daly Ave | 0.56mi | 6/3.0 (-1) | 2,520 (-10%) | 8mo | $402,000 | $160 | 45 |
| 62 Miller St | 0.54mi | 6/3.0 (-1) | 3,090 (+10%) | 10mo | $490,000 | $159 | 45 |
| 15 Tremont St | 0.69mi | 8/3.0 (+1) | 3,126 (+11%) | 1mo | $450,000 | $144 | 44 |
| 34 Beatty St | 0.57mi | 6/3.0 (-1) | 3,228 (+15%) | 4mo | $510,000 | $158 | 40 |
| 38 Brown St | 0.54mi | 6/2.0 (-1) | 2,392 (-15%) | 7mo | $403,000 | $168 | 35 |
| 527 Burritt St | 0.72mi | 6/2.0 (-1) | 2,428 (-14%) | 1mo | $375,000 | $154 | 34 |
Match score weights: distance 35% · size 25% · config 20% · recency 20%. Top-matched comps best support the ARV.
Projected returns pro-forma
10.0% appreciation · 4.94% rent growth · sell at horizon
- IRR
- 31.0%
- Equity multiple
- 3.46×
- Total profit
- $308,655
- Equity at exit
- $404,405
- IRR
- 27.5%
- Equity multiple
- 8.08×
- Total profit
- $889,311
- Equity at exit
- $872,114
Cash invested: $125,692 (down + closing). Projections, not guarantees.
Landlord ↔ Tenant lean methodology
- Overall (STATE)
- 27 Tenant-Leaning
- State Connecticut
- 27 Tenant-Leaning · D+7
- County
- — inherits STATE
- City
- — inherits STATE
ZIP-level market 06053
- Home prices YoY
- 15.4%
- Rents YoY
- 4.9%
- Active inventory
- 69
- Price-to-rent
- 21.2×
Monthly cashflow live
- Estimated rent
- $5,131 high interval (Pro) →
- Mortgage (P&I)
- −$2,354
- Tax from tax record
- −$667 /mo · $8,008/yr
- Insurance
- −$187
- HOA
- −$0
- Vacancy / Maint / Mgmt
- −$1,078
- Net cashflow
- $845
Break-even live
3-unit breakdown (identical units grouped — click to expand)
| Units | Beds | Baths | Est. rent |
|---|---|---|---|
| 2× units | 3 | 1 | $3,536 |
| #1 | 3 | 1 | $1,768 |
| #2 | 3 | 1 | $1,768 |
| 1× unit | 2 | 1 | $1,594 |
| Total (3 units) | $5,131 | ||
UW: 25.0% down · 7.5% · 30yr · 1.5% tax · 5.0% vac · 8.0% maint · 8.0% mgmt
Financing live
Cash to close
- Down payment
- $112,225
- Closing costs
- $13,467
- Reserves months
- —
- Total cash needed
- —
Loan-product check · same deal, 3 products live
Conventional
25% down · 7.5% · 30yr
- Down + closing
- —
- Monthly P&I
- —
- Monthly cashflow
- —
- DSCR
- —
- Eligible?
- —
Personal DTI + credit; lowest rate.
DSCR
20% down · 8.5% · 30yr
- Down + closing
- —
- Monthly P&I
- —
- Monthly cashflow
- —
- DSCR
- —
- Eligible?
- —
No personal income docs; deal must DSCR.
Hard money
10% down · 12.0% · 12mo
- Down + closing
- —
- Monthly P&I
- —
- Monthly cashflow
- —
- DSCR
- —
- Eligible?
- —
Short-term bridge; refi at stabilization.
Rent comps 1 comps
| Address | Beds | Baths | Sqft | Rent | $/sqft | DOM | Units | Dist |
|---|---|---|---|---|---|---|---|---|
| 151 Fairview St New Britain, CT | 6.0 | 3.0 | 4098 | $1,800 | $0.44 | 3d | 1 | 1.39mi |
Listing history 4 events
-
2026-05-09historical $448,900 531-char remark
-
2001-10-04soldstatus $115,000
-
2001-10-03soldstatus $115,000 121-char remark
Show marketing remark (121 chars)
3 Family home in super condition. Spacious apartments, hardwood floors on 1st and 2nd floors. Great location. Won't last.
-
2001-01-30$114,900 121-char remark
Show marketing remark (121 chars)
3 Family home in super condition. Spacious apartments, hardwood floors on 1st and 2nd floors. Great location. Won't last.
ⓘ Source: listings_history table (triggers on properties + properties_extension) + one-shot
backfill from property_details.listing_events for pre-trigger history.
Tax reassessment forecast CT · Partial reset (capped growth)
- Current annual tax
- $8,008 · $667/mo
- Projected year-2 tax
- $8,807 · $734/mo
- Expected delta
- +$799/yr (+$67/mo · 10.0%)
ⓘ Screening estimate from a state-policy table — verify with the county assessor before closing.
Climate risk First Street
- Flood 1/10 Low FEMA zone X (unshaded) · 0% chance over 30 yrs
- Wildfire 1/10 Low
- Heat 5/10 Major 7 d/yr ≥97°F today · 16 d/yr by 30 yrs out
- Wind 6/10 Major 27% chance of damaging wind over 30 yrs
- Air quality 3/10 Moderate 2 unhealthy d/yr today · 3 by 30 yrs out
Nearby sold comps map
Loading sold comps map…
Walkable amenities ~0.75 mi
Loading nearby amenities…
Taxation est. · year 1
- Rental income
- $61,572
- − Mortgage interest
- −$25,145
- − Property taxes
- −$8,008
- − Insurance
- −$2,244
- − Repairs & maintenance
- −$4,926
- − Management
- −$4,926
- − Depreciation
- −$13,059
- Taxable income
- $3,264
- Est. tax owed @ 24.0%
- −$783
- After-tax cash flow
- $9,357/yr
For passive investors: Depreciation is non-cash, so a rental often shows a tax loss while cash-flowing — sheltering income. Rental losses are passive: they offset passive income freely, and up to $25,000/yr can offset ordinary (W-2) income if you actively participate and your MAGI is under $100k (phasing out to $0 by $150k); unused losses carry forward. On sale, claimed depreciation is recaptured at up to 25%, and gains may owe capital-gains tax (a 1031 exchange can defer both). Figures are a year-1 estimate at your 24.0% rate — not tax advice; consult a CPA.
Schools (NCES district)
- District
- New Britain School District
- NCES district ID
- 0902670
- Math proficiency
- 6% ▼ -6.00%
- Reading proficiency
- 17% ▼ -5.00%
- Median HH income
- $40,827
- Composite
- 9.95/100
- National rank
- #9816
- State rank
- #153 of 153 in CT
Livability — New Britain
- Score
- 74/100
- State rank
- #67
- US rank
- #4936
Category grades
Schools grade is shown separately in the Schools card above.
Census & demographics
- Census place
- New Britain, CT
- County
- Hartford County · 754,208 people
- City population
- 66,322
- Metro
- Hartford-East Hartford-Middletown, CT
- Population (ZIP)
- 36,774
- Household income
- $62,645
- Rent vs Own
- Severe rent burden
- 1835.0
Population outlook (Capitol County) Hauer SSP2
- By 2040
- 1,063,519
Race, ethnicity, and origin ACS 2023
- Neighborhood character
- Diverse neighborhood (Simpson 0.64)
- Race & ethnicity
- White 47% Hispanic / Latino 36% Two or more races 13% Black 10% Asian 3%
- Hispanic origin (detail)
- Mexican 1% Puerto Rican 25% Dominican 4%
- Common ancestry
- Romanian 19% Lithuanian 3% Russian 1%
- Foreign-born
- 22% · Canada, Vietnam, China
- Languages at home
- 50% English-only · Spanish 26% Russian/Polish/Slavic 15% French/Haitian/Cajun 3%
Political lean MEDSL · Capitol
- 2024 margin
- Strong D (+21.9) · D 60.1% · R 38.2% · Other 1.7%
- All cycles
- 2024: D+21.9
Not yet ingested
- Civics
- —
Market trends
- HPI YoY
- ▲ 65.76%
- Current HPI
- 491.4724
- Rent YoY
- ▲ 4.94%
- Metro
- Hartford-East Hartford-Middletown, CT
- State GDP YoY
- ▲ 1.06%
- F500 in state
- 38
Industry mix (Fortune 500 HQ in CT)
| Industry | F500 HQs | Revenue |
|---|---|---|
| Industrial Machinery | 4 | $38B |
|
||
| Insurance | 3 | $71B |
|
||
| Financial Services | 2 | $25B |
|
||
| Transportation / Logistics | 2 | $18B |
|
||
| Healthcare | 1 | $247B |
|
||
| Telecommunications | 1 | $55B |
|
||
Price history
+290.7% since first listed6 events — show timeline
- 2026-05-27 Pending — Smart MLS
- 2026-05-21 Listed $448,900 Smart MLS
- 2026-05-09 Coming Soon $448,900 Smart MLS
- 2001-10-04 Sold (Public Records) $115,000 Public Records
- 2001-10-03 Sold (MLS) $115,000 Smart MLS
- 2001-01-30 Listed $114,900 Smart MLS
Property tax history
+3.9%/yrLatest (2025): $8,008 · +2.4% YoY. Source: county tax records.
Cash-flow waterfall
monthlySold comps — $/sqft
last 12 mo · ≤1 miLoading sold comps…