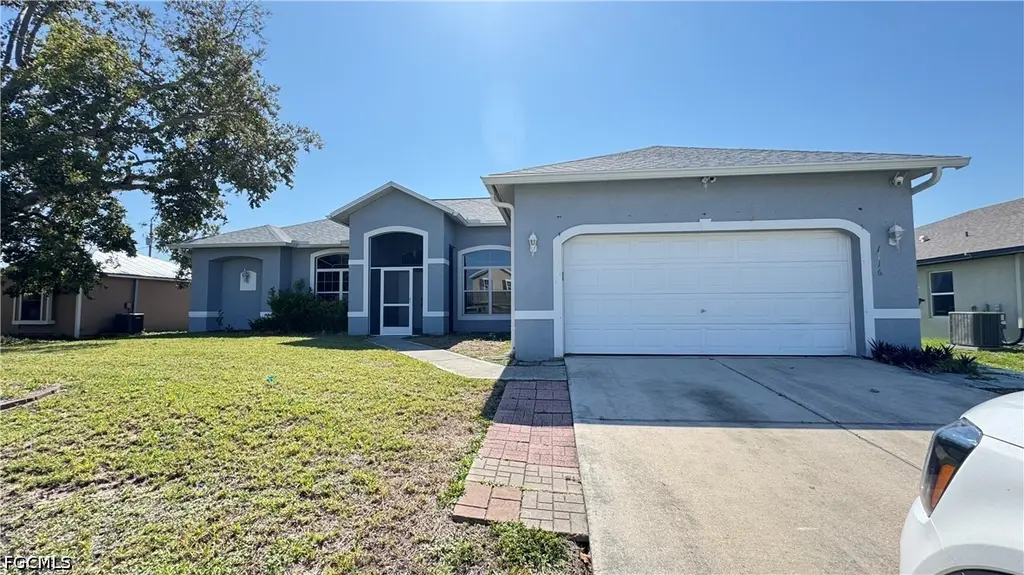
1716 SW 3rd Pl · Cape Coral, FL
Flood risk 5/10 · Moderate
- FEMA flood zone
- X (unshaded)
- Chance of flooding over 30 yrs
- 0.24%
- Est. flood insurance / yr
- $507 – $1,088
Fire risk 1/10 · Minimal
- Est. fire insurance / yr
- $947 – $1,759
Heat risk 10/10 · Severe
- Hot days now (above 107°F)
- 7 days/yr
- Hot days in 30 yrs
- 29 days/yr
Wind risk 10/10 · Severe
- Chance of severe wind over 30 yrs
- 99.0%
Air-quality risk 2/10 · Minimal
- Unhealthy air days now
- 1 days/yr
- Unhealthy air days in 30 yrs
- 1 days/yr
Risk factors via First Street. Map © Google.
Why this score? — see what drove the D+ grade
The composite is a weighted blend of 9 inputs, each scored 0–100. Each bar is that input's sub-score; the figure is the points it added to the 100-point composite (weight × sub-score).
- ARV discount +15.0/15.0
- Cash flow +14.8/30.0
- 1% rule +4.8/10.0
- DSCR +4.5/10.0
- Schools +4.1/10.0
- Livability +3.9/5.0
- Condition / age +2.5/5.0
- Rent growth +0.4/5.0
- Appreciation +0.0/10.0
$225,000
🖨 Deal sheet (PDF) 📄 Offer letter ✓ Due diligence
Listing remarks MLS
This lovely spacious home has tremendous potential in the heart of Cape Coral, Florida. Close to schools, restaurants, and stores in a fast-growing city. This house would be perfect for any family or even as a rental property. NEW ROOF, 2022 Water Heater, and 2016 AC. A huge master bedroom with a nice sized closet, dual sinks, bathtub, private toilet, and walk-in shower. Two more bedrooms with a ton of space and closets, and close to the shareable guest bathroom with dual sinks and tub/shower. A den with a great view of the front yard. Good sized kitchen with two possible dining areas and breakfast bar making entertaining any get-together easy. Then the living room can be well-lit by the long sliding glass door, leading to your patio where you can relax in the hot tub after a long day. Fenced backyard with mango, tangerine, and banana trees and plenty of room for a pool. This property is a great canvas for you to use your personality and imagination to make this house a place to call home.
Key facts
- 9,975 sq ft lot
- 2 garage spots
- Built 2006
Property features AI
Finance
- Other: Lot is rectangular with paved public-maintained road access; Lot dimensions approximately 80 x 125 (west exposure)
- Financial info: Pets allowed
- HOA & community: Community is non-gated with street lights; Sidewalks in the community
Exterior
- Parking: Attached 2-car garage; Driveway parking; Paved parking
- Utilities: Cable available; Sewer assessment paid; Water assessment paid
- Home design: Single-story home; Entry on level 1; Home faces East; Resale condition
- Construction: Block, concrete and stucco construction; Shingle roof; Built on standard foundation
- Exterior features: Fenced yard; Patio; Lanai; Screened porch; Porch; Patio/porch areas
Interior
- Kitchen: Dishwasher; Range; Microwave; Refrigerator
- Bedrooms: Bedroom on main level; Den; Screened porch (as an additional room type)
- Flooring: Tile flooring; Vinyl flooring
- Bathrooms: 2 full bathrooms
- Heating & cooling: Central electric heating; Central electric cooling (central air)
- Interior features: Arched and single-hung windows; Breakfast bar; Living/dining room; Pantry; Walk-in closets; Split bedrooms; Bathtub; Dual sinks
- Laundry & utility: Washer and dryer inside
Neighborhood map
What this means for you Summary
Snapshot
- This is a 3-bed/2.0-bath single-family listed at $225k.
Deal economics
- At list price, monthly cash flow is $61 ($730/yr) — positive.
- The deal already cash-flows at list — no discount required.
- To meet the 1% rule (rent ≥ 1% of price), the offer needs to be $221k (1.6% below list).
- Recommended offer: $221k (1.6% below list) — sets the bar for 1% rule.
- Cap rate 6.6% vs local median 3.1% in Cape Coral — top-decile yield for the area; either an underpriced asset or a hidden risk that comps aren't pricing in. Stress-test before assuming the spread holds.
Location & tenants
- Location reads 77/100 on livability (#208 in FL, #3,098 nationally) — a middle-class / working-renter tenant base. Strengths: housing A+, health & safety A+, amenities B+; Watch: commute F.
- Lee (suburban): math 47% / reading 50% proficiency, ranked #42 of 73 in FL (top 58%) — families likely to look elsewhere, expect single-tenant / working-renter base with shorter leases.
- Zoned schools: Gulf Elementary School (math 70% / reading 65%, grade B+, #435 of 2,144 statewide, top 21%, 1,231 students, 38% FRL); Challenger Middle School (math 59% / reading 56%, grade B, #157 of 571 statewide, top 28%, 1,124 students, 50% FRL); Ida S. Baker High School (math 44% / reading 47%, grade D-, #223 of 667 statewide, top 34%, 1,933 students, 39% FRL) — zoned schools average 42% FRL vs 57% district-wide (15 pts lower); this property's tenant base skews higher-income than the district average.
- Market conditions: Rents falling (-8.6%/yr); 691 active listings in the ZIP; 40 comparable units currently listed for rent nearby; rentals at typical pace (median 23d on market — plan ~3-4 weeks tenant-placement turnaround); solid renter incomes; 15,411 units permitted in Lee County in 2024 (4,686 in 5+ unit buildings).
- This rent runs 31% of the median local income ($84k/yr) — at the standard rent-burdened threshold; future hikes will face affordability resistance.
Forward outlook
- Local home prices are declining (-3.0%/yr); year-one equity from $2k of loan paydown is wiped out by about $7k of value loss. Plan a longer hold.
- Lee County population projected at +44% by 2050 — long-run rental-demand tailwind backs the buy-and-hold thesis.
Negotiation context
- Only 6 days on market — expect competitive offers; lowballing is unlikely to land.
- 3 sale attempts since 3y ago with the ask held roughly flat each time — persistent listings suggest the price (not the market) is what's stuck; bring a comps-based counter.
Risks & watch-outs
- Climate carrying-cost: moderate flood risk; severe wind risk, 99% chance of damaging wind over 30y; extreme-heat days projected 7→29/yr by 2055 (HVAC capex compounding) — expect insurance premiums to compound above CPI over the hold.
Questions for the listing agent
- Is there a deadline driving the sale (1031 exchange, divorce, estate, relocation)? That informs how much negotiation room exists.
- Schools are B-rated — typically a magnet for longer-tenancy family renters. What's the average tenant stay here, and is there a school-zone premium baked into asking?
- The area grade is low — what's the realistic commute time and amenity access for the typical tenant pool here? Any planned neighborhood developments (good or bad) we should know about?
- What's the average days-on-market for RENTAL listings here right now (not sales)? A rising rental-DOM trend means longer vacancies and softer asking-rent achievability than the comps imply.
- What's the recent tenant-quality profile in this submarket — average credit score on applications, eviction rate, late-payment / NSF rate, and stable-employment percentage? A property-management company in the area should have these aggregated.
- How much new for-sale + rental construction is in the pipeline within 1–3 miles? Heavy new supply typically softens prices + rents 12–24 months out; constrained supply supports both.
Investment metrics
- 1% rule
- 0.98% ✗
- Cap rate
- 6.62%
- Cash-on-cash
- 1.16%
- DSCR
- 1.05
- GRM
- 8.5
CMA / ARV
- ARV (on-the-fly)
- $397,312
- Comps found
- 12
Show comp detail 12 sales within ~0.75 mi
| Address | Dist | Beds/Ba | Sqft | Sold | Price | $/sf | Match |
|---|---|---|---|---|---|---|---|
| 1726 Emerald Cove Cir | 0.17mi | 3/2.0 | 2,031 (-1%) | 0mo | $332,475 | $164 | 90 |
| 1217 SW 1st Ave | 0.68mi | 3/2.0 | 2,032 (-1%) | 1mo | $435,500 | $214 | 66 |
| 1409 SW 1st Ave | 0.50mi | 3/2.0 | 1,935 (-6%) | 4mo | $325,000 | $168 | 64 |
| 126 SE 16th Ter | 0.57mi | 4/2.0 (+1) | 2,072 (+1%) | 5mo | $290,000 | $140 | 63 |
| 1425 SW 4th Pl | 0.36mi | 4/3.0 (+1) | 2,002 (-2%) | 11mo | $630,000 | $315 | 62 |
| 1401 SW First Ave | 0.52mi | 4/3.0 (+1) | 2,002 (-2%) | 7mo | $635,000 | $317 | 57 |
| 1400 SW 6th Ave | 0.56mi | 3/2.0 | 1,883 (-8%) | 9mo | $220,000 | $117 | 53 |
| 2135 SW 3rd Pl | 0.58mi | 3/3.0 | 2,216 (+8%) | 6mo | $345,000 | $156 | 50 |
| 327 SW 19th Ln | 0.27mi | 4/2.0 (+1) | 2,319 (+13%) | 12mo | $350,000 | $151 | 50 |
| 2141 SW 3rd Pl | 0.60mi | 4/2.0 (+1) | 1,853 (-10%) | 4mo | $360,000 | $194 | 48 |
| 151 SE 19th Ln | 0.71mi | 3/2.5 | 1,785 (-13%) | 10mo | $447,500 | $251 | 35 |
| 2140 SW 5th Ave | 0.64mi | 4/3.0 (+1) | 2,197 (+7%) | 19mo | $690,000 | $314 | 34 |
Match score weights: distance 35% · size 25% · config 20% · recency 20%. Top-matched comps best support the ARV.
Projected returns pro-forma
-3.0% appreciation · 0.0% rent growth · sell at horizon
- IRR
- -18.1%
- Equity multiple
- 0.38×
- Total profit
- $-38,957
- Equity at exit
- $33,548
- IRR
- -18.4%
- Equity multiple
- 0.15×
- Total profit
- $-53,542
- Equity at exit
- $19,454
Cash invested: $63,000 (down + closing). Projections, not guarantees.
Landlord ↔ Tenant lean methodology
- Overall (STATE)
- 87 Strongly Landlord-Friendly
- State Florida
- 87 Strongly Landlord-Friendly · R+3
- County
- — inherits STATE
- City
- — inherits STATE
ZIP-level market 33991
- Home prices YoY
- -27.8%
- Rents YoY
- -8.6%
- Active inventory
- 691
- Price-to-rent
- 8.5×
Monthly cashflow live
- Estimated rent
- $2,214 high interval (Pro) →
- Mortgage (P&I)
- −$1,180
- Tax from tax record
- −$415 /mo · $4,978/yr
- Insurance
- −$94
- HOA
- −$0
- Vacancy / Maint / Mgmt
- −$465
- Net cashflow
- $61
Break-even live
Sensitivity live
| Price | -10% $188 | -5% $125 | +0% $61 | +5% $-3 | +10% $-66 |
|---|---|---|---|---|---|
| Rent | -10% $-114 | -5% $-27 | +0% $61 | +5% $148 | +10% $236 |
| Rate | -1.0pp $174 | -0.5pp $118 | base $61 | +0.5pp $3 | +1.0pp $-57 |
UW: 25.0% down · 7.5% · 30yr · 1.5% tax · 5.0% vac · 8.0% maint · 8.0% mgmt
Financing live
Cash to close
- Down payment
- $56,250
- Closing costs
- $6,750
- Reserves months
- —
- Total cash needed
- —
Loan-product check · same deal, 3 products live
Conventional
25% down · 7.5% · 30yr
- Down + closing
- —
- Monthly P&I
- —
- Monthly cashflow
- —
- DSCR
- —
- Eligible?
- —
Personal DTI + credit; lowest rate.
DSCR
20% down · 8.5% · 30yr
- Down + closing
- —
- Monthly P&I
- —
- Monthly cashflow
- —
- DSCR
- —
- Eligible?
- —
No personal income docs; deal must DSCR.
Hard money
10% down · 12.0% · 12mo
- Down + closing
- —
- Monthly P&I
- —
- Monthly cashflow
- —
- DSCR
- —
- Eligible?
- —
Short-term bridge; refi at stabilization.
Rent comps 40 comps
| Address | Beds | Baths | Sqft | Rent | $/sqft | DOM | Units | Dist |
|---|---|---|---|---|---|---|---|---|
| 1729 SW 3rd Pl Cape Coral, FL | 3.0 | 2.0 | 1591 | $1,895 | $1.19 | 25d | 1 | 0.04mi |
| 1828 SW 3rd Pl Cape Coral, FL | 3.0 | 2.0 | 1806 | $1,911 | $1.06 | 5d | 1 | 0.14mi |
| 1716 SW 1st Ave Cape Coral, FL | 3.0 | 2.0 | 2090 | $2,561 | $1.23 | 15d | 1 | 0.28mi |
| 1327 SW 3rd Ave Cape Coral, FL | 3.0 | 2.0 | 1882 | $2,800 | $1.49 | 25d | 1 | 0.45mi |
| 1817 Santa Barbara Blvd Cape Coral, FL | 2.0 | 2.0 | 1982 | $1,450 | $0.73 | 25d | 1 | 0.45mi |
| 1939 Santa Barbara Blvd Cape Coral, FL | 2.0 | 2.0 | 2202 | $1,600 | $0.73 | 25d | 1 | 0.53mi |
| 119 SE 20th St Cape Coral, FL | 3.0 | 2.0 | 1672 | $1,781 | $1.07 | 18d | 1 | 0.60mi |
| 136 SE 19th Ln Cape Coral, FL | 4.0 | 2.0 | 2013 | $2,500 | $1.24 | 25d | 1 | 0.64mi |
| 130 SW 22nd St Cape Coral, FL | 3.0 | 2.0 | 1464 | $2,495 | $1.70 | 4d | 1 | 0.66mi |
| 138 SE 20th St Cape Coral, FL | 3.0 | 2.0 | 1946 | $3,800 | $1.95 | 25d | 1 | 0.67mi |
| 161 SE 17th St Cape Coral, FL | 3.0 | 3.0 | 2343 | $2,600 | $1.11 | 25d | 1 | 0.67mi |
| 173 SE 16th Ter Cape Coral, FL | 4.0 | 2.0 | 1828 | $2,085 | $1.14 | 4d | 1 | 0.73mi |
| 154 SE 20th St Cape Coral, FL | 4.0 | 2.0 | 1700 | $4,955 | $2.91 | 25d | 1 | 0.73mi |
| 205 SE 18th St Cape Coral, FL | 3.0 | 2.0 | 1404 | $2,100 | $1.50 | 5d | 1 | 0.73mi |
| 208 SE 17th St Cape Coral, FL | 3.0 | 2.0 | 1519 | $1,849 | $1.22 | 25d | 1 | 0.74mi |
| 2227 SW 5th Ave Cape Coral, FL | 3.0 | 2.0 | 1485 | $2,000 | $1.35 | 5d | 1 | 0.75mi |
| 1510 SW 8th Pl Cape Coral, FL | 3.0 | 2.0 | 1524 | $2,400 | $1.57 | 3d | 1 | 0.79mi |
| 614 SW 22nd Ter Cape Coral, FL | 3.0 | 2.0 | 2017 | $1,881 | $0.93 | 25d | 1 | 0.82mi |
| 220 SE 14th Ter Cape Coral, FL | 4.0 | 2.0 | 1828 | $1,721 | $0.94 | 5d | 1 | 0.82mi |
| 626 SW 22nd Ter Cape Coral, FL | 3.0 | 2.0 | 1629 | $1,725 | $1.06 | 5d | 1 | 0.84mi |
| 2112 SW 8th Pl Cape Coral, FL | 3.0 | 2.0 | 1580 | $2,100 | $1.33 | 25d | 1 | 0.84mi |
| 710 SW 12th St Cape Coral, FL | 4.0 | 2.0 | 1828 | $1,716 | $0.94 | 5d | 1 | 0.87mi |
| 1312 SE 2nd Pl Cape Coral, FL | 3.0 | 2.0 | 2344 | $1,395 | $0.60 | 25d | 1 | 0.88mi |
| 314 SE 15th Ter Cape Coral, FL | 4.0 | 2.0 | 2010 | $3,000 | $1.49 | 25d | 1 | 0.89mi |
| 401 SE 18th St Cape Coral, FL | 3.0 | 2.0 | 1744 | $1,645 | $0.94 | 5d | 1 | 0.90mi |
| 1713 SW 10th Pl Cape Coral, FL | 3.0 | 2.0 | 1704 | $1,850 | $1.09 | 25d | 1 | 0.96mi |
| 1201 SW 8th Pl Cape Coral, FL | 3.0 | 2.0 | 1839 | $3,000 | $1.63 | 16d | 1 | 0.98mi |
| 902 SW 21st Ln Cape Coral, FL | 3.0 | 2.0 | 1656 | $1,795 | $1.08 | 13d | 1 | 0.99mi |
| 1710 SW 10th Pl Cape Coral, FL | 3.0 | 2.0 | 1993 | $1,999 | $1.00 | 16d | 1 | 1.00mi |
| 417 SE 21st Ter Cape Coral, FL | 3.0 | 2.0 | 1418 | $2,400 | $1.69 | 23d | 1 | 1.07mi |
| 625 SW 25th Ter Cape Coral, FL | 3.0 | 2.0 | 1756 | $2,296 | $1.31 | 5d | 1 | 1.08mi |
| 1218 SW 9th Ct Cape Coral, FL | 3.0 | 2.0 | 1476 | $2,850 | $1.93 | 3d | 1 | 1.12mi |
| 1218 SW 9th Ct Cape Coral, FL | 3.0 | 2.0 | 1476 | $2,850 | $1.93 | 5d | 1 | 1.12mi |
| 1409 SW 11th Pl Cape Coral, FL | 4.0 | 2.0 | 1499 | $1,790 | $1.19 | 23d | 1 | 1.13mi |
| 509 SE 21st St Cape Coral, FL | 3.0 | 2.0 | 2471 | $3,500 | $1.42 | 25d | 1 | 1.14mi |
| 1403 SE 5th Pl Cape Coral, FL | 3.0 | 2.0 | 1477 | $2,200 | $1.49 | 25d | 1 | 1.18mi |
| 604 SW 26th St Cape Coral, FL | 3.0 | 2.0 | 1684 | $1,950 | $1.16 | 18d | 1 | 1.19mi |
| 604 SW 26th St Cape Coral, FL | 3.0 | 2.0 | 1684 | $2,199 | $1.31 | 25d | 1 | 1.19mi |
| 409 SW 8th St Cape Coral, FL | 4.0 | 2.0 | 2108 | $3,500 | $1.66 | 18d | 1 | 1.19mi |
| 916 SW 24th St Cape Coral, FL | 4.0 | 2.0 | 2260 | $2,749 | $1.22 | 25d | 1 | 1.19mi |
Listing history 18 events
-
2026-05-12status Pending
-
2026-05-05$225,000 Active
-
2024-08-02historical
-
2024-07-23$410,000 Active
-
2023-07-31soldstatus $385,000 Closed 1004-char remark
Show marketing remark (1004 chars)
This lovely spacious home has tremendous potential in the heart of Cape Coral, Florida. Close to schools, restaurants, and stores in a fast-growing city. This house would be perfect for any family or even as a rental property. NEW ROOF, 2022 Water Heater, and 2016 AC. A huge master bedroom with a nice sized closet, dual sinks, bathtub, private toilet, and walk-in shower. Two more bedrooms with a ton of space and closets, and close to the shareable guest bathroom with dual sinks and tub/shower. A den with a great view of the front yard. Good sized kitchen with two possible dining areas and breakfast bar making entertaining any get-together easy. Then the living room can be well-lit by the long sliding glass door, leading to your patio where you can relax in the hot tub after a long day. Fenced backyard with mango, tangerine, and banana trees and plenty of room for a pool. This property is a great canvas for you to use your personality and imagination to make this house a place to call home.
-
2023-07-04status Pending 1004-char remark
Show marketing remark (1004 chars)
This lovely spacious home has tremendous potential in the heart of Cape Coral, Florida. Close to schools, restaurants, and stores in a fast-growing city. This house would be perfect for any family or even as a rental property. NEW ROOF, 2022 Water Heater, and 2016 AC. A huge master bedroom with a nice sized closet, dual sinks, bathtub, private toilet, and walk-in shower. Two more bedrooms with a ton of space and closets, and close to the shareable guest bathroom with dual sinks and tub/shower. A den with a great view of the front yard. Good sized kitchen with two possible dining areas and breakfast bar making entertaining any get-together easy. Then the living room can be well-lit by the long sliding glass door, leading to your patio where you can relax in the hot tub after a long day. Fenced backyard with mango, tangerine, and banana trees and plenty of room for a pool. This property is a great canvas for you to use your personality and imagination to make this house a place to call home.
-
2023-06-21$385,000 Active 1004-char remark
Show marketing remark (1004 chars)
This lovely spacious home has tremendous potential in the heart of Cape Coral, Florida. Close to schools, restaurants, and stores in a fast-growing city. This house would be perfect for any family or even as a rental property. NEW ROOF, 2022 Water Heater, and 2016 AC. A huge master bedroom with a nice sized closet, dual sinks, bathtub, private toilet, and walk-in shower. Two more bedrooms with a ton of space and closets, and close to the shareable guest bathroom with dual sinks and tub/shower. A den with a great view of the front yard. Good sized kitchen with two possible dining areas and breakfast bar making entertaining any get-together easy. Then the living room can be well-lit by the long sliding glass door, leading to your patio where you can relax in the hot tub after a long day. Fenced backyard with mango, tangerine, and banana trees and plenty of room for a pool. This property is a great canvas for you to use your personality and imagination to make this house a place to call home.
-
2016-03-01price $117,900
-
2013-09-17price $119,900
-
2012-05-21soldstatus $118,000
-
2012-05-18soldstatus $118,000
-
2009-01-06soldstatus $120,000
-
2008-12-31soldstatus $120,000
-
2005-06-13soldstatus $78,000
-
2005-05-20soldstatus $79,900
-
2005-04-20price $83,700
-
2004-01-20soldstatus $20,900
-
2003-12-17soldstatus $14,000
ⓘ Source: listings_history table (triggers on properties + properties_extension) + one-shot
backfill from property_details.listing_events for pre-trigger history.
Tax reassessment forecast FL · Resets to sale price
- Current annual tax
- $4,978 · $415/mo
- Projected year-2 tax
- $4,978 · $415/mo
- Expected delta
- $0/yr ($0/mo · 0.0%)
ⓘ Screening estimate from a state-policy table — verify with the county assessor before closing.
Climate risk First Street
- Flood 5/10 Major FEMA zone X (unshaded) · 24% chance over 30 yrs
- Wildfire 1/10 Low
- Heat 10/10 Extreme 7 d/yr ≥107°F today · 29 d/yr by 30 yrs out
- Wind 10/10 Extreme 99% chance of damaging wind over 30 yrs
- Air quality 2/10 Low 1 unhealthy d/yr today · 1 by 30 yrs out
Nearby sold comps map
Loading sold comps map…
Walkable amenities ~0.75 mi
Loading nearby amenities…
Taxation est. · year 1
- Rental income
- $26,573
- − Mortgage interest
- −$12,603
- − Property taxes
- −$4,978
- − Insurance
- −$1,125
- − Repairs & maintenance
- −$2,126
- − Management
- −$2,126
- − Depreciation
- −$6,545
- Taxable loss
- −$2,931
- Est. tax savings @ 24.0%
- +$703
- After-tax cash flow
- $1,434/yr
For passive investors: Depreciation is non-cash, so a rental often shows a tax loss while cash-flowing — sheltering income. Rental losses are passive: they offset passive income freely, and up to $25,000/yr can offset ordinary (W-2) income if you actively participate and your MAGI is under $100k (phasing out to $0 by $150k); unused losses carry forward. On sale, claimed depreciation is recaptured at up to 25%, and gains may owe capital-gains tax (a 1031 exchange can defer both). Figures are a year-1 estimate at your 24.0% rate — not tax advice; consult a CPA.
Schools (NCES district)
- District
- Lee
- NCES district ID
- 1201080
- Math proficiency
- 47% ▼ -11.00%
- Reading proficiency
- 50% ▼ -4.00%
- Median HH income
- $49,518
- Composite
- 41.49/100
- National rank
- #3458
- State rank
- #42 of 73 in FL
Livability — Cape Coral
- Score
- 77/100
- State rank
- #208
- US rank
- #3098
Category grades
Schools grade is shown separately in the Schools card above.
Census & demographics
- Census place
- Cape Coral, FL
- County
- Lee County · 788,662 people
- City population
- 217,388
- Metro
- Cape Coral-Fort Myers, FL
- Population (ZIP)
- 27,725
- Household income
- $84,470
- Rent vs Own
- Severe rent burden
- 760.0
Population outlook (Lee County) Hauer SSP2
- Today (2025)
- 871,946 people
- By 2030
- 955,468 · +9.6%
- By 2040
- 1,113,587 · +27.7%
- By 2050
- 1,256,891 · +44.1%
- By 2075
- 1,560,270 · +78.9%
- By 2100
- 1,726,848 · +98.0%
Race, ethnicity, and origin ACS 2023
- Neighborhood character
- Predominantly White (71%)
- Race & ethnicity
- White 71% Hispanic / Latino 20% Two or more races 14% Black 3% Asian 1%
- Hispanic origin (detail)
- Mexican 1% Puerto Rican 6% Cuban 6%
- Common ancestry
- Romanian 5% Lithuanian 3% Italian 3%
- Foreign-born
- 13% · Canada, Jamaica
- Languages at home
- 81% English-only · Spanish 15% Russian/Polish/Slavic 1% Tagalog/Filipino 1%
Political lean MEDSL · Lee
- 2024 margin
- Strong R (+28.4) · D 35.5% · R 63.9%
- 2008→2024 swing
- -18.0pp toward R · 2008: -10.4pp · 2024: -28.4pp
- All cycles
- 2024: R+28.4 2020: R+19.2 2016: R+20.4 2012: R+16.6 2008: R+10.4
Not yet ingested
- Civics
- —
Market trends
- HPI YoY
- ▼ -108.25%
- Current HPI
- 281.0735
- Rent YoY
- ▼ -8.55%
- Metro
- Cape Coral-Fort Myers, FL
- State GDP YoY
- ▲ 3.28%
- F500 in state
- 36
Industry mix (Fortune 500 HQ in FL)
| Industry | F500 HQs | Revenue |
|---|---|---|
| Industrial Technology | 2 | $29B |
|
||
| Insurance | 2 | $17B |
|
||
| Retail | 1 | $60B |
|
||
| Technology Distribution | 1 | $58B |
|
||
| Homebuilding | 1 | $35B |
|
||
| Technology Manufacturing | 1 | $35B |
|
||
Price history
+1507.1% since first listed18 events — show timeline
- 2026-05-12 Pending — FORTMLS
- 2026-05-05 Listed $225,000 FORTMLS
- 2024-08-02 Listing Removed — FORTMLS
- 2024-07-23 Listed $410,000 FORTMLS
- 2023-07-31 Sold (MLS) $385,000 FORTMLS
- 2023-07-04 Pending — FORTMLS
- 2023-06-21 Listed $385,000 FORTMLS
- 2016-03-01 Price Changed $117,900 FORTMLS
- 2013-09-17 Price Changed $119,900 FORTMLS
- 2012-05-21 Sold (Public Records) $118,000 Public Records
- 2012-05-18 Sold (MLS) $118,000 FORTMLS
- 2009-01-06 Sold (Public Records) $120,000 Public Records
- 2008-12-31 Sold (MLS) $120,000 FORTMLS
- 2005-06-13 Sold (Public Records) $78,000 Public Records
- 2005-05-20 Sold (MLS) $79,900 FORTMLS
- 2005-04-20 Price Changed $83,700 FORTMLS
- 2004-01-20 Sold (Public Records) $20,900 Public Records
- 2003-12-17 Sold (Public Records) $14,000 Public Records
Property tax history
+4.3%/yrLatest (2025): $4,978 · +5.6% YoY. Source: county tax records.
Cash-flow waterfall
monthlySold comps — $/sqft
last 12 mo · ≤1 miLoading sold comps…