None · Glenvar Heights, FL
Flood risk 3/10 · Minor
- FEMA flood zone
- X (unshaded)
- Chance of flooding over 30 yrs
- 0.2%
- Est. flood insurance / yr
- $507 – $1,088
Fire risk 1/10 · Minimal
- Est. fire insurance / yr
- $947 – $1,759
Heat risk 10/10 · Severe
- Hot days now (above 105°F)
- 7 days/yr
- Hot days in 30 yrs
- 31 days/yr
Wind risk 10/10 · Severe
- Chance of severe wind over 30 yrs
- 99.0%
Air-quality risk 2/10 · Minimal
- Unhealthy air days now
- 1 days/yr
- Unhealthy air days in 30 yrs
- 1 days/yr
Risk factors via First Street. Map © Google.
Why this score? — see what drove the D grade
The composite is a weighted blend of 9 inputs, each scored 0–100. Each bar is that input's sub-score; the figure is the points it added to the 100-point composite (weight × sub-score).
- Cash flow +10.5/30.0
- ARV discount +7.5/15.0
- 1% rule +7.4/10.0
- Schools +4.2/10.0
- Livability +4.0/5.0
- Rent growth +3.7/5.0
- DSCR +3.0/10.0
- Condition / age +2.5/5.0
- Appreciation +0.0/10.0
$185,000
🖨 Deal sheet (PDF) 📄 Offer letter ✓ Due diligence
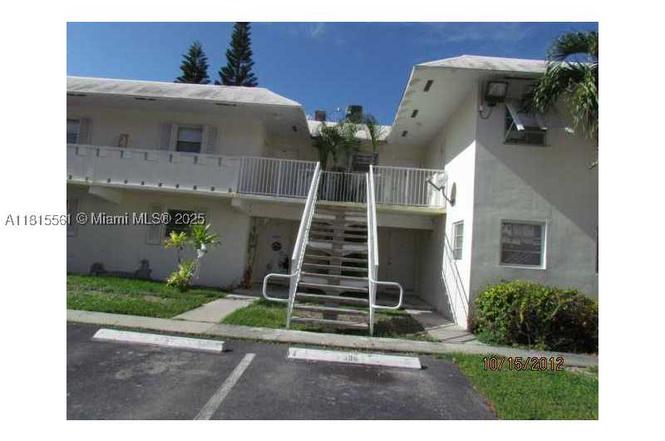
Listing remarks
2/1 condo in the Dadeland area, walk to metro and Dadeland Mall, close to 826, 30 minutes to beaches, 20 minutes to airport, tile floor, washer and dryer inside the unit. Pets friendly complex. New project will be work on this complex start 02/01/2026 (1) installation of a new roof; (2) concrete restoration; (3) all electrical systems of the Association, including, repairs to achieve recertification; (4) installation of impact glass on Association Common Elements; (5) insurance staffing; (6) Additional management staff; (7) Restoration and installation of new A/C stands on roofs; (8) rehabilitation and repairs of roof gutters; (9) Professional engineering fees; (10) banking deposits to be
Key facts
- Tile floor
- Walk to metro
- Close to 826
Tags
Property features AI
Finance
- Financial info: Lease considered; Pets allowed with size limit (maximum 20 lbs)
- HOA & community: Monthly association fee; Association fee covers parking, roof, sewer, security, trash and water; Association amenities include a pool
Exterior
- Parking: Assigned parking; Guest parking available; Two or more parking spaces
- Security: Security guard
- Utilities: Water and sewer included in association fee; Power available
- Home design: 2-story building; Property is attached; Entry on level 1
- Construction: Block construction; Resale property
- Exterior features: Association pool; No additional exterior features listed
Interior
- Kitchen: Electric range; Refrigerator
- Flooring: Ceramic tile
- Bathrooms: One full bathroom
- Interior features: First-floor entry; Bedroom on main level
- Laundry & utility: Washer; Dryer
Neighborhood map
What this means for you Summary
Snapshot
- This is a 2-bed/1.0-bath condo listed at $185k.
Deal economics
- At list price, monthly cash flow is $-96 ($-1k/yr) — negative.
- To cash-flow at today's rent, offer at most $168k (9.2% below list).
- Meets the 1% rule at list price ($2k rent vs $185k).
- Recommended offer: $163k (12.0% below list) — sets the bar for market timing.
Location & tenants
- Location reads 79/100 on livability (#137 in FL, #2,054 nationally) — a middle-class / working-renter tenant base. Strengths: crime A+, commute A+, employment A; Watch: amenities F, cost of living F.
- Miami-Dade (suburban): math 45% / reading 54% proficiency, ranked #40 of 73 in FL (top 55%) — families likely to look elsewhere, expect single-tenant / working-renter base with shorter leases; 64% free/reduced lunch — lower-income household profile, screen leases tightly.
- Zoned schools: Ludlam Elementary School (math 47% / reading 52%, grade D, #1,088 of 2,144 statewide, top 53%, 269 students, 56% FRL); South Miami Middle School (math 59% / reading 67%, grade B+, #111 of 571 statewide, top 20%, 725 students, 44% FRL); South Miami Senior High School (math 19% / reading 35%, grade F, #478 of 667 statewide, top 73%, 1,507 students, 59% FRL).
- Market conditions: Rents rising fast (+4.9%/yr); 266 active listings in the ZIP; 40 comparable units currently listed for rent nearby; rentals at typical pace (median 15d on market — plan ~3-4 weeks tenant-placement turnaround); solid renter incomes; 10,051 units permitted in Miami-Dade County in 2024 (7,758 in 5+ unit buildings).
- This rent runs 33% of the median local income ($83k/yr) — at the standard rent-burdened threshold; future hikes will face affordability resistance.
Forward outlook
- Local home prices are declining (-3.0%/yr); year-one equity from $1k of loan paydown is wiped out by about $6k of value loss. Plan a longer hold.
- Miami-Dade County population projected at +28% by 2050 — long-run rental-demand tailwind backs the buy-and-hold thesis.
Negotiation context
- It's been on market 383 days — a 12% lower offer ($163k) is reasonable based on typical stale-listing flexibility.
- 3 sale attempts since 12y ago; this cycle's ask has dropped $20k (10%) from the opening price — seller is motivated, your offer sets the floor, not the list.
- Current owner paid $80k; list at $185k implies a 131% gain — meaningful room to come down on a strong offer.
Risks & watch-outs
- Watch-outs: HOA is 28% of rent.
- Climate carrying-cost: severe wind risk, 99% chance of damaging wind over 30y; extreme-heat days projected 7→31/yr by 2055 (HVAC capex compounding) — expect insurance premiums to compound above CPI over the hold.
Questions for the listing agent
- What do current leases actually rent for vs. the listed asking? Can we see a recent rent roll and the last 12 months of T-12 income?
- It's been on market 383 days. Have you received any prior offers? Is the seller open to a 12% concession, seller financing, or rate buy-down credit?
- Built in 1968 — when were the roof, HVAC, electrical panel, plumbing, and water heater last replaced?
- What does the HOA fee cover, when was the last increase, and are there any pending special assessments or reserve-fund shortfalls?
- Any open or pending special assessments — roof, HVAC, plumbing, elevator, façade? What's the per-unit balance and payoff schedule, and is the seller paying it off at close or rolling it to the buyer?
- Why hasn't it sold? Are there any deal-killer items the seller is aware of (foundation, flood, title, zoning, code violations)?
- Is there a deadline driving the sale (1031 exchange, divorce, estate, relocation)? That informs how much negotiation room exists.
- Schools are A-rated — typically a magnet for longer-tenancy family renters. What's the average tenant stay here, and is there a school-zone premium baked into asking?
- The area grade is low — what's the realistic commute time and amenity access for the typical tenant pool here? Any planned neighborhood developments (good or bad) we should know about?
- What's the average days-on-market for RENTAL listings here right now (not sales)? A rising rental-DOM trend means longer vacancies and softer asking-rent achievability than the comps imply.
- What's the recent tenant-quality profile in this submarket — average credit score on applications, eviction rate, late-payment / NSF rate, and stable-employment percentage? A property-management company in the area should have these aggregated.
- How much new apartment / multifamily construction is in the pipeline within 1–3 miles? Heavy new supply (>2% of stock underway) typically softens rents 12–24 months out; light construction supports rent growth.
Investment metrics
- 1% rule
- 1.24% ✓
- Cap rate
- 5.67%
- Cash-on-cash
- -2.23%
- DSCR
- 0.90
- GRM
- 6.7
CMA / ARV
No comps found within radius.
Projected returns pro-forma
-3.0% appreciation · 4.93% rent growth · sell at horizon
- IRR
- -16.5%
- Equity multiple
- 0.40×
- Total profit
- $-31,128
- Equity at exit
- $27,584
- IRR
- -3.5%
- Equity multiple
- 0.73×
- Total profit
- $-13,841
- Equity at exit
- $15,995
Cash invested: $51,800 (down + closing). Projections, not guarantees.
Landlord ↔ Tenant lean methodology
- Overall (STATE)
- 87 Strongly Landlord-Friendly
- State Florida
- 87 Strongly Landlord-Friendly · R+3
- County
- — inherits STATE
- City
- — inherits STATE
ZIP-level market 33143
- Rents YoY
- 4.9%
- Active inventory
- 266
- Price-to-rent
- 6.7×
Monthly cashflow live
- Estimated rent
- $2,300 high interval (Pro) →
- Mortgage (P&I)
- −$970
- Tax from tax record
- −$221 /mo · $2,647/yr
- Insurance
- −$77
- HOA
- −$645
- Vacancy / Maint / Mgmt
- −$483
- Net cashflow
- $-96
Break-even live
Sensitivity live
| Price | -10% $9 | -5% $-44 | +0% $-96 | +5% $-149 | +10% $-201 |
|---|---|---|---|---|---|
| Rent | -10% $-278 | -5% $-187 | +0% $-96 | +5% $-5 | +10% $85 |
| Rate | -1.0pp $-3 | -0.5pp $-49 | base $-96 | +0.5pp $-144 | +1.0pp $-193 |
UW: 25.0% down · 7.5% · 30yr · 1.5% tax · 5.0% vac · 8.0% maint · 8.0% mgmt
Financing live
Cash to close
- Down payment
- $46,250
- Closing costs
- $5,550
- Reserves months
- —
- Total cash needed
- —
Loan-product check · same deal, 3 products live
Conventional
25% down · 7.5% · 30yr
- Down + closing
- —
- Monthly P&I
- —
- Monthly cashflow
- —
- DSCR
- —
- Eligible?
- —
Personal DTI + credit; lowest rate.
DSCR
20% down · 8.5% · 30yr
- Down + closing
- —
- Monthly P&I
- —
- Monthly cashflow
- —
- DSCR
- —
- Eligible?
- —
No personal income docs; deal must DSCR.
Hard money
10% down · 12.0% · 12mo
- Down + closing
- —
- Monthly P&I
- —
- Monthly cashflow
- —
- DSCR
- —
- Eligible?
- —
Short-term bridge; refi at stabilization.
Rent comps 40 comps
| Address | Beds | Baths | Sqft | Rent | $/sqft | DOM | Units | Dist |
|---|---|---|---|---|---|---|---|---|
| 7324 SW 82nd St Miami, FL | 2.0 | 1.0 | 730 | $2,050 | $2.81 | 26d | 2 | 0.01mi |
| 7324 SW 82nd St Miami, FL | 2.0 | 1.0 | 730 | $2,150 | $2.95 | 9d | 2 | 0.01mi |
| 7350 SW 82nd St Unit C125 Miami, FL | 1.0 | 1.0 | 700 | $1,875 | $2.68 | 26d | 1 | 0.03mi |
| 7308 SW 82nd St Unit A216 Miami, FL | 2.0 | 1.0 | 730 | $2,100 | $2.88 | 26d | 1 | 0.04mi |
| 7300 SW 82nd St Unit A101 Miami, FL | 2.0 | 2.0 | 750 | $2,250 | $3.00 | 23d | 1 | 0.06mi |
| 7360 SW 82nd St Unit E202 Miami, FL | 1.0 | 1.0 | 635 | $1,875 | $2.95 | 19d | 1 | 0.08mi |
| 7360 SW 82nd St Unit E202 Miami, FL | 1.0 | 1.0 | 635 | $1,875 | $2.95 | 7d | 1 | 0.08mi |
| 8250 SW 72nd Ct Miami, FL | 2.0 | 1.0–2.0 | 797 | $3,459 | $4.34 | 0d | 22 | 0.08mi |
| 7424 SW 82nd St Unit D216 Miami, FL | 2.0 | 1.0 | 730 | $2,000 | $2.74 | 14d | 1 | 0.09mi |
| 7424 SW 82nd St Unit D216 Miami, FL | 2.0 | 1.0 | 730 | $2,000 | $2.74 | 9d | 1 | 0.09mi |
| 8390 SW 72nd Ave Miami, FL | 1.0–2.0 | 1.0–2.0 | 978 | $3,500 | $3.58 | 9d | 2 | 0.13mi |
| 7500 SW 82nd St Miami, FL | 2.0 | 1.0 | 730 | $2,100 | $2.88 | 4d | 2 | 0.14mi |
| 7410 SW 82nd St Unit K103 Miami, FL | 1.0 | 1.0 | 620 | $1,580 | $2.55 | 26d | 1 | 0.14mi |
| 7401 SW 82nd St Unit 207S South Miami, FL | 1.0 | 1.0 | 654 | $1,900 | $2.91 | 22d | 1 | 0.15mi |
| 7401 SW 82nd St Unit 207S South Miami, FL | 1.0 | 1.0 | 654 | $1,800 | $2.75 | 9d | 1 | 0.15mi |
| 8390 SW 72nd Ave #411 Miami, FL | 1.0 | 1.0 | 745 | $2,450 | $3.29 | 17d | 1 | 0.15mi |
| 7403 SW 82nd St Unit 201N Miami, FL | 1.0 | 1.0 | 654 | $1,800 | $2.75 | 16d | 1 | 0.16mi |
| 8150 SW 72nd Ave Miami, FL | 1.0–3.0 | 1.0–3.5 | 1474 | $4,670 | $3.17 | 0d | 30 | 0.18mi |
| 7570 SW 82nd St Unit F110 Miami, FL | 2.0 | 1.0 | 730 | $2,100 | $2.88 | 26d | 1 | 0.19mi |
| 7570 SW 82nd St Unit F110 Miami, FL | 2.0 | 1.0 | 730 | $2,100 | $2.88 | 12d | 1 | 0.19mi |
| 7560 SW 82nd St Unit G112 Miami, FL | 2.0 | 2.0 | 750 | $2,200 | $2.93 | 0d | 1 | 0.19mi |
| 7560 SW 82nd St Unit G112 Miami, FL | 2.0 | 2.0 | 750 | $2,350 | $3.13 | 26d | 1 | 0.19mi |
| 8215 SW 72nd Ave Miami, FL | 3.0 | 1.0–2.0 | 923 | $3,174 | $3.44 | 0d | 17 | 0.22mi |
| 7580 SW 82nd St Unit 216 Miami, FL | 1.0 | 1.0 | 700 | $1,900 | $2.71 | 12d | 1 | 0.22mi |
| 7505 SW 82nd St Miami, FL | 1.0 | 1.0 | 616 | $1,850 | $3.00 | 4d | 3 | 0.28mi |
| 7505 SW 82nd St #212 Miami, FL | 1.0 | 1.0 | 671 | $1,950 | $2.91 | 15d | 1 | 0.28mi |
| 7505 SW 82nd St Miami, FL | 1.0 | 1.0 | 615 | $1,874 | $3.05 | 5d | 2 | 0.28mi |
| 7000 SW 80th St Unit 401 Miami, FL | 1.0 | 1.0 | 676 | $1,900 | $2.81 | 4d | 1 | 0.37mi |
| 7701 Camino Real Unit 416A Miami, FL | 1.0 | 1.0 | 712 | $2,000 | $2.81 | 9d | 1 | 0.39mi |
| 7703 Camino Real Unit 413A Miami, FL | 1.0 | 1.0 | 712 | $1,900 | $2.67 | 26d | 1 | 0.39mi |
| 7703 Camino Real Unit A405 Miami, FL | 1.0 | 1.0 | 712 | $1,850 | $2.60 | 13d | 1 | 0.39mi |
| 7722 Camino Real Unit E415 Miami, FL | 1.0 | 1.0 | 712 | $1,880 | $2.64 | 4d | 1 | 0.40mi |
| 8400 S Dixie Hwy Miami, FL | 3.0 | 1.0–2.0 | 906 | $3,644 | $4.02 | 0d | 14 | 0.40mi |
| 7732 Camino Real Unit F404 Miami, FL | 1.0 | 1.0 | 712 | $2,000 | $2.81 | 19d | 1 | 0.44mi |
| 7732 Camino Real Unit F404 Miami, FL | 1.0 | 1.0 | 712 | $2,000 | $2.81 | 17d | 1 | 0.44mi |
| 7290 SW 90th St Kendall, FL | 1.0–2.0 | 1.0–2.0 | 896 | $2,850 | $3.18 | 23d | 3 | 0.44mi |
| 7290 SW 90th St Kendall, FL | 1.0–2.0 | 1.0–2.0 | 896 | $2,850 | $3.18 | 19d | 3 | 0.44mi |
| 9055 SW 73rd Ct #1504 Miami, FL | 1.0 | 1.0 | 657 | $2,400 | $3.65 | 15d | 1 | 0.47mi |
| 9055 SW 73rd Ct #1403 Miami, FL | 1.0 | 1.0 | 657 | $2,225 | $3.39 | 23d | 1 | 0.47mi |
| 9055 SW 73rd Ct #1004 Miami, FL | 1.0 | 1.0 | 657 | $2,400 | $3.65 | 5d | 1 | 0.47mi |
HOA detail condo
- Monthly dues
- $645 · $7,740/yr
- Likely covers
- electric
- Assessments
- None detected in remarks — confirm with the listing agent.
Listing history 22 events
-
2026-06-22days on market $185,000 Active 383 DOM
-
2026-06-18days on market $185,000 Active 380 DOM
-
2026-06-17days on market $185,000 Active 379 DOM
-
2026-06-16days on market $185,000 Active 378 DOM
-
2026-06-15days on market $185,000 Active 377 DOM
-
2026-06-13days on market $185,000 Active 375 DOM
-
2026-06-09days on market $185,000 Active 371 DOM
-
2026-06-08days on market $185,000 Active 370 DOM
-
2026-06-08days on market $185,000 Active 369 DOM
-
2026-06-04days on market $185,000 Active 366 DOM
-
2026-06-03days on market $185,000 Active 365 DOM
-
2026-06-02days on market $185,000 Active 364 DOM
-
2026-06-01days on market $185,000 Active 363 DOM
-
2026-05-31days on market $185,000 Active 362 DOM
-
2025-10-23price $185,000
-
2025-06-04$205,000 Active
-
2018-02-26historical
-
2017-10-11$140,000 Active
-
2015-12-06historical
-
2014-12-30$120,000 Active
-
2013-03-22soldstatus $80,000
-
2004-05-27soldstatus $48,500,000
ⓘ Source: listings_history table (triggers on properties + properties_extension) + one-shot
backfill from property_details.listing_events for pre-trigger history.
Tax reassessment forecast FL · Resets to sale price
- Current annual tax
- $2,647 · $221/mo
- Projected year-2 tax
- $2,647 · $221/mo
- Expected delta
- $0/yr ($0/mo · 0.0%)
ⓘ Screening estimate from a state-policy table — verify with the county assessor before closing.
Climate risk First Street
- Flood 3/10 Moderate FEMA zone X (unshaded) · 20% chance over 30 yrs
- Wildfire 1/10 Low
- Heat 10/10 Extreme 7 d/yr ≥105°F today · 31 d/yr by 30 yrs out
- Wind 10/10 Extreme 99% chance of damaging wind over 30 yrs
- Air quality 2/10 Low 1 unhealthy d/yr today · 1 by 30 yrs out
Nearby sold comps map
Loading sold comps map…
Walkable amenities ~0.75 mi
Loading nearby amenities…
Taxation est. · year 1
- Rental income
- $27,595
- − Mortgage interest
- −$10,363
- − Property taxes
- −$2,647
- − Insurance
- −$925
- − Repairs & maintenance
- −$2,208
- − Management
- −$2,208
- − HOA
- −$7,740
- − Depreciation
- −$5,382
- Taxable loss
- −$3,877
- Est. tax savings @ 24.0%
- +$931
- After-tax cash flow
- $-224/yr
For passive investors: Depreciation is non-cash, so a rental often shows a tax loss while cash-flowing — sheltering income. Rental losses are passive: they offset passive income freely, and up to $25,000/yr can offset ordinary (W-2) income if you actively participate and your MAGI is under $100k (phasing out to $0 by $150k); unused losses carry forward. On sale, claimed depreciation is recaptured at up to 25%, and gains may owe capital-gains tax (a 1031 exchange can defer both). Figures are a year-1 estimate at your 24.0% rate — not tax advice; consult a CPA.
Schools (NCES district)
- District
- Miami-Dade
- NCES district ID
- 1200390
- Math proficiency
- 45% ▼ -16.00%
- Reading proficiency
- 54% ▼ -5.00%
- Median HH income
- $43,928
- Composite
- 41.76/100
- National rank
- #3397
- State rank
- #40 of 73 in FL
Livability — Glenvar Heights
- Score
- 79/100
- State rank
- #137
- US rank
- #2054
Category grades
Schools grade is shown separately in the Schools card above.
Census & demographics
- Census place
- Glenvar Heights, FL
- County
- Miami-Dade County · 2,697,751 people
- Metro
- Miami-Fort Lauderdale-Pompano Beach, FL
- Population (ZIP)
- 33,711
- Household income
- $83,008
- Rent vs Own
- Severe rent burden
- 1760.0
Population outlook (Miami-Dade County) Hauer SSP2
- Today (2025)
- 3,126,439 people
- By 2030
- 3,325,765 · +6.4%
- By 2040
- 3,697,561 · +18.3%
- By 2050
- 4,012,134 · +28.3%
- By 2075
- 4,605,612 · +47.3%
- By 2100
- 4,866,598 · +55.7%
Race, ethnicity, and origin ACS 2023
- Neighborhood character
- Diverse neighborhood (Simpson 0.56)
- Race & ethnicity
- Hispanic / Latino 60% Two or more races 39% White 27% Black 6% Asian 2%
- Hispanic origin (detail)
- Mexican 4% Puerto Rican 4% Cuban 27% Dominican 2% Salvadoran 2%
- Common ancestry
- Lithuanian 2% Romanian 2% Estonian 2%
- Foreign-born
- 43% · Canada, Jamaica, Dominican Republic
- Languages at home
- 34% English-only · Spanish 58% Other Indo-European 3% French/Haitian/Cajun 2%
Political lean MEDSL · Miami-Dade
- 2024 margin
- R (+11.4) · D 43.9% · R 55.4%
- 2008→2024 swing
- -27.6pp toward R · 2008: 16.1pp · 2024: -11.4pp
- All cycles
- 2024: R+11.4 2020: D+7.3 2016: D+29.6 2012: D+23.7 2008: D+16.1
Not yet ingested
- Civics
- —
Market trends
- HPI YoY
- ▼ -793.78%
- Current HPI
- 490.5935
- Rent YoY
- ▲ 4.93%
- Metro
- Miami-Fort Lauderdale-Pompano Beach, FL
- State GDP YoY
- ▲ 3.28%
- F500 in state
- 36
Industry mix (Fortune 500 HQ in FL)
| Industry | F500 HQs | Revenue |
|---|---|---|
| Industrial Technology | 2 | $29B |
|
||
| Insurance | 2 | $17B |
|
||
| Retail | 1 | $60B |
|
||
| Technology Distribution | 1 | $58B |
|
||
| Homebuilding | 1 | $35B |
|
||
| Technology Manufacturing | 1 | $35B |
|
||
Price history
-99.6% since first listed8 events — show timeline
- 2025-10-23 Price Changed $185,000 MARMLS
- 2025-06-04 Listed $205,000 MARMLS
- 2018-02-26 Listing Removed — MARMLS
- 2017-10-11 Listed $140,000 MARMLS
- 2015-12-06 Listing Removed — MARMLS
- 2014-12-30 Listed $120,000 MARMLS
- 2013-03-22 Sold (MLS) $80,000 MARMLS
- 2004-05-27 Sold (Public Records) $48,500,000 Public Records
Property tax history
+9.1%/yrLatest (2025): $2,647 · +3.3% YoY. Source: county tax records.
Cash-flow waterfall
monthlySold comps — $/sqft
last 12 mo · ≤1 miLoading sold comps…