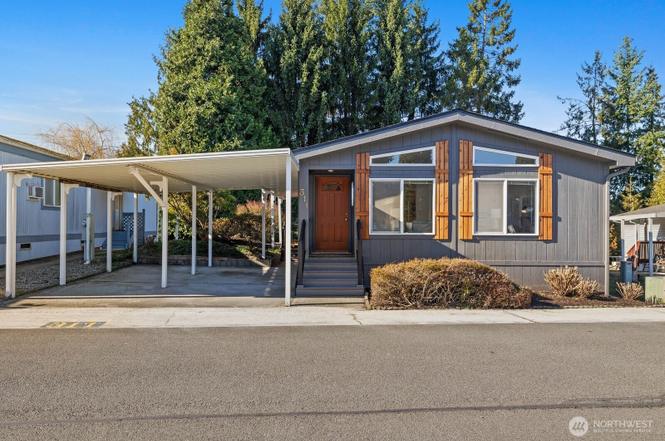
23825 15th Ave SE #311 · Bothell, WA
Flood risk No data
- FEMA flood zone
- —
- Chance of flooding over 30 yrs
- —
- Est. flood insurance / yr
- —
Fire risk No data
- Est. fire insurance / yr
- —
Heat risk No data
- Hot days now (above threshold)
- —
- Hot days in 30 yrs
- —
Wind risk No data
- Chance of severe wind over 30 yrs
- —
Air-quality risk No data
- Unhealthy air days now
- —
- Unhealthy air days in 30 yrs
- —
Risk factors via First Street. Map © Google.
Why this score? — see what drove the C- grade
The composite is a weighted blend of 9 inputs, each scored 0–100. Each bar is that input's sub-score; the figure is the points it added to the 100-point composite (weight × sub-score).
- Cash flow +16.8/30.0
- ARV discount +11.8/15.0
- Schools +6.7/10.0
- DSCR +5.2/10.0
- Livability +4.2/5.0
- 1% rule +3.5/10.0
- Rent growth +2.9/5.0
- Condition / age +2.5/5.0
- Appreciation +0.0/10.0
$305,000
🖨 Deal sheet 📄 Offer letter ✓ Due diligence
Listing remarks
Discover the perfect blend of modern comfort and peaceful community living in this partially remodeled 1,132 sq ft home. Located in the highly sought-after Green Acres Park, Bothell’s premier family-owned 55+ community since 1968, this 2-bedroom, 2-bathroom gem is move-in ready. Step inside to find brand new luxury vinyl plank flooring throughout and fresh interior and exterior paint that creates a bright, cohesive feel. The spacious open-concept living room flows into a large kitchen and a separate dining area, ideal for entertaining. Retreat to the oversized primary suite featuring a generous en-suite bathroom. Comfort is guaranteed year-round with an efficient heat pump for heating
Key facts
- 2 car carport
- Private clubhouse
- Efficient heat pump
Tags
Neighborhood map
What this means for you Summary
Snapshot
- This is a 2-bed/2.0-bath manufactured listed at $305k.
Deal economics
- At list price, monthly cash flow is $197 ($2k/yr) — positive.
- The deal already cash-flows at list — no discount required.
- To meet the 1% rule (rent ≥ 1% of price), the offer needs to be $259k (15.1% below list).
- Recommended offer: $259k (15.1% below list) — sets the bar for 1% rule.
- Cap rate 7.1% vs local median 1.5% in Bothell — top-decile yield for the area; either an underpriced asset or a hidden risk that comps aren't pricing in. Stress-test before assuming the spread holds.
Location & tenants
- Location reads 83/100 on livability (#53 in WA, #962 nationally) — a professional / high-income tenant draw. Strengths: schools A+, commute A+, employment A+; Watch: amenities C-, cost of living F.
- Northshore School District (suburban): math 69% / reading 78% proficiency, ranked #9 of 291 in WA (top 3%) — strong family-tenant draw, lease renewals of 3-5y typical; only 12% free/reduced lunch — higher-income household profile.
- Market conditions: Rents rising (+1.8%/yr); 254 active listings in the ZIP; 23 comparable units currently listed for rent nearby; rentals leasing fast (median 3d on market — plan ~1-2 weeks tenant-placement turnaround); high-income renter base; 3,982 units permitted in Snohomish County in 2024 (1,492 in 5+ unit buildings).
- This rent is only 17% of the median local income ($184k/yr) — well below the 30% rent-burden line; pricing power to push rent on renewal without tenant pushback.
Forward outlook
- Local home prices are declining (-3.0%/yr); year-one equity from $2k of loan paydown is wiped out by about $9k of value loss. Plan a longer hold.
- Snohomish County population projected at +30% by 2050 — long-run rental-demand tailwind backs the buy-and-hold thesis.
Negotiation context
- It's been on market 48 days — a 3% lower offer ($296k) is reasonable based on typical stale-listing flexibility.
- 2 sale attempts since 22y ago with the ask held roughly flat each time — persistent listings suggest the price (not the market) is what's stuck; bring a comps-based counter.
- Current owner paid $98k; list at $305k implies a 210% gain — meaningful room to come down on a strong offer.
Questions for the listing agent
- It's been on market 48 days. Have you received any prior offers? Is the seller open to a 15% concession, seller financing, or rate buy-down credit?
- Is there a deadline driving the sale (1031 exchange, divorce, estate, relocation)? That informs how much negotiation room exists.
- Schools are A-rated — typically a magnet for longer-tenancy family renters. What's the average tenant stay here, and is there a school-zone premium baked into asking?
- What's the average days-on-market for RENTAL listings here right now (not sales)? A rising rental-DOM trend means longer vacancies and softer asking-rent achievability than the comps imply.
- What's the recent tenant-quality profile in this submarket — average credit score on applications, eviction rate, late-payment / NSF rate, and stable-employment percentage? A property-management company in the area should have these aggregated.
- How much new for-sale + rental construction is in the pipeline within 1–3 miles? Heavy new supply typically softens prices + rents 12–24 months out; constrained supply supports both.
Investment metrics
- 1% rule
- 0.85% ✗
- Cap rate
- 7.07%
- Cash-on-cash
- 2.76%
- DSCR
- 1.12
- GRM
- 9.8
CMA / ARV
- ARV (on-the-fly)
- $337,336
- Comps found
- 12
Show comp detail 12 sales within ~0.75 mi
| Address | Dist | Beds/Ba | Sqft | Sold | Price | $/sf | Match |
|---|---|---|---|---|---|---|---|
| 23825 15th Ave SE #311 | 0.00mi | 2/2.0 | 1,132 (0%) | 0mo | $287,500 | $254 | 100 |
| 23825 15th Ave SE #180 | 0.00mi | 2/2.0 | 1,118 (-1%) | 11mo | $285,000 | $255 | 88 |
| 23825 15th Ave SE #28 | 0.00mi | 2/2.0 | 1,095 (-3%) | 11mo | $300,000 | $274 | 86 |
| 23825 15th Ave SE #133 | 0.00mi | 2/2.0 | 1,244 (+10%) | 9mo | $390,000 | $314 | 76 |
| 23825 15th Ave SE #62 | 0.00mi | 2/2.0 | 1,012 (-11%) | 8mo | $310,000 | $306 | 75 |
| 23825 15th Ave SE #101 | 0.00mi | 2/2.0 | 1,300 (+15%) | 1mo | $330,000 | $254 | 74 |
| 23825 15th Ave SE #22 | 0.00mi | 3/2.0 (+1) | 1,296 (+14%) | 2mo | $399,950 | $309 | 70 |
| 23825 15th Ave SE #77 | 0.00mi | 2/2.0 | 1,275 (+13%) | 12mo | $325,000 | $255 | 69 |
| 1725 242nd St SE #210 | 0.29mi | 2/2.0 | 1,292 (+14%) | 0mo | $410,000 | $317 | 63 |
| 1725 242nd St SE #222 | 0.29mi | 2/2.0 | 1,244 (+10%) | 9mo | $375,000 | $301 | 62 |
| 1725 242nd St SE #228 | 0.29mi | 2/2.0 | 1,275 (+13%) | 12mo | $380,000 | $298 | 55 |
| 1725 15th Ave SE #202 | 0.29mi | 2/2.0 | 1,300 (+15%) | 12mo | $375,000 | $288 | 52 |
Match score weights: distance 35% · size 25% · config 20% · recency 20%. Top-matched comps best support the ARV.
Projected returns pro-forma
-3.0% appreciation · 1.75% rent growth · sell at horizon
- IRR
- -13.2%
- Equity multiple
- 0.53×
- Total profit
- $-40,230
- Equity at exit
- $45,476
- IRR
- -6.2%
- Equity multiple
- 0.62×
- Total profit
- $-32,255
- Equity at exit
- $26,371
Cash invested: $85,400 (down + closing). Projections, not guarantees.
Landlord ↔ Tenant lean methodology
- Overall (STATE)
- 28 Tenant-Leaning
- State Washington
- 28 Tenant-Leaning · D+8
- County
- — inherits STATE
- City
- — inherits STATE
ZIP-level market 98021
- Rents YoY
- 1.8%
- Active inventory
- 254
- Price-to-rent
- 9.8×
Monthly cashflow live
- Estimated rent
- $2,589 high interval (Pro) →
- Mortgage (P&I)
- −$1,599
- Tax from tax record
- −$122 /mo · $1,461/yr
- Insurance
- −$127
- HOA
- −$0
- Vacancy / Maint / Mgmt
- −$544
- Net cashflow
- $197
Break-even live
UW: 25.0% down · 7.5% · 30yr · 1.5% tax · 5.0% vac · 8.0% maint · 8.0% mgmt
Financing live
Cash to close
- Down payment
- $76,250
- Closing costs
- $9,150
- Reserves months
- —
- Total cash needed
- —
Loan-product check · same deal, 3 products live
Conventional
25% down · 7.5% · 30yr
- Down + closing
- —
- Monthly P&I
- —
- Monthly cashflow
- —
- DSCR
- —
- Eligible?
- —
Personal DTI + credit; lowest rate.
DSCR
20% down · 8.5% · 30yr
- Down + closing
- —
- Monthly P&I
- —
- Monthly cashflow
- —
- DSCR
- —
- Eligible?
- —
No personal income docs; deal must DSCR.
Hard money
10% down · 12.0% · 12mo
- Down + closing
- —
- Monthly P&I
- —
- Monthly cashflow
- —
- DSCR
- —
- Eligible?
- —
Short-term bridge; refi at stabilization.
Rent comps 23 comps
| Address | Beds | Baths | Sqft | Rent | $/sqft | DOM | Units | Dist |
|---|---|---|---|---|---|---|---|---|
| 1630 228th St SE Bothell, WA | 1.0–3.0 | 1.0–2.0 | 940 | $2,387 | $2.54 | 1d | 11 | 0.54mi |
| 23028 27th Ave SE Bothell, WA | 1.0–3.0 | 1.0–2.0 | 880 | $2,636 | $2.99 | 1d | 16 | 0.72mi |
| 2207 227th St SE Bothell, WA | 1.0–3.0 | 1.0–2.0 | 846 | $2,257 | $2.67 | 1d | 8 | 0.78mi |
| 22717 4th Ave SE Unit B Bothell, WA | 2.0 | 1.0 | 860 | $2,500 | $2.91 | 24d | 1 | 0.99mi |
| 9611 NE 191st St Bothell, WA | 1.0 | 1.0 | 687 | $1,979 | $2.88 | 1d | 5 | 1.12mi |
| 9616 NE 188th St #302 Bothell, WA | 2.0 | 2.0 | 950 | $2,195 | $2.31 | 3d | 1 | 1.20mi |
| 10295 NE 189th St Bothell, WA | 2.0 | 1.0 | 960 | $2,150 | $2.24 | 11d | 2 | 1.24mi |
| 10315 NE 187th St Bothell, WA | 2.0 | 1.5 | 900 | $2,150 | $2.39 | 43d | 1 | 1.32mi |
| 19128 112th Ave NE Bothell, WA | 1.0–2.0 | 1.0–2.0 | 1031 | $3,165 | $3.07 | 2d | 19 | 1.33mi |
| 21623 16th Dr SE Bothell, WA | 1.0–3.0 | 1.0–2.0 | 990 | $2,598 | $2.62 | 2d | 11 | 1.35mi |
| 10324 NE 186th St Unit 1 Bothell, WA | 2.0 | 1.5 | 1108 | $2,300 | $2.08 | 43d | 1 | 1.35mi |
| 9634 Thorsk St Bothell, WA | 1.0 | 1.0 | 661 | $2,035 | $3.08 | 1d | 5 | 1.36mi |
| 9924 NE 185th St Bothell, WA | 1.0–3.0 | 1.0–2.0 | 1194 | $2,952 | $2.47 | 1d | 7 | 1.38mi |
| 18333 Bothell Way NE Bothell, WA | 1.0 | 1.0 | 802 | $2,159 | $2.69 | 3d | 9 | 1.41mi |
| 9226 NE 184th Pl Bothell, WA | 3.0 | 1.5 | 1250 | $3,900 | $3.12 | 5d | 1 | 1.43mi |
| 18420 102nd Ave NE Bothell, WA | 1.0–2.0 | 1.0–2.0 | 800 | $3,001 | $3.75 | 1d | 10 | 1.44mi |
| 3906 243rd Pl SE Bothell, WA | 1.0 | 1.0 | 744 | $2,299 | $3.09 | 43d | 2 | 1.45mi |
| 18307 98th Ave NE Bothell, WA | 1.0–2.0 | 1.0–2.0 | 769 | $2,760 | $3.59 | 1d | 4 | 1.45mi |
| 18305 96th Ave NE Bothell, WA | 2.0 | 1.0 | 670 | $2,300 | $3.43 | 15d | 2 | 1.46mi |
| 24107 7th Ave W Bothell, WA | 3.0 | 1.0 | 975 | $2,795 | $2.87 | 4d | 1 | 1.46mi |
| 18414 104th Ave NE Bothell, WA | 1.0–2.0 | 1.0–2.0 | 957 | $2,999 | $3.13 | 5d | 6 | 1.46mi |
| 23940 40th Dr SE Bothell, WA | 1.0–3.0 | 1.0–2.5 | 1151 | $2,868 | $2.49 | 1d | 12 | 1.47mi |
| 10730 Beardslee Blvd Bothell, WA | 1.0–2.0 | 1.0–1.5 | 793 | $2,195 | $2.77 | 43d | 2 | 1.50mi |
Listing history 4 events
-
2026-04-16status Pending
-
2026-02-26$305,000 Active
-
2004-09-28soldstatus $98,500
-
2004-05-03$98,500
ⓘ Source: listings_history table (triggers on properties + properties_extension) + one-shot
backfill from property_details.listing_events for pre-trigger history.
Tax reassessment forecast WA · Resets to sale price
- Current annual tax
- $1,461 · $122/mo
- Projected year-2 tax
- $2,989 · $249/mo
- Expected delta
- +$1,528/yr (+$127/mo · 104.6%)
ⓘ Screening estimate from a state-policy table — verify with the county assessor before closing.
Nearby sold comps map
Loading sold comps map…
Walkable amenities ~0.75 mi
Loading nearby amenities…
Taxation est. · year 1
- Rental income
- $31,063
- − Mortgage interest
- −$17,085
- − Property taxes
- −$1,461
- − Insurance
- −$1,525
- − Repairs & maintenance
- −$2,485
- − Management
- −$2,485
- − Depreciation
- −$8,873
- Taxable loss
- −$2,850
- Est. tax savings @ 24.0%
- +$684
- After-tax cash flow
- $3,045/yr
For passive investors: Depreciation is non-cash, so a rental often shows a tax loss while cash-flowing — sheltering income. Rental losses are passive: they offset passive income freely, and up to $25,000/yr can offset ordinary (W-2) income if you actively participate and your MAGI is under $100k (phasing out to $0 by $150k); unused losses carry forward. On sale, claimed depreciation is recaptured at up to 25%, and gains may owe capital-gains tax (a 1031 exchange can defer both). Figures are a year-1 estimate at your 24.0% rate — not tax advice; consult a CPA.
Schools (NCES district)
- District
- Northshore School District
- NCES district ID
- 5305910
- Math proficiency
- 69% ▼ -3.00%
- Reading proficiency
- 78% ▼ -1.00%
- Median HH income
- $92,951
- Composite
- 67.41/100
- National rank
- #826
- State rank
- #9 of 291 in WA
Livability — Bothell
- Score
- 83/100
- State rank
- #53
- US rank
- #962
Category grades
Schools grade is shown separately in the Schools card above.
Census & demographics
- Census place
- Bothell, WA
- County
- Snohomish County · 786,756 people
- City population
- 141,635
- Metro
- Seattle-Tacoma-Bellevue, WA
- Population (ZIP)
- 35,631
- Household income
- $183,786
- Rent vs Own
- Severe rent burden
- 413.0
Population outlook (Snohomish County) Hauer SSP2
- Today (2025)
- 899,800 people
- By 2030
- 960,975 · +6.8%
- By 2040
- 1,074,447 · +19.4%
- By 2050
- 1,171,954 · +30.2%
- By 2075
- 1,384,849 · +53.9%
- By 2100
- 1,497,296 · +66.4%
Race, ethnicity, and origin ACS 2023
- Neighborhood character
- Diverse neighborhood (Simpson 0.61)
- Race & ethnicity
- White 55% Asian 29% Two or more races 9% Hispanic / Latino 9% Black 1%
- Hispanic origin (detail)
- Mexican 6%
- Common ancestry
- Portuguese 4% Italian 3% Lithuanian 2%
- Foreign-born
- 29% · China, Canada, South Korea
- Languages at home
- 65% English-only · Other Indo-European 11% Other Asian/Pacific 6% Chinese 6%
Political lean MEDSL · Snohomish
- 2024 margin
- D (+19.0) · D 57.8% · R 38.9% · Other 3.3%
- 2008→2024 swing
- +0.1pp no change · 2008: 18.9pp · 2024: 19.0pp
- All cycles
- 2024: D+19.0 2020: D+20.6 2016: D+16.6 2012: D+16.2 2008: D+18.9
Not yet ingested
- Civics
- —
Market trends
- HPI YoY
- ▼ -903.22%
- Current HPI
- 380.5475
- Rent YoY
- ▲ 1.75%
- Metro
- Seattle-Tacoma-Bellevue, WA
- State GDP YoY
- ▲ 4.65%
- F500 in state
- 22
Industry mix (Fortune 500 HQ in WA)
| Industry | F500 HQs | Revenue |
|---|---|---|
| Retail | 2 | $269B |
|
||
| Technology / Retail | 1 | $638B |
|
||
| Technology | 1 | $245B |
|
||
| Telecommunications | 1 | $38B |
|
||
| Food / Beverage | 1 | $36B |
|
||
| Automotive / Trucks | 1 | $34B |
|
||
Price history
+209.6% since first listed4 events — show timeline
- 2026-04-16 Pending — NWMLS as Distributed by MLS Grid
- 2026-02-26 Listed $305,000 NWMLS as Distributed by MLS Grid
- 2004-09-28 Sold (MLS) $98,500 NWMLS as Distributed by MLS Grid
- 2004-05-03 Listed $98,500 NWMLS as Distributed by MLS Grid
Property tax history
+3.4%/yrLatest (2026): $1,461 · +17.2% YoY. Source: county tax records.
Cash-flow waterfall
monthlySold comps — $/sqft
last 12 mo · ≤1 miLoading sold comps…