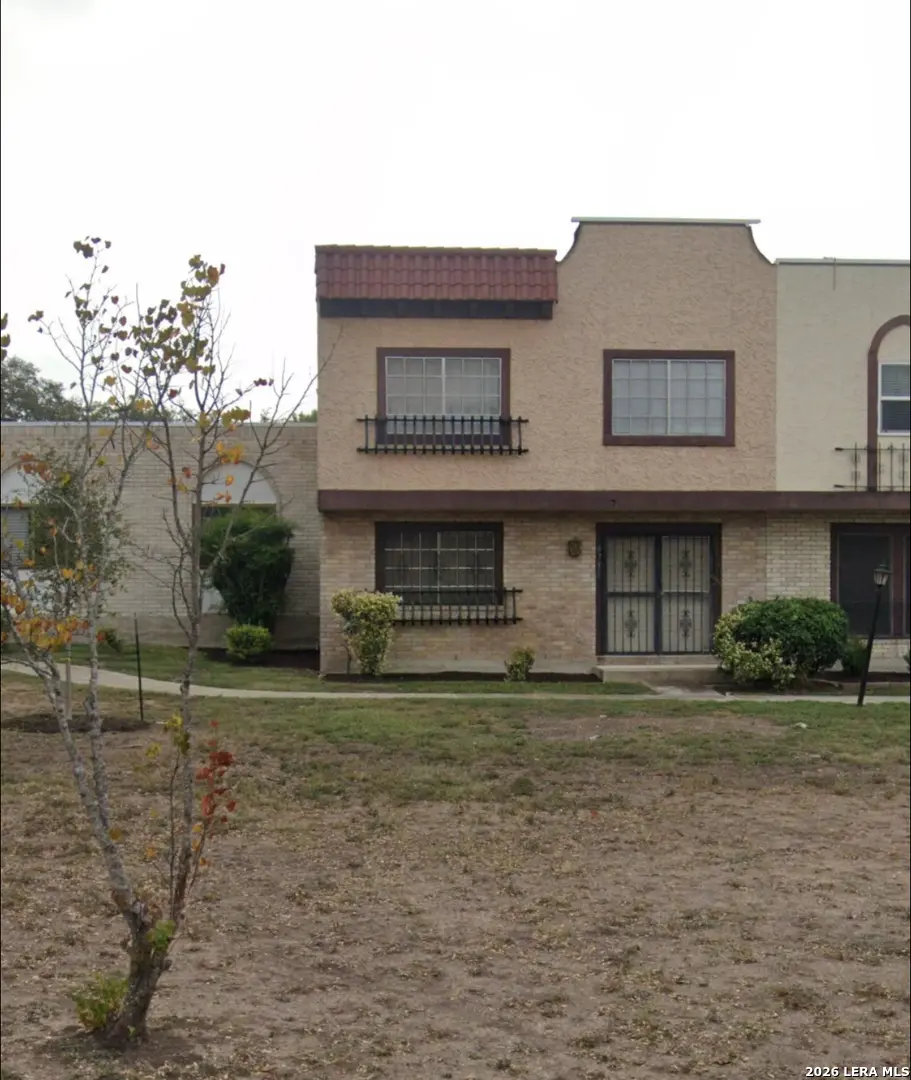
6751 Crown Rdg · San Antonio, TX
Flood risk 1/10 · Minimal
- FEMA flood zone
- X (unshaded)
- Chance of flooding over 30 yrs
- 0.0%
- Est. flood insurance / yr
- $507 – $1,088
Fire risk 1/10 · Minimal
- Est. fire insurance / yr
- $1,222 – $2,270
Heat risk 8/10 · Major
- Hot days now (above 107°F)
- 6 days/yr
- Hot days in 30 yrs
- 18 days/yr
Wind risk 8/10 · Major
- Chance of severe wind over 30 yrs
- 80.0%
Air-quality risk 2/10 · Minimal
- Unhealthy air days now
- 0 days/yr
- Unhealthy air days in 30 yrs
- 1 days/yr
Risk factors via First Street. Map © Google.
Why this score? — see what drove the C- grade
The composite is a weighted blend of 9 inputs, each scored 0–100. Each bar is that input's sub-score; the figure is the points it added to the 100-point composite (weight × sub-score).
- ARV discount +15.0/15.0
- Cash flow +11.9/30.0
- 1% rule +8.4/10.0
- Livability +4.0/5.0
- Schools +3.8/10.0
- DSCR +3.5/10.0
- Condition / age +2.5/5.0
- Rent growth +2.2/5.0
- Appreciation +0.0/10.0
$125,000
🖨 Deal sheet 📄 Offer letter ✓ Due diligence
Listing remarks MLS
Beautiful 3BR/2.5BA townhouse in the gated community of Crown Ridge offering 1,680 sqft of well designed living space. All bedrooms are located upstairs, with the main level featuring a spacious kitchen, living room, two dining areas, and a down stairs laundry for added convenience. Hoa includes high speed internet and cable provided by Spectrum. Community amenities include a pool, fitness center, park, and clubhouse. This property offers comfort, convenience, and community all in one place.
Key facts
- Gated community
- Down stairs laundry
- Fitness center
Tags
Neighborhood map
What this means for you Summary
Snapshot
- This is a 3-bed/2.5-bath townhouse listed at $125k.
Deal economics
- At list price, monthly cash flow is $-32 ($-383/yr) — negative.
- To cash-flow at today's rent, offer at most $119k (4.5% below list).
- Meets the 1% rule at list price ($2k rent vs $125k).
- Recommended offer: $114k (9.0% below list) — sets the bar for market timing.
- Cap rate 6.0% vs local median 3.8% in San Antonio — top-decile yield for the area; either an underpriced asset or a hidden risk that comps aren't pricing in. Stress-test before assuming the spread holds.
Location & tenants
- Location reads 80/100 on livability (#31 in TX, #1,616 nationally) — a professional / high-income tenant draw. Strengths: amenities A+, commute A+, cost of living A+; Watch: schools C-, crime F.
- North East ISD (urban): math 38% / reading 49% proficiency, ranked #276 of 826 in TX (top 33%) — families likely to look elsewhere, expect single-tenant / working-renter base with shorter leases.
- Market conditions: Rents soft (-1.1%/yr); 202 active listings in the ZIP; 40 comparable units currently listed for rent nearby; rentals leasing fast (median 11d on market — plan ~1-2 weeks tenant-placement turnaround); 8,308 units permitted in Bexar County in 2024 (2,506 in 5+ unit buildings).
Forward outlook
- Local home prices are declining (-3.0%/yr); year-one equity from $864 of loan paydown is wiped out by about $4k of value loss. Plan a longer hold.
- Bexar County population projected at +50% by 2050 — long-run rental-demand tailwind backs the buy-and-hold thesis.
Negotiation context
- It's been on market 91 days — a 9% lower offer ($114k) is reasonable based on typical stale-listing flexibility.
Risks & watch-outs
- Watch-outs: property tax is 3.0% of price.
- Climate carrying-cost: severe wind risk, 80% chance of damaging wind over 30y; extreme-heat days projected 6→18/yr by 2055 (HVAC capex compounding) — expect insurance premiums to compound above CPI over the hold.
Questions for the listing agent
- What do current leases actually rent for vs. the listed asking? Can we see a recent rent roll and the last 12 months of T-12 income?
- It's been on market 91 days. Have you received any prior offers? Is the seller open to a 9% concession, seller financing, or rate buy-down credit?
- Built in 1973 — when were the roof, HVAC, electrical panel, plumbing, and water heater last replaced?
- Property tax is high relative to price — has the assessment been appealed recently, and will the sale trigger a re-assessment?
- What does the HOA fee cover, when was the last increase, and are there any pending special assessments or reserve-fund shortfalls?
- Why hasn't it sold? Are there any deal-killer items the seller is aware of (foundation, flood, title, zoning, code violations)?
- Is there a deadline driving the sale (1031 exchange, divorce, estate, relocation)? That informs how much negotiation room exists.
- Crime grade is F in this area — have there been break-ins, vandalism, or insurance claims at this property in the last 3 years? What carrier currently insures it and at what premium?
- What's the average days-on-market for RENTAL listings here right now (not sales)? A rising rental-DOM trend means longer vacancies and softer asking-rent achievability than the comps imply.
- What's the recent tenant-quality profile in this submarket — average credit score on applications, eviction rate, late-payment / NSF rate, and stable-employment percentage? A property-management company in the area should have these aggregated.
- How much new for-sale + rental construction is in the pipeline within 1–3 miles? Heavy new supply typically softens prices + rents 12–24 months out; constrained supply supports both.
Investment metrics
- 1% rule
- 1.34% ✓
- Cap rate
- 5.99%
- Cash-on-cash
- -1.09%
- DSCR
- 0.95
- GRM
- 6.2
CMA / ARV
- ARV (median comp)
- $166,685
- List price
- $125,000
- Delta
- -25.01%
- Verdict
- UNDERPRICED
- Comps
- 20 within 1.0 mi
Show comp detail 12 sales within ~0.75 mi
| Address | Dist | Beds/Ba | Sqft | Sold | Price | $/sf | Match |
|---|---|---|---|---|---|---|---|
| 10819 S Crownview | 0.12mi | 3/2.5 | 1,750 (+4%) | 4mo | $155,900 | $89 | 85 |
| 6739 Crown Rdg #6739 | 0.01mi | 3/2.5 | 1,820 (+8%) | 6mo | $155,000 | $85 | 81 |
| 6750 Crown Rdg | 0.03mi | 2/2.0 (-1) | 1,544 (-8%) | 1mo | $169,900 | $110 | 77 |
| 6655 Crown Rdg | 0.08mi | 3/2.5 | 1,820 (+8%) | 6mo | $149,900 | $82 | 77 |
| 5800 Royal Bnd | 0.57mi | 3/2.0 | 1,680 (0%) | 7mo | $224,900 | $134 | 66 |
| 6631 Crown Rdg | 0.11mi | 2/2.0 (-1) | 1,576 (-6%) | 15mo | $125,000 | $79 | 65 |
| 5854 Royal Rdg | 0.54mi | 3/2.0 | 1,617 (-4%) | 16mo | $269,900 | $167 | 53 |
| 10309 Grand Cir | 0.63mi | 3/2.0 | 1,765 (+5%) | 21mo | $259,900 | $147 | 43 |
| 5803 Royal Bnd | 0.54mi | 3/2.0 | 1,530 (-9%) | 24mo | $257,800 | $168 | 38 |
| 10105 Grand Park Dr | 0.60mi | 2/2.0 (-1) | 1,554 (-8%) | 21mo | $225,000 | $145 | 35 |
| 10310 Grand Club Dr | 0.65mi | 2/2.0 (-1) | 1,476 (-12%) | 12mo | $225,000 | $152 | 32 |
| 10304 Grand Cir | 0.63mi | 2/2.0 (-1) | 1,445 (-14%) | 13mo | $220,000 | $152 | 30 |
Match score weights: distance 35% · size 25% · config 20% · recency 20%. Top-matched comps best support the ARV.
Projected returns pro-forma
-3.0% appreciation · 0.0% rent growth · sell at horizon
- IRR
- -23.3%
- Equity multiple
- 0.23×
- Total profit
- $-26,874
- Equity at exit
- $18,638
- IRR
- -41.6%
- Equity multiple
- -0.25×
- Total profit
- $-43,674
- Equity at exit
- $10,808
Cash invested: $35,000 (down + closing). Projections, not guarantees.
Landlord ↔ Tenant lean methodology
- Overall (STATE)
- 87 Strongly Landlord-Friendly
- State Texas
- 87 Strongly Landlord-Friendly · R+5
- County
- — inherits STATE
- City
- — inherits STATE
ZIP-level market 78239
- Home prices YoY
- -5.9%
- Rents YoY
- -1.1%
- Active inventory
- 202
- Price-to-rent
- 6.2×
Monthly cashflow live
- Estimated rent
- $1,676 high interval (Pro) →
- Mortgage (P&I)
- −$656
- Tax from tax record
- −$316 /mo · $3,789/yr
- Insurance
- −$52
- HOA
- −$333
- Vacancy / Maint / Mgmt
- −$352
- Net cashflow
- $-32
Break-even live
UW: 25.0% down · 7.5% · 30yr · 1.5% tax · 5.0% vac · 8.0% maint · 8.0% mgmt
Financing live
Cash to close
- Down payment
- $31,250
- Closing costs
- $3,750
- Reserves months
- —
- Total cash needed
- —
Loan-product check · same deal, 3 products live
Conventional
25% down · 7.5% · 30yr
- Down + closing
- —
- Monthly P&I
- —
- Monthly cashflow
- —
- DSCR
- —
- Eligible?
- —
Personal DTI + credit; lowest rate.
DSCR
20% down · 8.5% · 30yr
- Down + closing
- —
- Monthly P&I
- —
- Monthly cashflow
- —
- DSCR
- —
- Eligible?
- —
No personal income docs; deal must DSCR.
Hard money
10% down · 12.0% · 12mo
- Down + closing
- —
- Monthly P&I
- —
- Monthly cashflow
- —
- DSCR
- —
- Eligible?
- —
Short-term bridge; refi at stabilization.
Rent comps 40 comps
| Address | Beds | Baths | Sqft | Rent | $/sqft | DOM | Units | Dist |
|---|---|---|---|---|---|---|---|---|
| 9426 Apple Ridge Ln Unit 603 San Antonio, TX | 3.0 | 2.5 | 1225 | $1,450 | $1.18 | 7d | 1 | 0.10mi |
| 10958 Crown Park San Antonio, TX | 3.0 | 2.5 | 1750 | $1,500 | $0.86 | 11d | 1 | 0.13mi |
| 6503 Ithaca Frst San Antonio, TX | 3.0 | 2.0 | 1630 | $1,695 | $1.04 | 43d | 1 | 0.42mi |
| 10527 Sonora Sunset San Antonio, TX | 3.0 | 2.5 | 1582 | $1,599 | $1.01 | 20d | 1 | 0.46mi |
| 10527 Sonora Sunset San Antonio, TX | 3.0 | 2.5 | 1582 | $1,599 | $1.01 | 7d | 1 | 0.46mi |
| 6427 Ithaca Fls San Antonio, TX | 3.0 | 2.0 | 1315 | $1,595 | $1.21 | 7d | 1 | 0.47mi |
| 6427 Ithaca Fls San Antonio, TX | 3.0 | 2.0 | 1314 | $1,595 | $1.21 | 24d | 1 | 0.47mi |
| 6527 Ithaca Fls San Antonio, TX | 3.0 | 2.5 | 1528 | $1,850 | $1.21 | 4d | 1 | 0.47mi |
| 6406 Ithaca Fls San Antonio, TX | 3.0 | 2.5 | 1508 | $1,500 | $0.99 | 11d | 1 | 0.50mi |
| 5838 Royal Bnd San Antonio, TX | 3.0 | 2.5 | 1908 | $1,850 | $0.97 | 11d | 1 | 0.54mi |
| 10306 Pinehurst Run San Antonio, TX | 3.0 | 2.0 | 1271 | $1,800 | $1.42 | 7d | 1 | 0.68mi |
| 10503 Ludlow Ct San Antonio, TX | 4.0 | 2.0 | 1690 | $1,100 | $0.65 | 4d | 1 | 0.73mi |
| 11411 Crosswinds Way San Antonio, TX | 3.0 | 1.0–2.0 | 944 | $2,101 | $2.22 | 3d | 20 | 0.80mi |
| 12010 Sailing Away St San Antonio, TX | 3.0 | 2.0 | 1906 | $1,875 | $0.98 | 2d | 1 | 0.86mi |
| 7350 Walkers Loop Unit 1 Live Oak, TX | 4.0 | 3.0 | 1938 | $2,400 | $1.24 | 17d | 1 | 0.89mi |
| 12315 Constitution St San Antonio, TX | 3.0 | 2.0 | 1398 | $1,675 | $1.20 | 24d | 1 | 0.90mi |
| 12315 Constitution St San Antonio, TX | 3.0 | 2.0 | 1450 | $1,675 | $1.16 | 43d | 1 | 0.90mi |
| 6607 Shadden Oaks San Antonio, TX | 3.0 | 2.0 | 1525 | $1,800 | $1.18 | 24d | 1 | 0.93mi |
| 6722 Badger Pass Dr San Antonio, TX | 4.0 | 2.0 | 2180 | $1,795 | $0.82 | 4d | 1 | 1.00mi |
| 5801 Lake Champlain St San Antonio, TX | 3.0 | 2.0 | 1288 | $2,300 | $1.79 | 24d | 1 | 1.02mi |
| 7733 Forest Strm Live Oak, TX | 3.0 | 2.0 | 2041 | $1,975 | $0.97 | 14d | 1 | 1.02mi |
| 12607 Judson Rd San Antonio, TX | 1.0–3.0 | 1.0–2.0 | 1028 | $1,444 | $1.40 | 43d | 1 | 1.04mi |
| 12607 Judson Rd San Antonio, TX | 1.0–3.0 | 1.0–2.0 | 1028 | $1,444 | $1.40 | 3d | 23 | 1.04mi |
| 9711 Arcade Rdg San Antonio, TX | 3.0 | 2.0 | 1210 | $1,299 | $1.07 | 43d | 1 | 1.05mi |
| 6011 Little Brandywine Crk San Antonio, TX | 3.0 | 2.0 | 1314 | $1,595 | $1.21 | 4d | 1 | 1.10mi |
| 19 Bedford Bay San Antonio, TX | 3.0 | 2.5 | 1721 | $1,749 | $1.02 | 2d | 1 | 1.11mi |
| 19 Bedford Bay San Antonio, TX | 3.0 | 3.0 | 1721 | $2,129 | $1.24 | 24d | 1 | 1.11mi |
| 34 Basin Elm San Antonio, TX | 3.0 | 2.5 | 1627 | $1,600 | $0.98 | 24d | 1 | 1.13mi |
| 214 Earlyway Dr San Antonio, TX | 3.0 | 1.0 | 1300 | $1,500 | $1.15 | 4d | 1 | 1.14mi |
| 12423 Cannonade St San Antonio, TX | 3.0 | 2.0 | 1330 | $1,560 | $1.17 | 4d | 1 | 1.15mi |
| 11 Basin Elm San Antonio, TX | 3.0 | 2.5 | 1437 | $1,550 | $1.08 | 4d | 1 | 1.16mi |
| 3 Basin Elm San Antonio, TX | 3.0 | 2.0 | 1437 | $1,715 | $1.19 | 20d | 1 | 1.17mi |
| 160 Booker Palm San Antonio, TX | 3.0 | 2.5 | 1721 | $1,610 | $0.94 | 4d | 1 | 1.17mi |
| 9410 Fulwood Trl San Antonio, TX | 3.0 | 2.0 | 1210 | $1,425 | $1.18 | 22d | 1 | 1.19mi |
| 18 Anchorage Bay San Antonio, TX | 3.0 | 2.5 | 1585 | $1,750 | $1.10 | 22d | 1 | 1.19mi |
| 9839 Logans Ridge Dr Converse, TX | 4.0 | 2.5 | 1988 | $1,695 | $0.85 | 4d | 1 | 1.20mi |
| 9934 Hazy Bnd Unit 101 San Antonio, TX | 3.0 | 2.5 | 1225 | $1,400 | $1.14 | 43d | 1 | 1.22mi |
| 9934 Hazy Bnd Unit 104 San Antonio, TX | 3.0 | 2.5 | 1225 | $1,675 | $1.37 | 43d | 1 | 1.22mi |
| 9934 Hazy Bnd San Antonio, TX | 3.0 | 2.5 | 1225 | $1,538 | $1.26 | 3d | 2 | 1.22mi |
| 9806 Pebble Ridge Dr Converse, TX | 3.0 | 3.0 | 2131 | $1,850 | $0.87 | 43d | 1 | 1.22mi |
HOA detail
- Monthly dues
- $333 · $3,996/yr
- Likely covers
- internetcablepoolgymsecurity
Listing history 2 events
-
2026-02-27$125,000 New 500-char remark
Show marketing remark (500 chars)
Beautiful 3BR/2.5BA townhouse in the gated community of Crown Ridge offering 1,680 sqft of well designed living space. All bedrooms are located upstairs, with the main level featuring a spacious kitchen, living room, two dining areas, and a down stairs laundry for added convenience. Hoa includes high speed internet and cable provided by Spectrum. Community amenities include a pool, fitness center, park, and clubhouse. This property offers comfort, convenience, and community all in one place.
-
2001-06-06soldstatus
ⓘ Source: listings_history table (triggers on properties + properties_extension) + one-shot
backfill from property_details.listing_events for pre-trigger history.
Tax reassessment forecast TX · Resets to sale price
- Current annual tax
- $3,789 · $316/mo
- Projected year-2 tax
- $3,789 · $316/mo
- Expected delta
- $0/yr ($0/mo · 0.0%)
ⓘ Screening estimate from a state-policy table — verify with the county assessor before closing.
Climate risk First Street
- Flood 1/10 Low FEMA zone X (unshaded) · 0% chance over 30 yrs
- Wildfire 1/10 Low
- Heat 8/10 Severe 6 d/yr ≥107°F today · 18 d/yr by 30 yrs out
- Wind 8/10 Severe 80% chance of damaging wind over 30 yrs
- Air quality 2/10 Low 0 unhealthy d/yr today · 1 by 30 yrs out
Nearby sold comps map
Loading sold comps map…
Walkable amenities ~0.75 mi
Loading nearby amenities…
Taxation est. · year 1
- Rental income
- $20,118
- − Mortgage interest
- −$7,002
- − Property taxes
- −$3,789
- − Insurance
- −$625
- − Repairs & maintenance
- −$1,609
- − Management
- −$1,609
- − HOA
- −$3,996
- − Depreciation
- −$3,636
- Taxable loss
- −$2,149
- Est. tax savings @ 24.0%
- +$516
- After-tax cash flow
- $133/yr
For passive investors: Depreciation is non-cash, so a rental often shows a tax loss while cash-flowing — sheltering income. Rental losses are passive: they offset passive income freely, and up to $25,000/yr can offset ordinary (W-2) income if you actively participate and your MAGI is under $100k (phasing out to $0 by $150k); unused losses carry forward. On sale, claimed depreciation is recaptured at up to 25%, and gains may owe capital-gains tax (a 1031 exchange can defer both). Figures are a year-1 estimate at your 24.0% rate — not tax advice; consult a CPA.
Schools (NCES district)
- District
- North East ISD
- NCES district ID
- 4832940
- Math proficiency
- 38% ▼ -14.00%
- Reading proficiency
- 49% ▼ -4.00%
- Median HH income
- $57,715
- Composite
- 38.1/100
- National rank
- #4276
- State rank
- #276 of 826 in TX
Livability — San Antonio
- Score
- 80/100
- State rank
- #31
- US rank
- #1616
Category grades
Schools grade is shown separately in the Schools card above.
Census & demographics
- Census place
- San Antonio, TX
- County
- Bexar County · 1,990,555 people
- City population
- 1,806,925
- Metro
- San Antonio-New Braunfels, TX
- Population (ZIP)
- 28,609
- Household income
- $70,098
- Rent vs Own
- Severe rent burden
- 488.0
Population outlook (Bexar County) Hauer SSP2
- Today (2025)
- 2,336,851 people
- By 2030
- 2,560,728 · +9.6%
- By 2040
- 3,020,569 · +29.3%
- By 2050
- 3,493,522 · +49.5%
- By 2075
- 4,668,459 · +99.8%
- By 2100
- 5,533,242 · +136.8%
Race, ethnicity, and origin ACS 2023
- Neighborhood character
- Diverse neighborhood (Simpson 0.66)
- Race & ethnicity
- Hispanic / Latino 47% White 30% Two or more races 20% Black 16% Asian 4% Pacific Islander 2%
- Hispanic origin (detail)
- Mexican 38% Puerto Rican 4%
- Common ancestry
- Lithuanian 2% Romanian 1% Slovak 1%
- Foreign-born
- 13% · Canada, Vietnam, Jamaica
- Languages at home
- 72% English-only · Spanish 24% Vietnamese 1% Chinese 1%
Political lean MEDSL · Bexar
- 2024 margin
- Lean D (+9.8) · D 54.3% · R 44.6% · Other 1.1%
- 2008→2024 swing
- +4.2pp toward D · 2008: 5.6pp · 2024: 9.8pp
- All cycles
- 2024: D+9.8 2020: D+18.2 2016: D+13.5 2012: D+4.6 2008: D+5.6
Not yet ingested
- Civics
- —
Market trends
- HPI YoY
- ▼ -15.13%
- Current HPI
- 242.1272
- Rent YoY
- ▼ -1.05%
- Metro
- San Antonio-New Braunfels, TX
- State GDP YoY
- ▲ 3.95%
- F500 in state
- 110
Industry mix (Fortune 500 HQ in TX)
| Industry | F500 HQs | Revenue |
|---|---|---|
| Energy | 16 | $1,198B |
|
||
| Technology | 5 | $198B |
|
||
| Engineering / Construction | 4 | $72B |
|
||
| Energy Services | 3 | $60B |
|
||
| Utilities | 3 | $41B |
|
||
| Healthcare | 2 | $330B |
|
||
Price history
2 events — show timeline
- 2026-02-27 Listed $125,000 LERA
- 2001-06-06 Sold (Public Records) — Public Records
Property tax history
+4.7%/yrLatest (2025): $3,789 · -0.8% YoY. Source: county tax records.
Cash-flow waterfall
monthlySold comps — $/sqft
last 12 mo · ≤1 miLoading sold comps…