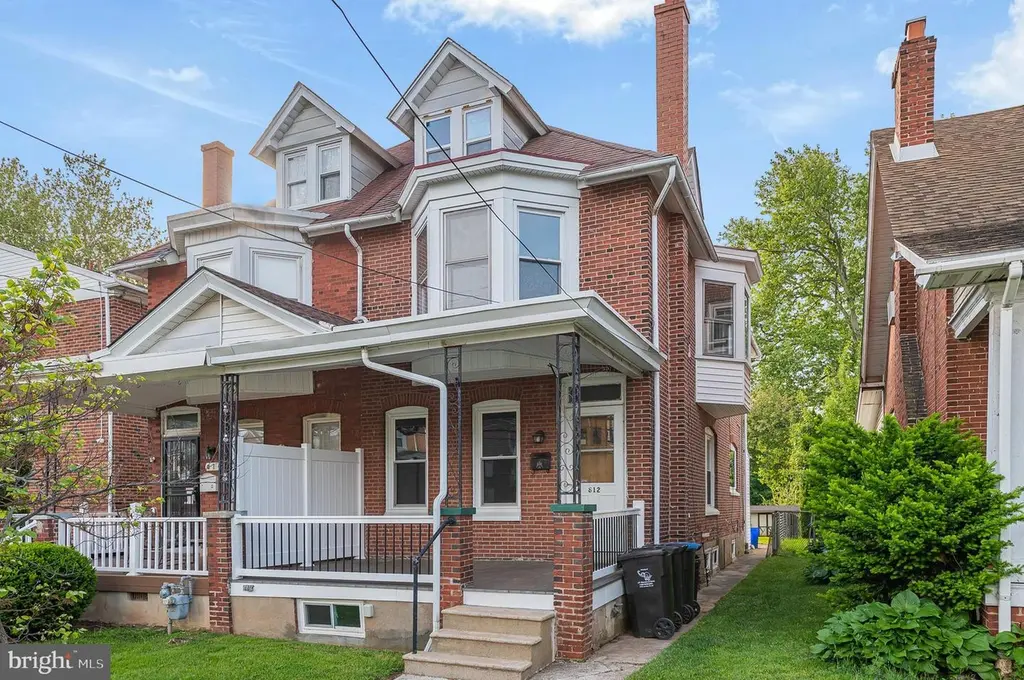
812 Stanbridge St · Norristown, PA
Flood risk 1/10 · Minimal
- FEMA flood zone
- X (unshaded)
- Chance of flooding over 30 yrs
- 0.0%
- Est. flood insurance / yr
- $473 – $860
Fire risk 1/10 · Minimal
- Est. fire insurance / yr
- $511 – $949
Heat risk 6/10 · Moderate
- Hot days now (above 102°F)
- 7 days/yr
- Hot days in 30 yrs
- 15 days/yr
Wind risk 6/10 · Moderate
- Chance of severe wind over 30 yrs
- 27.0%
Air-quality risk 4/10 · Minor
- Unhealthy air days now
- 5 days/yr
- Unhealthy air days in 30 yrs
- 8 days/yr
Risk factors via First Street. Map © Google.
Why this score? — see what drove the B- grade
The composite is a weighted blend of 9 inputs, each scored 0–100. Each bar is that input's sub-score; the figure is the points it added to the 100-point composite (weight × sub-score).
- Cash flow +23.5/30.0
- ARV discount +15.0/15.0
- 1% rule +7.5/10.0
- DSCR +7.5/10.0
- Livability +4.2/5.0
- Rent growth +2.8/5.0
- Condition / age +2.5/5.0
- Schools +2.2/10.0
- Appreciation +0.0/10.0
$199,900
🖨 Deal sheet 📄 Offer letter ✓ Due diligence
Listing remarks
Welcome to 812 Stanbridge St in Norristown! This spacious brick twin offers a fantastic opportunity to add your own style and updates. Currently configured as a 4-bedroom home, Inside, you’ll find spacious living and dining areas filled with natural light, Great size kitchen, convenient main-floor laundry, generously sized bedrooms, and a full basement offering plenty of storage space. Step outside to your private rear yard, perfect for relaxing, entertaining, gardening, and more. With classic brick construction and plenty of interior space, this home is full of potential. Conveniently located near major routes, shopping, dining, parks, and everyday essentials. The convenience of the
Key facts
- Private rear yard
- Full basement
- Great size kitchen
Tags
Property features AI
Exterior
- Parking: On-street parking
- Utilities: Public water; Public sewer
- Home design: Brick construction; Permanent foundation; Above-grade and below-grade structures
- Construction: Brick exterior
- Exterior features: Semi-detached property; Lot dimensions approximately 19.00 x 0.00; No tidal water
Interior
- Bedrooms: Three bedrooms on the first upper level; One bedroom on the second upper level
- Bathrooms: One full bathroom (total)
- Heating & cooling: Central heating; Oil-fired heat; Electric hot water
- Interior features: Full basement; Finished above-grade living area per assessor
Neighborhood map
What this means for you Summary
Snapshot
- This is a 5-bed/1.0-bath single-family listed at $200k.
Deal economics
- At list price, monthly cash flow is $372 ($4k/yr) — positive.
- The deal already cash-flows at list — no discount required.
- Meets the 1% rule at list price ($2k rent vs $200k).
- Cap rate 8.5% vs local median 4.5% in Norristown — top-decile yield for the area; either an underpriced asset or a hidden risk that comps aren't pricing in. Stress-test before assuming the spread holds.
Location & tenants
- Location reads 84/100 on livability (#100 in PA, #720 nationally) — a professional / high-income tenant draw. Strengths: amenities A+, commute A+, cost of living A+; Watch: schools C-, crime D-.
- Norristown Area SD (suburban): math 18% / reading 31% proficiency, ranked #466 of 539 in PA (top 86%) — low school quality limits family demand, transient renter base, plan for 1-2y turnover; 70% free/reduced lunch — lower-income household profile, screen leases tightly.
- Market conditions: Rents rising (+1.3%/yr); 164 active listings in the ZIP; 9 comparable units currently listed for rent nearby; rentals at typical pace (median 25d on market — plan ~3-4 weeks tenant-placement turnaround); 44% of comp listings sitting > 30 days — soft ceiling on asking rent; 1,936 units permitted in Montgomery County in 2024 (530 in 5+ unit buildings).
- This rent runs 43% of the median local income ($70k/yr) — at the standard rent-burdened threshold; future hikes will face affordability resistance.
Forward outlook
- Local home prices are declining (-3.0%/yr); year-one equity from $1k of loan paydown is wiped out by about $6k of value loss. Plan a longer hold.
- Montgomery County population projected at +5% by 2050 — modest demand growth; plan on rents tracking national, not racing it.
Negotiation context
- Only 2 days on market — expect competitive offers; lowballing is unlikely to land.
Risks & watch-outs
- Watch-outs: property tax is 2.8% of price; built in 1915 — expect roof / HVAC / electrical / plumbing capex.
- Climate carrying-cost: major wind risk, 27% chance of damaging wind over 30y; extreme-heat days projected 7→15/yr by 2055 (HVAC capex compounding) — expect insurance premiums to compound above CPI over the hold.
Questions for the listing agent
- Built in 1915 — when were the roof, HVAC, electrical panel, plumbing, and water heater last replaced?
- Property tax is high relative to price — has the assessment been appealed recently, and will the sale trigger a re-assessment?
- Is there a deadline driving the sale (1031 exchange, divorce, estate, relocation)? That informs how much negotiation room exists.
- Crime grade is D in this area — have there been break-ins, vandalism, or insurance claims at this property in the last 3 years? What carrier currently insures it and at what premium?
- What's the average days-on-market for RENTAL listings here right now (not sales)? A rising rental-DOM trend means longer vacancies and softer asking-rent achievability than the comps imply.
- What's the recent tenant-quality profile in this submarket — average credit score on applications, eviction rate, late-payment / NSF rate, and stable-employment percentage? A property-management company in the area should have these aggregated.
- How much new for-sale + rental construction is in the pipeline within 1–3 miles? Heavy new supply typically softens prices + rents 12–24 months out; constrained supply supports both.
Investment metrics
- 1% rule
- 1.25% ✓
- Cap rate
- 8.52%
- Cash-on-cash
- 7.97%
- DSCR
- 1.35
- GRM
- 6.7
CMA / ARV
- ARV (on-the-fly)
- $387,945
- Comps found
- 6
Show comp detail 6 sales within ~0.75 mi
| Address | Dist | Beds/Ba | Sqft | Sold | Price | $/sf | Match |
|---|---|---|---|---|---|---|---|
| 1000 Sterigere St | 0.25mi | 4/2.0 (-1) | 1,600 (-4%) | 8mo | $300,000 | $188 | 66 |
| 1506 Marshall | 0.73mi | 4/1.5 (-1) | 1,764 (+6%) | 6mo | $331,500 | $188 | 44 |
| 404 W Fornance St Unit 2 | 0.52mi | 4/2.0 (-1) | 1,610 (-3%) | 23mo | $375,000 | $233 | 42 |
| 1402 Sterigere | 0.54mi | 4/2.0 (-1) | 1,440 (-14%) | 2mo | $420,000 | $292 | 42 |
| 202 Buttonwood St | 0.69mi | 4/1.5 (-1) | 1,480 (-11%) | 15mo | $168,000 | $114 | 29 |
| 1437 Pine St | 0.71mi | 4/1.0 (-1) | 1,432 (-14%) | 20mo | $347,000 | $242 | 22 |
Match score weights: distance 35% · size 25% · config 20% · recency 20%. Top-matched comps best support the ARV.
Projected returns pro-forma
-3.0% appreciation · 1.29% rent growth · sell at horizon
- IRR
- -6.3%
- Equity multiple
- 0.77×
- Total profit
- $-12,777
- Equity at exit
- $29,806
- IRR
- 0.9%
- Equity multiple
- 1.06×
- Total profit
- $3,309
- Equity at exit
- $17,284
Cash invested: $55,972 (down + closing). Projections, not guarantees.
Landlord ↔ Tenant lean methodology
- Overall (STATE)
- 62 Landlord-Friendly
- State Pennsylvania
- 62 Landlord-Friendly · EVEN
- County
- — inherits STATE
- City
- — inherits STATE
ZIP-level market 19401
- Rents YoY
- 1.3%
- Active inventory
- 164
- Price-to-rent
- 6.7×
Monthly cashflow live
- Estimated rent
- $2,495 high interval (Pro) →
- Mortgage (P&I)
- −$1,048
- Tax from tax record
- −$468 /mo · $5,612/yr
- Insurance
- −$83
- HOA
- −$0
- Vacancy / Maint / Mgmt
- −$524
- Net cashflow
- $372
Break-even live
UW: 25.0% down · 7.5% · 30yr · 1.5% tax · 5.0% vac · 8.0% maint · 8.0% mgmt
Financing live
Cash to close
- Down payment
- $49,975
- Closing costs
- $5,997
- Reserves months
- —
- Total cash needed
- —
Loan-product check · same deal, 3 products live
Conventional
25% down · 7.5% · 30yr
- Down + closing
- —
- Monthly P&I
- —
- Monthly cashflow
- —
- DSCR
- —
- Eligible?
- —
Personal DTI + credit; lowest rate.
DSCR
20% down · 8.5% · 30yr
- Down + closing
- —
- Monthly P&I
- —
- Monthly cashflow
- —
- DSCR
- —
- Eligible?
- —
No personal income docs; deal must DSCR.
Hard money
10% down · 12.0% · 12mo
- Down + closing
- —
- Monthly P&I
- —
- Monthly cashflow
- —
- DSCR
- —
- Eligible?
- —
Short-term bridge; refi at stabilization.
Rent comps 9 comps
| Address | Beds | Baths | Sqft | Rent | $/sqft | DOM | Units | Dist |
|---|---|---|---|---|---|---|---|---|
| 712 George St Unit 2 Norristown, PA | 4.0 | 1.0 | 1485 | $2,500 | $1.68 | 44d | 1 | 0.28mi |
| 533 Buttonwood St Norristown, PA | 5.0 | 2.0 | 1888 | $2,300 | $1.22 | 15d | 1 | 0.41mi |
| 540 George St Norristown, PA | 5.0 | 2.0 | 2054 | $2,595 | $1.26 | 24d | 1 | 0.43mi |
| 126 W Elm St Norristown, PA | 4.0 | 1.5 | 1500 | $2,000 | $1.33 | 15d | 1 | 0.51mi |
| 134 W Airy St Norristown, PA | 4.0 | 1.0 | 1116 | $3,036 | $2.72 | 44d | 1 | 0.69mi |
| 534 Green St Norristown, PA | 4.0 | 1.0 | 1612 | $1,800 | $1.12 | 22d | 1 | 0.90mi |
| 217 E Marshall St Norristown, PA | 5.0 | 1.5 | 2142 | $2,450 | $1.14 | 4d | 1 | 0.90mi |
| 221 E Wood St Norristown, PA | 4.0 | 1.0 | 1527 | $2,277 | $1.49 | 44d | 1 | 0.91mi |
| 1809 Chain St Norristown, PA | 4.0 | 2.0 | 1344 | $2,800 | $2.08 | 44d | 1 | 0.99mi |
Listing history 2 events
-
2026-05-16status Pending
-
2026-05-13$199,900 Active
ⓘ Source: listings_history table (triggers on properties + properties_extension) + one-shot
backfill from property_details.listing_events for pre-trigger history.
Tax reassessment forecast PA · Partial reset (capped growth)
- Current annual tax
- $5,612 · $468/mo
- Projected year-2 tax
- $5,612 · $468/mo
- Expected delta
- $0/yr ($0/mo · 0.0%)
ⓘ Screening estimate from a state-policy table — verify with the county assessor before closing.
Climate risk First Street
- Flood 1/10 Low FEMA zone X (unshaded) · 0% chance over 30 yrs
- Wildfire 1/10 Low
- Heat 6/10 Major 7 d/yr ≥102°F today · 15 d/yr by 30 yrs out
- Wind 6/10 Major 27% chance of damaging wind over 30 yrs
- Air quality 4/10 Moderate 5 unhealthy d/yr today · 8 by 30 yrs out
Nearby sold comps map
Loading sold comps map…
Walkable amenities ~0.75 mi
Loading nearby amenities…
Taxation est. · year 1
- Rental income
- $29,936
- − Mortgage interest
- −$11,198
- − Property taxes
- −$5,612
- − Insurance
- −$1,000
- − Repairs & maintenance
- −$2,395
- − Management
- −$2,395
- − Depreciation
- −$5,815
- Taxable income
- $1,522
- Est. tax owed @ 24.0%
- −$365
- After-tax cash flow
- $4,093/yr
For passive investors: Depreciation is non-cash, so a rental often shows a tax loss while cash-flowing — sheltering income. Rental losses are passive: they offset passive income freely, and up to $25,000/yr can offset ordinary (W-2) income if you actively participate and your MAGI is under $100k (phasing out to $0 by $150k); unused losses carry forward. On sale, claimed depreciation is recaptured at up to 25%, and gains may owe capital-gains tax (a 1031 exchange can defer both). Figures are a year-1 estimate at your 24.0% rate — not tax advice; consult a CPA.
Schools (NCES district)
- District
- Norristown Area SD
- NCES district ID
- 4216980
- Math proficiency
- 18% ▼ -11.00%
- Reading proficiency
- 31% ▼ -14.00%
- Median HH income
- $56,024
- Composite
- 22.17/100
- National rank
- #8166
- State rank
- #466 of 539 in PA
Livability — Norristown
- Score
- 84/100
- State rank
- #100
- US rank
- #720
Category grades
Schools grade is shown separately in the Schools card above.
Census & demographics
- Census place
- Norristown, PA
- County
- Montgomery County · 712,331 people
- City population
- 87,376
- Metro
- Philadelphia-Camden-Wilmington, PA-NJ-DE-MD
- Population (ZIP)
- 43,359
- Household income
- $69,908
- Rent vs Own
- Severe rent burden
- 2725.0
Population outlook (Montgomery County) Hauer SSP2
- Today (2025)
- 856,074 people
- By 2030
- 870,887 · +1.7%
- By 2040
- 891,195 · +4.1%
- By 2050
- 896,417 · +4.7%
- By 2075
- 903,212 · +5.5%
- By 2100
- 843,240 · -1.5%
Race, ethnicity, and origin ACS 2023
- Neighborhood character
- Highly diverse neighborhood (Simpson 0.72)
- Race & ethnicity
- White 33% Black 29% Hispanic / Latino 29% Two or more races 16% Asian 3% Native American 2%
- Hispanic origin (detail)
- Mexican 16% Puerto Rican 5% Dominican 2%
- Common ancestry
- Romanian 3% Slovak 1%
- Foreign-born
- 17% · Canada, Jamaica, South Korea
- Languages at home
- 71% English-only · Spanish 22% Other Indo-European 2% Russian/Polish/Slavic 1%
Political lean MEDSL · Montgomery
- 2024 margin
- Strong D (+22.8) · D 60.9% · R 38.1% · Other 1.1%
- 2008→2024 swing
- +2.0pp toward D · 2008: 20.8pp · 2024: 22.8pp
- All cycles
- 2024: D+22.8 2020: D+26.3 2016: D+21.1 2012: D+14.3 2008: D+20.8
Not yet ingested
- Civics
- —
Market trends
- HPI YoY
- ▼ -203.75%
- Current HPI
- 301.7748
- Rent YoY
- ▲ 1.29%
- Metro
- Philadelphia-Camden-Wilmington, PA-NJ-DE-MD
- State GDP YoY
- ▲ 1.68%
- F500 in state
- 34
Industry mix (Fortune 500 HQ in PA)
| Industry | F500 HQs | Revenue |
|---|---|---|
| Healthcare | 2 | $309B |
|
||
| Insurance | 2 | $27B |
|
||
| Telecommunications / Media | 1 | $124B |
|
||
| Industrial Distribution | 1 | $22B |
|
||
| Financial Services | 1 | $20B |
|
||
| Chemicals / Materials | 1 | $18B |
|
||
Price history
2 events — show timeline
- 2026-05-16 Pending — BRIGHT MLS
- 2026-05-13 Listed $199,900 BRIGHT MLS
Property tax history
+2.6%/yrLatest (2026): $5,612 · +2.3% YoY. Source: county tax records.
Cash-flow waterfall
monthlySold comps — $/sqft
last 12 mo · ≤1 miLoading sold comps…