 Duplex
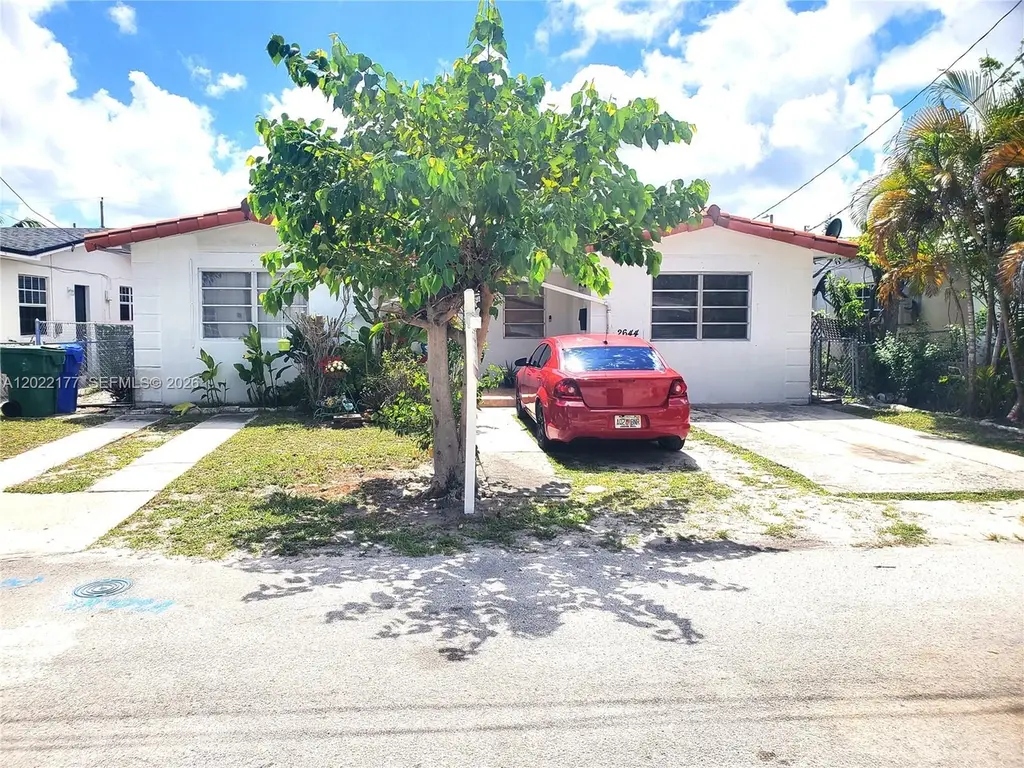
2644 SW 28th Ct · Miami, FL
Flood risk 1/10 · Minimal
- FEMA flood zone
- X (unshaded)
- Chance of flooding over 30 yrs
- 0.0%
- Est. flood insurance / yr
- $507 – $1,088
Fire risk 1/10 · Minimal
- Est. fire insurance / yr
- $947 – $1,759
Heat risk 10/10 · Severe
- Hot days now (above 104°F)
- 6 days/yr
- Hot days in 30 yrs
- 24 days/yr
Wind risk 10/10 · Severe
- Chance of severe wind over 30 yrs
- 99.0%
Air-quality risk 2/10 · Minimal
- Unhealthy air days now
- 1 days/yr
- Unhealthy air days in 30 yrs
- 1 days/yr
Risk factors via First Street. Map © Google.
Why this score? — see what drove the B- grade
The composite is a weighted blend of 9 inputs, each scored 0–100. Each bar is that input's sub-score; the figure is the points it added to the 100-point composite (weight × sub-score).
- Cash flow +29.6/30.0
- DSCR +10.0/10.0
- 1% rule +8.2/10.0
- ARV discount +7.5/15.0
- Schools +4.2/10.0
- Livability +3.9/5.0
- Rent growth +3.2/5.0
- Condition / age +2.5/5.0
- Appreciation +0.0/10.0
$529,000
🖨 Deal sheet (PDF) 📄 Offer letter ✓ Due diligence
Multi-family units
County records classify this as Multi-Family (2-4 Unit). Listing-text estimate: 2 units. confirmed
Listing remarks
Location, Location, Location! Close to Coconut Grove, the Beaches inside the City of Miami. Great opportunity to own this magnificent 1 story duplex in the desirable South Bay Community in the heart of Miami. This income-producing property is a two unit duplex with 1/1 each side, tenants pay for water, electricity and cable. making it an excellent investment opportunity. Seller is retiring. CASH BUYERS ONLY! Property is tenant-occupied. Please call listing agent for appointments and additional details. A minimum 48-hour notice is required for all showings. Please do not disturb the tenants.
Key facts
- Two unit duplex
- 4 parking spots
- Built 1963
Tags
Property features AI
Finance
- Financial info: Rent includes trash collection; Units are rented month-to-month; Typical rent shown: $1,500 per unit
Exterior
- Parking: Total of 4 parking spaces
- Utilities: Public water; Septic tank sewer; Cable available
- Home design: Single-story building; Hotel-room style units; Resale property; Barrel roof
- Construction: Block construction; Barrel roof
- Exterior features: Less than quarter acre lot
Interior
- Kitchen: Kitchens in units
- Bedrooms: Four 1-bedroom hotel-style units (each unit described as a hotel room)
- Flooring: Ceramic tile
- Bathrooms: Four full bathrooms (one per unit)
- Heating & cooling: Wall furnaces; Wall/window air conditioning units
- Interior features: Ceramic tile flooring
- Laundry & utility: Parking space and utility areas per unit (unit descriptions note parking space)
Neighborhood map
What this means for you Summary
Snapshot
- This is a 2 × 1-bed/1-bath units multifamily listed at $529k.
Deal economics
- At list price, monthly cash flow is $2k ($23k/yr) — positive. Per door: $952/mo.
- The deal already cash-flows at list — no discount required.
- Meets the 1% rule at list price ($7k rent vs $529k).
- Recommended offer: $521k (1.5% below list) — sets the bar for market timing.
- Cap rate 10.6% vs local median 1.9% in Miami — top-decile yield for the area; either an underpriced asset or a hidden risk that comps aren't pricing in. Stress-test before assuming the spread holds.
Location & tenants
- Location reads 78/100 on livability (#177 in FL, #2,724 nationally) — a middle-class / working-renter tenant base. Strengths: amenities A+, commute A+, health & safety A+; Watch: employment C-, crime F, cost of living F.
- Miami-Dade (suburban): math 45% / reading 54% proficiency, ranked #40 of 73 in FL (top 55%) — families likely to look elsewhere, expect single-tenant / working-renter base with shorter leases; 64% free/reduced lunch — lower-income household profile, screen leases tightly.
- Market conditions: Rents rising (+2.7%/yr); 452 active listings in the ZIP; 4 comparable units currently listed for rent nearby; rentals at typical pace (median 26d on market — plan ~3-4 weeks tenant-placement turnaround); solid renter incomes; 10,051 units permitted in Miami-Dade County in 2024 (7,758 in 5+ unit buildings).
- At $6,989/mo this rent would consume 81% of the median local household income ($103k/yr) (locally 2105% of renters already pay >50% of income on rent) — very limited rent-growth headroom before tenants either downsize or default.
Forward outlook
- Local home prices are declining (-3.0%/yr); year-one equity from $4k of loan paydown is wiped out by about $16k of value loss. Plan a longer hold.
- Miami-Dade County population projected at +28% by 2050 — long-run rental-demand tailwind backs the buy-and-hold thesis.
- At projected returns (-3.0% appreciation + 2.7% rent growth), your $148k cash investment doubles in ~8 years — after that, you're playing with house money.
Negotiation context
- It's been on market 19 days — a 2% lower offer ($521k) is reasonable based on typical stale-listing flexibility.
- Current owner paid $32k; list at $529k implies a 1528% gain — meaningful room to come down on a strong offer.
Risks & watch-outs
- Climate carrying-cost: severe wind risk, 99% chance of damaging wind over 30y; extreme-heat days projected 6→24/yr by 2055 (HVAC capex compounding) — expect insurance premiums to compound above CPI over the hold.
Questions for the listing agent
- Can we see the unit-by-unit rent roll, current vacancy, and any below-market leases? What's the average tenancy length?
- What capital expenditures (roof, boiler, parking lot, exteriors) have been made in the last 5 years, and what's planned in the next 2?
- Built in 1963 — when were the roof, HVAC, electrical panel, plumbing, and water heater last replaced?
- Is there a deadline driving the sale (1031 exchange, divorce, estate, relocation)? That informs how much negotiation room exists.
- Schools are B-rated — typically a magnet for longer-tenancy family renters. What's the average tenant stay here, and is there a school-zone premium baked into asking?
- Crime grade is F in this area — have there been break-ins, vandalism, or insurance claims at this property in the last 3 years? What carrier currently insures it and at what premium?
- What's the average days-on-market for RENTAL listings here right now (not sales)? A rising rental-DOM trend means longer vacancies and softer asking-rent achievability than the comps imply.
- What's the recent tenant-quality profile in this submarket — average credit score on applications, eviction rate, late-payment / NSF rate, and stable-employment percentage? A property-management company in the area should have these aggregated.
- How much new apartment / multifamily construction is in the pipeline within 1–3 miles? Heavy new supply (>2% of stock underway) typically softens rents 12–24 months out; light construction supports rent growth.
Investment metrics
- 1% rule
- 1.32% ✓
- Cap rate
- 10.61%
- Cash-on-cash
- 15.43%
- DSCR
- 1.69
- GRM
- 6.3
CMA / ARV
No comps found within radius.
Projected returns pro-forma
-3.0% appreciation · 2.72% rent growth · sell at horizon
- IRR
- 5.9%
- Equity multiple
- 1.23×
- Total profit
- $33,685
- Equity at exit
- $78,876
- IRR
- 15.0%
- Equity multiple
- 2.20×
- Total profit
- $177,828
- Equity at exit
- $45,738
Cash invested: $148,120 (down + closing). Projections, not guarantees.
Landlord ↔ Tenant lean methodology
- Overall (STATE)
- 87 Strongly Landlord-Friendly
- State Florida
- 87 Strongly Landlord-Friendly · R+3
- County
- — inherits STATE
- City
- — inherits STATE
ZIP-level market 33133
- Rents YoY
- 2.7%
- Active inventory
- 452
- Price-to-rent
- 12.6×
Monthly cashflow live
- Estimated rent
- $6,989 medium interval (Pro) →
- Mortgage (P&I)
- −$2,774
- Tax from tax record
- −$622 /mo · $7,469/yr
- Insurance
- −$220
- HOA
- −$0
- Vacancy / Maint / Mgmt
- −$1,468
- Net cashflow
- $1,904
Break-even live
Sensitivity live
| Price | -10% $2,204 | -5% $2,054 | +0% $1,904 | +5% $1,755 | +10% $1,605 |
|---|---|---|---|---|---|
| Rent | -10% $1,352 | -5% $1,628 | +0% $1,904 | +5% $2,180 | +10% $2,456 |
| Rate | -1.0pp $2,171 | -0.5pp $2,039 | base $1,904 | +0.5pp $1,767 | +1.0pp $1,628 |
2-unit breakdown (identical units grouped — click to expand)
| Units | Beds | Baths | Est. rent |
|---|---|---|---|
| 2× units | 1 | 1 | $6,990 |
| #1 | 1 | 1 | $3,495 |
| #2 | 1 | 1 | $3,495 |
| Total (2 units) | $6,989 | ||
UW: 25.0% down · 7.5% · 30yr · 1.5% tax · 5.0% vac · 8.0% maint · 8.0% mgmt
Financing live
Cash to close
- Down payment
- $132,250
- Closing costs
- $15,870
- Reserves months
- —
- Total cash needed
- —
Loan-product check · same deal, 3 products live
Conventional
25% down · 7.5% · 30yr
- Down + closing
- —
- Monthly P&I
- —
- Monthly cashflow
- —
- DSCR
- —
- Eligible?
- —
Personal DTI + credit; lowest rate.
DSCR
20% down · 8.5% · 30yr
- Down + closing
- —
- Monthly P&I
- —
- Monthly cashflow
- —
- DSCR
- —
- Eligible?
- —
No personal income docs; deal must DSCR.
Hard money
10% down · 12.0% · 12mo
- Down + closing
- —
- Monthly P&I
- —
- Monthly cashflow
- —
- DSCR
- —
- Eligible?
- —
Short-term bridge; refi at stabilization.
Rent comps 4 comps
| Address | Beds | Baths | Sqft | Rent | $/sqft | DOM | Units | Dist |
|---|---|---|---|---|---|---|---|---|
| 2669 S Bayshore Dr Unit 702N Miami, FL | 3.0 | 3.5 | 1845 | $23,500 | $12.74 | 25d | 1 | 0.87mi |
| 2678 Tigertail Ave #301 Miami, FL | 3.0 | 3.5 | 1711 | $20,500 | $11.98 | 25d | 1 | 0.87mi |
| 1710 SW 27th Ave Unit 1272101P Miami, FL | 1.0–5.0 | 1.0–4.0 | 1716 | $7,851 | $4.57 | 9d | 3 | 0.88mi |
| 2601 Salzedo St Coral Gables, FL | 2.0–3.0 | 2.5–4.5 | 2236 | $8,200 | $3.67 | 0d | 77 | 1.29mi |
Listing history 9 events
-
2026-06-08status $529,000 Pending 19 DOM
-
2026-06-07days on market $529,000 Active 19 DOM
-
2026-06-04days on market $529,000 Active 16 DOM
-
2026-06-03days on market $529,000 Active 15 DOM
-
2026-06-02days on market $529,000 Active 14 DOM
-
2026-06-01days on market $529,000 Active 13 DOM
-
2026-05-31days on market $529,000 Active 12 DOM
-
2026-05-19$529,000 Active
-
1973-02-01soldstatus $32,500
ⓘ Source: listings_history table (triggers on properties + properties_extension) + one-shot
backfill from property_details.listing_events for pre-trigger history.
Tax reassessment forecast FL · Resets to sale price
- Current annual tax
- $7,469 · $622/mo
- Projected year-2 tax
- $7,469 · $622/mo
- Expected delta
- $0/yr ($0/mo · 0.0%)
ⓘ Screening estimate from a state-policy table — verify with the county assessor before closing.
Climate risk First Street
- Flood 1/10 Low FEMA zone X (unshaded) · 0% chance over 30 yrs
- Wildfire 1/10 Low
- Heat 10/10 Extreme 6 d/yr ≥104°F today · 24 d/yr by 30 yrs out
- Wind 10/10 Extreme 99% chance of damaging wind over 30 yrs
- Air quality 2/10 Low 1 unhealthy d/yr today · 1 by 30 yrs out
Nearby sold comps map
Loading sold comps map…
Walkable amenities ~0.75 mi
Loading nearby amenities…
Taxation est. · year 1
- Rental income
- $83,868
- − Mortgage interest
- −$29,632
- − Property taxes
- −$7,469
- − Insurance
- −$2,645
- − Repairs & maintenance
- −$6,709
- − Management
- −$6,709
- − Depreciation
- −$15,389
- Taxable income
- $15,314
- Est. tax owed @ 24.0%
- −$3,675
- After-tax cash flow
- $19,177/yr
For passive investors: Depreciation is non-cash, so a rental often shows a tax loss while cash-flowing — sheltering income. Rental losses are passive: they offset passive income freely, and up to $25,000/yr can offset ordinary (W-2) income if you actively participate and your MAGI is under $100k (phasing out to $0 by $150k); unused losses carry forward. On sale, claimed depreciation is recaptured at up to 25%, and gains may owe capital-gains tax (a 1031 exchange can defer both). Figures are a year-1 estimate at your 24.0% rate — not tax advice; consult a CPA.
Schools (NCES district)
- District
- Miami-Dade
- NCES district ID
- 1200390
- Math proficiency
- 45% ▼ -16.00%
- Reading proficiency
- 54% ▼ -5.00%
- Median HH income
- $43,928
- Composite
- 41.76/100
- National rank
- #3397
- State rank
- #40 of 73 in FL
Livability — Miami
- Score
- 78/100
- State rank
- #177
- US rank
- #2724
Category grades
Schools grade is shown separately in the Schools card above.
Census & demographics
- Census place
- Miami, FL
- County
- Miami-Dade County · 2,697,751 people
- City population
- 827,308
- Metro
- Miami-Fort Lauderdale-Pompano Beach, FL
- Population (ZIP)
- 36,789
- Household income
- $103,420
- Rent vs Own
- Severe rent burden
- 2105.0
Population outlook (Miami-Dade County) Hauer SSP2
- Today (2025)
- 3,126,439 people
- By 2030
- 3,325,765 · +6.4%
- By 2040
- 3,697,561 · +18.3%
- By 2050
- 4,012,134 · +28.3%
- By 2075
- 4,605,612 · +47.3%
- By 2100
- 4,866,598 · +55.7%
Race, ethnicity, and origin ACS 2023
- Neighborhood character
- Diverse neighborhood (Simpson 0.58)
- Race & ethnicity
- Hispanic / Latino 57% Two or more races 38% White 28% Black 9% Asian 2%
- Hispanic origin (detail)
- Mexican 2% Puerto Rican 2% Cuban 22% Salvadoran 2%
- Common ancestry
- Lithuanian 3% Romanian 2% Scotch-Irish 2%
- Foreign-born
- 42% · Canada, Jamaica, Dominican Republic
- Languages at home
- 37% English-only · Spanish 53% Other Indo-European 4% French/Haitian/Cajun 3%
Political lean MEDSL · Miami-Dade
- 2024 margin
- R (+11.4) · D 43.9% · R 55.4%
- 2008→2024 swing
- -27.6pp toward R · 2008: 16.1pp · 2024: -11.4pp
- All cycles
- 2024: R+11.4 2020: D+7.3 2016: D+29.6 2012: D+23.7 2008: D+16.1
Not yet ingested
- Civics
- —
Market trends
- HPI YoY
- ▼ -997.74%
- Current HPI
- 460.9475
- Rent YoY
- ▲ 2.72%
- Metro
- Miami-Fort Lauderdale-Pompano Beach, FL
- State GDP YoY
- ▲ 3.28%
- F500 in state
- 36
Industry mix (Fortune 500 HQ in FL)
| Industry | F500 HQs | Revenue |
|---|---|---|
| Industrial Technology | 2 | $29B |
|
||
| Insurance | 2 | $17B |
|
||
| Retail | 1 | $60B |
|
||
| Technology Distribution | 1 | $58B |
|
||
| Homebuilding | 1 | $35B |
|
||
| Technology Manufacturing | 1 | $35B |
|
||
Price history
+1527.7% since first listed2 events — show timeline
- 2026-05-19 Listed $529,000 MARMLS
- 1973-02-01 Sold (Public Records) $32,500 Public Records
Property tax history
+7.1%/yrLatest (2025): $7,469 · +11.5% YoY. Source: county tax records.
Cash-flow waterfall
monthlySold comps — $/sqft
last 12 mo · ≤1 miLoading sold comps…