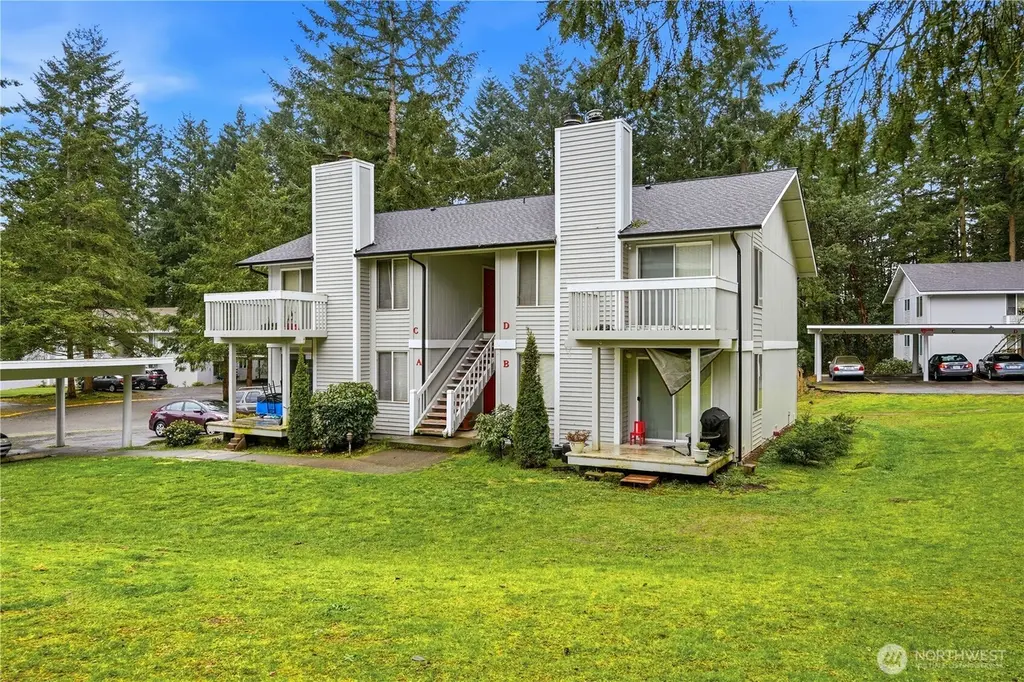
 Fourplex
34027 1st Pl S · Federal Way, WA
Flood risk 1/10 · Minimal
- FEMA flood zone
- X (unshaded)
- Chance of flooding over 30 yrs
- 0.0%
- Est. flood insurance / yr
- $507 – $1,088
Fire risk 1/10 · Minimal
- Est. fire insurance / yr
- $604 – $1,122
Heat risk 3/10 · Minor
- Hot days now (above 87°F)
- 7 days/yr
- Hot days in 30 yrs
- 15 days/yr
Wind risk 1/10 · Minimal
- Chance of severe wind over 30 yrs
- —
Air-quality risk 7/10 · Major
- Unhealthy air days now
- 10 days/yr
- Unhealthy air days in 30 yrs
- 11 days/yr
Risk factors via First Street. Map © Google.
Why this score? — see what drove the D grade
The composite is a weighted blend of 9 inputs, each scored 0–100. Each bar is that input's sub-score; the figure is the points it added to the 100-point composite (weight × sub-score).
- ARV discount +11.4/15.0
- Cash flow +9.9/30.0
- Schools +3.9/10.0
- Livability +3.6/5.0
- 1% rule +3.5/10.0
- Rent growth +3.1/5.0
- DSCR +2.8/10.0
- Condition / age +2.5/5.0
- Appreciation +0.0/10.0
$845,000
🖨 Deal sheet 📄 Offer letter ✓ Due diligence
Multi-family units
County records classify this as Multi-Family (2-4 Unit). Listing-text estimate: 4 units. confirmed
Listing remarks
Turnkey 4-plex opportunity in Federal Way! Strong rental fundamentals and major capital improvements already completed—ideal for both seasoned investors and those looking to expand their portfolio. This spacious property offers 3,056 rentable sq ft across four well-designed 2 bed / 1 bath units, all fully occupied, providing immediate and consistent income. Each unit features in-unit washer & dryer, dedicated covered parking, and comfortable living spaces that stay in demand which enhances tenant appeal and retention! The building envelope has been recently refreshed with significant exterior upgrades, including a new roof (2024) with warranty, new chimney chase cover, new gutte
Key facts
- New gutters
- 0.24 acre lot
- 4 parking spots
Tags
Neighborhood map
What this means for you Summary
Snapshot
- This is a 4 × 2-bed/1.0-bath units multifamily listed at $845k.
Deal economics
- At list price, monthly cash flow is $-522 ($-6k/yr) — negative. Per door: $-130/mo.
- To cash-flow at today's rent, offer at most $753k (10.9% below list).
- To meet the 1% rule (rent ≥ 1% of price), the offer needs to be $714k (15.4% below list).
- Recommended offer: $714k (15.4% below list) — sets the bar for 1% rule.
- Cap rate 5.6% vs local median 2.7% in Federal Way — top-decile yield for the area; either an underpriced asset or a hidden risk that comps aren't pricing in. Stress-test before assuming the spread holds.
Location & tenants
- Location reads 71/100 on livability (#221 in WA) — a middle-class / working-renter tenant base. Strengths: commute A+, housing A+, health & safety A+; Watch: schools C-, crime F, cost of living F.
- Federal Way School District (suburban): math 35% / reading 47% proficiency, ranked #207 of 291 in WA (top 71%) — families likely to look elsewhere, expect single-tenant / working-renter base with shorter leases.
- Market conditions: Rents rising (+2.3%/yr); 231 active listings in the ZIP; solid renter incomes; 10,555 units permitted in King County in 2024 (7,119 in 5+ unit buildings).
- At $7,145/mo this rent would consume 114% of the median local household income ($75k/yr) (locally 2895% of renters already pay >50% of income on rent) — very limited rent-growth headroom before tenants either downsize or default.
Forward outlook
- Local home prices are declining (-3.0%/yr); year-one equity from $6k of loan paydown is wiped out by about $25k of value loss. Plan a longer hold.
- King County population projected at +44% by 2050 — long-run rental-demand tailwind backs the buy-and-hold thesis.
Negotiation context
- It's been on market 90 days — a 6% lower offer ($794k) is reasonable based on typical stale-listing flexibility.
- Current owner paid $120k; list at $845k implies a 604% gain — meaningful room to come down on a strong offer.
Questions for the listing agent
- What do current leases actually rent for vs. the listed asking? Can we see a recent rent roll and the last 12 months of T-12 income?
- It's been on market 90 days. Have you received any prior offers? Is the seller open to a 15% concession, seller financing, or rate buy-down credit?
- Can we see the unit-by-unit rent roll, current vacancy, and any below-market leases? What's the average tenancy length?
- What capital expenditures (roof, boiler, parking lot, exteriors) have been made in the last 5 years, and what's planned in the next 2?
- Built in 1979 — when were the roof, HVAC, electrical panel, plumbing, and water heater last replaced?
- What does the HOA fee cover, when was the last increase, and are there any pending special assessments or reserve-fund shortfalls?
- Why hasn't it sold? Are there any deal-killer items the seller is aware of (foundation, flood, title, zoning, code violations)?
- Is there a deadline driving the sale (1031 exchange, divorce, estate, relocation)? That informs how much negotiation room exists.
- Crime grade is F in this area — have there been break-ins, vandalism, or insurance claims at this property in the last 3 years? What carrier currently insures it and at what premium?
- The area grade is low — what's the realistic commute time and amenity access for the typical tenant pool here? Any planned neighborhood developments (good or bad) we should know about?
- What's the average days-on-market for RENTAL listings here right now (not sales)? A rising rental-DOM trend means longer vacancies and softer asking-rent achievability than the comps imply.
- What's the recent tenant-quality profile in this submarket — average credit score on applications, eviction rate, late-payment / NSF rate, and stable-employment percentage? A property-management company in the area should have these aggregated.
- How much new apartment / multifamily construction is in the pipeline within 1–3 miles? Heavy new supply (>2% of stock underway) typically softens rents 12–24 months out; light construction supports rent growth.
Investment metrics
- 1% rule
- 0.85% ✗
- Cap rate
- 5.55%
- Cash-on-cash
- -2.65%
- DSCR
- 0.88
- GRM
- 9.9
CMA / ARV
- ARV (median comp)
- $924,415
- List price
- $845,000
- Delta
- -8.59%
- Verdict
- FAIR
- Comps
- 11 within 1.0 mi
Show comp detail 1 sale within ~0.75 mi
| Address | Dist | Beds/Ba | Sqft | Sold | Price | $/sf | Match |
|---|---|---|---|---|---|---|---|
| 115 S 339th Cir | 0.19mi | 8/4.0 | 3,056 (0%) | 2mo | $830,000 | $272 | 90 |
Match score weights: distance 35% · size 25% · config 20% · recency 20%. Top-matched comps best support the ARV.
Projected returns pro-forma
-3.0% appreciation · 2.33% rent growth · sell at horizon
- IRR
- -21.5%
- Equity multiple
- 0.26×
- Total profit
- $-174,642
- Equity at exit
- $125,992
- IRR
- -16.7%
- Equity multiple
- 0.10×
- Total profit
- $-212,993
- Equity at exit
- $73,060
Cash invested: $236,600 (down + closing). Projections, not guarantees.
Landlord ↔ Tenant lean methodology
- Overall (STATE)
- 28 Tenant-Leaning
- State Washington
- 28 Tenant-Leaning · D+8
- County
- — inherits STATE
- City
- — inherits STATE
ZIP-level market 98003
- Rents YoY
- 2.3%
- Active inventory
- 231
- Price-to-rent
- 39.4×
Monthly cashflow live
- Estimated rent
- $7,145 high interval (Pro) →
- Mortgage (P&I)
- −$4,431
- Tax from tax record
- −$706 /mo · $8,473/yr
- Insurance
- −$352
- HOA
- −$677
- Vacancy / Maint / Mgmt
- −$1,500
- Net cashflow
- $-522
Break-even live
4-unit breakdown (identical units grouped — click to expand)
| Units | Beds | Baths | Est. rent |
|---|---|---|---|
| 4× units | 2 | 1 | $7,144 |
| #1 | 2 | 1 | $1,786 |
| #2 | 2 | 1 | $1,786 |
| #3 | 2 | 1 | $1,786 |
| #4 | 2 | 1 | $1,786 |
| Total (4 units) | $7,145 | ||
UW: 25.0% down · 7.5% · 30yr · 1.5% tax · 5.0% vac · 8.0% maint · 8.0% mgmt
Financing live
Cash to close
- Down payment
- $211,250
- Closing costs
- $25,350
- Reserves months
- —
- Total cash needed
- —
Loan-product check · same deal, 3 products live
Conventional
25% down · 7.5% · 30yr
- Down + closing
- —
- Monthly P&I
- —
- Monthly cashflow
- —
- DSCR
- —
- Eligible?
- —
Personal DTI + credit; lowest rate.
DSCR
20% down · 8.5% · 30yr
- Down + closing
- —
- Monthly P&I
- —
- Monthly cashflow
- —
- DSCR
- —
- Eligible?
- —
No personal income docs; deal must DSCR.
Hard money
10% down · 12.0% · 12mo
- Down + closing
- —
- Monthly P&I
- —
- Monthly cashflow
- —
- DSCR
- —
- Eligible?
- —
Short-term bridge; refi at stabilization.
HOA detail
- Monthly dues
- $677 · $8,124/yr
Listing history 17 events
-
2026-06-18days on market $845,000 Active 90 DOM
-
2026-06-17days on market $845,000 Active 89 DOM
-
2026-06-16days on market $845,000 Active 88 DOM
-
2026-06-15days on market $845,000 Active 87 DOM
-
2026-06-13days on market $845,000 Active 85 DOM
-
2026-06-10price $845,000 Active 81 DOM
-
2026-06-09days on market $899,950 Active 81 DOM
-
2026-06-08days on market $899,950 Active 80 DOM
-
2026-06-07days on market $899,950 Active 79 DOM
-
2026-06-04days on market $899,950 Active 76 DOM
-
2026-06-03days on market $899,950 Active 75 DOM
-
2026-06-02days on market $899,950 Active 74 DOM
-
2026-06-01days on market $899,950 Active 73 DOM
-
2026-05-31days on market $899,950 Active 72 DOM
-
2026-03-20$899,950 Active
-
1986-01-31soldstatus $120,000
-
1979-05-01soldstatus $142,350
ⓘ Source: listings_history table (triggers on properties + properties_extension) + one-shot
backfill from property_details.listing_events for pre-trigger history.
Tax reassessment forecast WA · Resets to sale price
- Current annual tax
- $8,473 · $706/mo
- Projected year-2 tax
- $8,473 · $706/mo
- Expected delta
- $0/yr ($0/mo · 0.0%)
ⓘ Screening estimate from a state-policy table — verify with the county assessor before closing.
Climate risk First Street
- Flood 1/10 Low FEMA zone X (unshaded) · 0% chance over 30 yrs
- Wildfire 1/10 Low
- Heat 3/10 Moderate 7 d/yr ≥87°F today · 15 d/yr by 30 yrs out
- Wind 1/10 Low
- Air quality 7/10 Severe 10 unhealthy d/yr today · 11 by 30 yrs out
Nearby sold comps map
Loading sold comps map…
Walkable amenities ~0.75 mi
Loading nearby amenities…
Taxation est. · year 1
- Rental income
- $85,740
- − Mortgage interest
- −$47,333
- − Property taxes
- −$8,473
- − Insurance
- −$4,225
- − Repairs & maintenance
- −$6,859
- − Management
- −$6,859
- − HOA
- −$8,124
- − Depreciation
- −$24,582
- Taxable loss
- −$20,715
- Est. tax savings @ 24.0%
- +$4,972
- After-tax cash flow
- $-1,291/yr
For passive investors: Depreciation is non-cash, so a rental often shows a tax loss while cash-flowing — sheltering income. Rental losses are passive: they offset passive income freely, and up to $25,000/yr can offset ordinary (W-2) income if you actively participate and your MAGI is under $100k (phasing out to $0 by $150k); unused losses carry forward. On sale, claimed depreciation is recaptured at up to 25%, and gains may owe capital-gains tax (a 1031 exchange can defer both). Figures are a year-1 estimate at your 24.0% rate — not tax advice; consult a CPA.
Schools (NCES district)
- District
- Federal Way School District
- NCES district ID
- 5302820
- Math proficiency
- 35% ▬ 0.00%
- Reading proficiency
- 47% ▬ 0.00%
- Median HH income
- $61,594
- Composite
- 38.79/100
- National rank
- #8361
- State rank
- #207 of 291 in WA
Livability — Federal Way
- Score
- 71/100
- State rank
- #221
- US rank
- #6403
Category grades
Schools grade is shown separately in the Schools card above.
Census & demographics
- Census place
- Federal Way, WA
- County
- King County · 2,251,916 people
- City population
- 102,067
- Metro
- Seattle-Tacoma-Bellevue, WA
- Population (ZIP)
- 51,619
- Household income
- $75,319
- Rent vs Own
- Severe rent burden
- 2895.0
Population outlook (King County) Hauer SSP2
- Today (2025)
- 2,576,485 people
- By 2030
- 2,803,316 · +8.8%
- By 2040
- 3,255,921 · +26.4%
- By 2050
- 3,706,444 · +43.9%
- By 2075
- 4,746,063 · +84.2%
- By 2100
- 5,407,730 · +109.9%
Race, ethnicity, and origin ACS 2023
- Neighborhood character
- Highly diverse neighborhood (Simpson 0.79)
- Race & ethnicity
- White 32% Hispanic / Latino 23% Black 19% Two or more races 16% Asian 13% Pacific Islander 2%
- Hispanic origin (detail)
- Mexican 18%
- Common ancestry
- Portuguese 3% Lithuanian 2% Swedish 2%
- Foreign-born
- 32% · Canada, South Korea, Vietnam
- Languages at home
- 57% English-only · Spanish 18% Other Indo-European 3% Russian/Polish/Slavic 3%
Political lean MEDSL · King
- 2024 margin
- Solid D (+51.7) · D 74.2% · R 22.5% · Other 3.4%
- 2008→2024 swing
- +9.6pp toward D · 2008: 42.1pp · 2024: 51.7pp
- All cycles
- 2024: D+51.7 2020: D+52.7 2016: D+50.4 2012: D+39.9 2008: D+42.1
Not yet ingested
- Civics
- —
Market trends
- HPI YoY
- ▼ -623.87%
- Current HPI
- 327.5371
- Rent YoY
- ▲ 2.33%
- Metro
- Seattle-Tacoma-Bellevue, WA
- State GDP YoY
- ▲ 4.65%
- F500 in state
- 22
Industry mix (Fortune 500 HQ in WA)
| Industry | F500 HQs | Revenue |
|---|---|---|
| Retail | 2 | $269B |
|
||
| Technology / Retail | 1 | $638B |
|
||
| Technology | 1 | $245B |
|
||
| Telecommunications | 1 | $38B |
|
||
| Food / Beverage | 1 | $36B |
|
||
| Automotive / Trucks | 1 | $34B |
|
||
Price history
+532.2% since first listed3 events — show timeline
- 2026-03-20 Listed $899,950 NWMLS as Distributed by MLS Grid
- 1986-01-31 Sold (Public Records) $120,000 Public Records
- 1979-05-01 Sold (Public Records) $142,350 Public Records
Property tax history
+3.9%/yrLatest (2025): $8,473 · +0.4% YoY. Source: county tax records.
Cash-flow waterfall
monthlySold comps — $/sqft
last 12 mo · ≤1 miLoading sold comps…