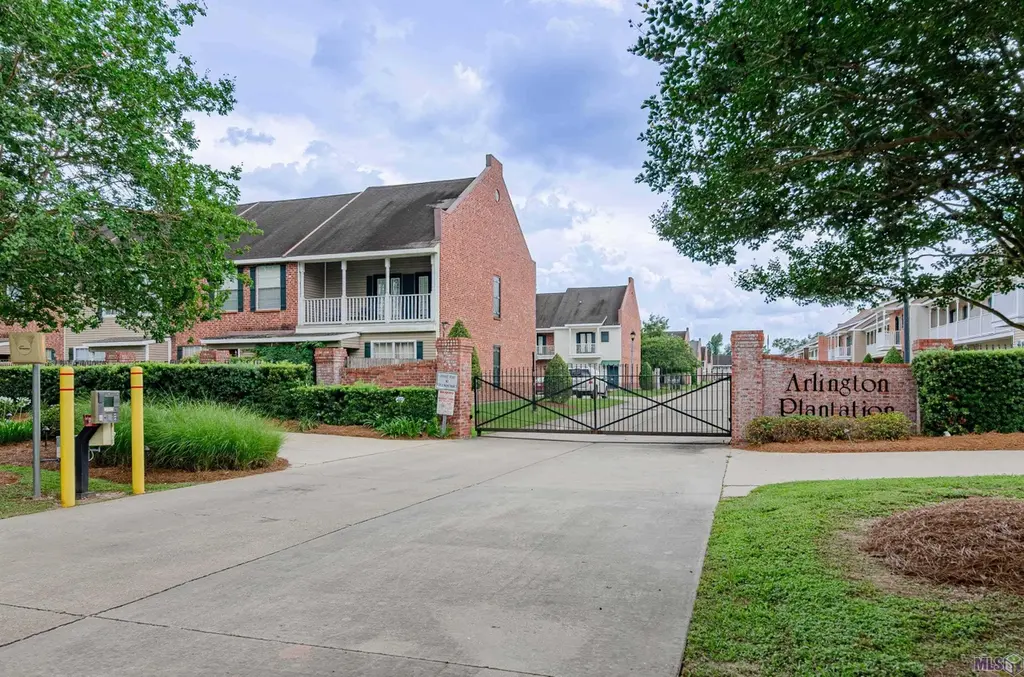
5203 Arlington Ct · Baton Rouge, LA
Flood risk 1/10 · Minimal
- FEMA flood zone
- X
- Chance of flooding over 30 yrs
- 0.0%
- Est. flood insurance / yr
- $507 – $1,088
Fire risk 1/10 · Minimal
- Est. fire insurance / yr
- $1,269 – $2,357
Heat risk 8/10 · Major
- Hot days now (above 108°F)
- 7 days/yr
- Hot days in 30 yrs
- 21 days/yr
Wind risk 9/10 · Severe
- Chance of severe wind over 30 yrs
- 99.0%
Air-quality risk 2/10 · Minimal
- Unhealthy air days now
- 1 days/yr
- Unhealthy air days in 30 yrs
- 1 days/yr
Risk factors via First Street. Map © Google.
Why this score? — see what drove the F grade
The composite is a weighted blend of 9 inputs, each scored 0–100. Each bar is that input's sub-score; the figure is the points it added to the 100-point composite (weight × sub-score).
- Cash flow +13.2/30.0
- DSCR +4.0/10.0
- 1% rule +3.8/10.0
- Livability +3.7/5.0
- Rent growth +3.2/5.0
- Condition / age +2.5/5.0
- Schools +2.4/10.0
- ARV discount +0.0/15.0
- Appreciation +0.0/10.0
$199,000
🖨 Deal sheet 📄 Offer letter ✓ Due diligence
Listing remarks MLS
Don't miss this charming New Orleans style 3 bed/3 bath townhome located in a gated community off of Brightside. This unit lends itself wonderfully for shared spaces, as each bedroom has it's own full bathroom and walk in closet! The kitchen features tile counter tops, ceramic tile flooring, ample counter space, and is connected to the laundry room. This unit offers an open floor plan downstairs with kitchen, dining and living room, which is perfect for gatherings. With a well thought out design, you will also enjoy the main en suite off of the kitchen with a large vanity, garden tub/shower combo, and a massive walk in closet; then upstairs you will find 2 additional spacious bedrooms with their private bathrooms. Enjoy a fully fenced patio area, 3 assigned parking spaces, 2 balconies, and a storage room. It is also conveniently located near guest parking. This community is well kept with a beautiful pond and fountain. Even better....it sits on the LSU bus route!
Key facts
- Gated community
- Open floor plan
- Tile counter tops
Tags
Property features AI
Finance
- HOA & community: Homeowners association present; HOA fee $900 annually (about $75/month)
Exterior
- Parking: Assigned parking for 3 vehicles
- Utilities: Public water; Public sewer
- Home design: Townhouse (attached); Residential property
- Construction: Vinyl siding and brick exterior; Slab foundation
- Exterior features: Attached townhouse; Subdivision: Arlington Plantation Townhomes; Lot dimensions about 20.5 x 98
Interior
- Flooring: Tile; Wood; Carpet; Ceramic tile
- Bathrooms: 3 full bathrooms
- Heating & cooling: Central heating; Central air conditioning
- Interior features: Tile, wood, carpet, and ceramic tile flooring; Central heating and central air conditioning
Neighborhood map
What this means for you Summary
Snapshot
- This is a 3-bed/3.0-bath single-family listed at $199k.
Deal economics
- At list price, monthly cash flow is $-2 ($-26/yr) — negative.
- To cash-flow at today's rent, offer at most $199k (0.2% below list).
- To meet the 1% rule (rent ≥ 1% of price), the offer needs to be $176k (11.6% below list).
- Recommended offer: $176k (11.6% below list) — sets the bar for 1% rule.
- Cap rate 6.3% vs local median 4.3% in Baton Rouge — top-decile yield for the area; either an underpriced asset or a hidden risk that comps aren't pricing in. Stress-test before assuming the spread holds.
Location & tenants
- Location reads 74/100 on livability (#24 in LA, #4,535 nationally) — a middle-class / working-renter tenant base. Strengths: commute A+, cost of living A+, health & safety A+; Watch: amenities D, crime F, employment D-.
- East Baton Rouge Parish (urban): math 22% / reading 34% proficiency, ranked #47 of 98 in LA (top 48%) — low school quality limits family demand, transient renter base, plan for 1-2y turnover; 77% free/reduced lunch — lower-income household profile, screen leases tightly.
- Market conditions: Rents rising (+2.8%/yr); 315 active listings in the ZIP; 40 comparable units currently listed for rent nearby; rentals at typical pace (median 23d on market — plan ~3-4 weeks tenant-placement turnaround); 40% of comp listings sitting > 30 days — soft ceiling on asking rent; 2,252 units permitted in East Baton Rouge Parish in 2024 (440 in 5+ unit buildings).
- This rent runs 44% of the median local income ($47k/yr) — at the standard rent-burdened threshold; future hikes will face affordability resistance.
Forward outlook
- Local home prices are declining (-3.0%/yr); year-one equity from $1k of loan paydown is wiped out by about $6k of value loss. Plan a longer hold.
- East Baton Rouge County population projected at +4% by 2050 — modest demand growth; plan on rents tracking national, not racing it.
Negotiation context
- Only 2 days on market — expect competitive offers; lowballing is unlikely to land.
- 6 sale attempts since 22y ago with the ask held roughly flat each time — persistent listings suggest the price (not the market) is what's stuck; bring a comps-based counter.
Risks & watch-outs
- Climate carrying-cost: severe wind risk, 99% chance of damaging wind over 30y; extreme-heat days projected 7→21/yr by 2055 (HVAC capex compounding) — expect insurance premiums to compound above CPI over the hold.
Questions for the listing agent
- What do current leases actually rent for vs. the listed asking? Can we see a recent rent roll and the last 12 months of T-12 income?
- What does the HOA fee cover, when was the last increase, and are there any pending special assessments or reserve-fund shortfalls?
- Is there a deadline driving the sale (1031 exchange, divorce, estate, relocation)? That informs how much negotiation room exists.
- Crime grade is F in this area — have there been break-ins, vandalism, or insurance claims at this property in the last 3 years? What carrier currently insures it and at what premium?
- The area grade is low — what's the realistic commute time and amenity access for the typical tenant pool here? Any planned neighborhood developments (good or bad) we should know about?
- What's the average days-on-market for RENTAL listings here right now (not sales)? A rising rental-DOM trend means longer vacancies and softer asking-rent achievability than the comps imply.
- What's the recent tenant-quality profile in this submarket — average credit score on applications, eviction rate, late-payment / NSF rate, and stable-employment percentage? A property-management company in the area should have these aggregated.
- How much new for-sale + rental construction is in the pipeline within 1–3 miles? Heavy new supply typically softens prices + rents 12–24 months out; constrained supply supports both.
Investment metrics
- 1% rule
- 0.88% ✗
- Cap rate
- 6.28%
- Cash-on-cash
- -0.05%
- DSCR
- 1.00
- GRM
- 9.4
CMA / ARV
- ARV (on-the-fly)
- $167,940
- Comps found
- 12
Show comp detail 12 sales within ~0.75 mi
| Address | Dist | Beds/Ba | Sqft | Sold | Price | $/sf | Match |
|---|---|---|---|---|---|---|---|
| 2334 Brightside Dr | 0.17mi | 3/2.0 | 1,482 (-5%) | 2mo | $148,000 | $100 | 78 |
| 2216 Brightside Dr | 0.11mi | 3/2.0 | 1,478 (-5%) | 6mo | $164,000 | $111 | 78 |
| 2344 Brightside Dr | 0.18mi | 3/2.0 | 1,651 (+6%) | 6mo | $179,000 | $108 | 72 |
| 1270 Sharlo Ave | 0.20mi | 2/2.0 (-1) | 1,465 (-6%) | 1mo | $140,000 | $96 | 72 |
| 1246 Sharlo Ave Unit 8-D-2 | 0.26mi | 4/2.0 (+1) | 1,641 (+6%) | 0mo | $199,000 | $121 | 69 |
| 1310 Sharlo Ave | 0.20mi | 3/2.0 | 1,653 (+6%) | 12mo | $190,000 | $115 | 66 |
| 1517 Sharlo Ave | 0.21mi | 2/2.0 (-1) | 1,444 (-7%) | 9mo | $120,000 | $83 | 62 |
| 1550 Sharlo Ave | 0.23mi | 2/2.0 (-1) | 1,379 (-11%) | 7mo | $123,500 | $90 | 56 |
| 1512 Sharlo Ave | 0.27mi | 3/2.0 | 1,355 (-13%) | 15mo | $149,900 | $111 | 50 |
| 1318 Sharlo Ave | 0.22mi | 2/2.0 (-1) | 1,363 (-12%) | 14mo | $156,000 | $114 | 48 |
| 1557 Sharlo Ave | 0.16mi | 2/2.0 (-1) | 1,328 (-15%) | 15mo | $134,900 | $102 | 47 |
| 5132 & 5142 Oleson St | 0.55mi | 4/1.0 (+1) | 1,347 (-13%) | 3mo | $139,900 | $104 | 37 |
Match score weights: distance 35% · size 25% · config 20% · recency 20%. Top-matched comps best support the ARV.
Projected returns pro-forma
-3.0% appreciation · 2.79% rent growth · sell at horizon
- IRR
- -16.6%
- Equity multiple
- 0.41×
- Total profit
- $-32,718
- Equity at exit
- $29,672
- IRR
- -8.7%
- Equity multiple
- 0.46×
- Total profit
- $-30,033
- Equity at exit
- $17,206
Cash invested: $55,720 (down + closing). Projections, not guarantees.
Landlord ↔ Tenant lean methodology
- Overall (STATE)
- 90 Strongly Landlord-Friendly
- State Louisiana
- 90 Strongly Landlord-Friendly · R+12
- County
- — inherits STATE
- City
- — inherits STATE
ZIP-level market 70820
- Home prices YoY
- -29.9%
- Rents YoY
- 2.8%
- Active inventory
- 315
- Price-to-rent
- 9.4×
Monthly cashflow live
- Estimated rent
- $1,758 high interval (Pro) →
- Mortgage (P&I)
- −$1,044
- Tax from tax record
- −$190 /mo · $2,276/yr
- Insurance
- −$83
- HOA
- −$75
- Vacancy / Maint / Mgmt
- −$369
- Net cashflow
- $-2
Break-even live
UW: 25.0% down · 7.5% · 30yr · 1.5% tax · 5.0% vac · 8.0% maint · 8.0% mgmt
Financing live
Cash to close
- Down payment
- $49,750
- Closing costs
- $5,970
- Reserves months
- —
- Total cash needed
- —
Loan-product check · same deal, 3 products live
Conventional
25% down · 7.5% · 30yr
- Down + closing
- —
- Monthly P&I
- —
- Monthly cashflow
- —
- DSCR
- —
- Eligible?
- —
Personal DTI + credit; lowest rate.
DSCR
20% down · 8.5% · 30yr
- Down + closing
- —
- Monthly P&I
- —
- Monthly cashflow
- —
- DSCR
- —
- Eligible?
- —
No personal income docs; deal must DSCR.
Hard money
10% down · 12.0% · 12mo
- Down + closing
- —
- Monthly P&I
- —
- Monthly cashflow
- —
- DSCR
- —
- Eligible?
- —
Short-term bridge; refi at stabilization.
Rent comps 40 comps
| Address | Beds | Baths | Sqft | Rent | $/sqft | DOM | Units | Dist |
|---|---|---|---|---|---|---|---|---|
| 5268 S Brightside View Dr Apt 2 Baton Rouge, LA | 3.0 | 2.5 | 1348 | $1,250 | $0.93 | 43d | 1 | 0.07mi |
| 2073 Brightside Dr Baton Rouge, LA | 2.0 | 2.0 | 1100 | $1,200 | $1.09 | 23d | 1 | 0.07mi |
| 5112 Arlington Ct Baton Rouge, LA | 3.0 | 3.0 | 1601 | $1,850 | $1.16 | 43d | 1 | 0.09mi |
| 2122 Stonehenge Ave Baton Rouge, LA | 2.0 | 1.5 | 1540 | $1,550 | $1.01 | 43d | 1 | 0.10mi |
| 2021 S Brightside View Dr Unit C Baton Rouge, LA | 2.0 | 2.5 | 1250 | $1,250 | $1.00 | 43d | 1 | 0.10mi |
| 1983 S Brightside View Dr Baton Rouge, LA | 2.0 | 2.0 | 1270 | $1,100 | $0.87 | 21d | 1 | 0.11mi |
| 1983 S Brightside View Dr Unit C Baton Rouge, LA | 2.0 | 2.5 | 1124 | $1,195 | $1.06 | 43d | 1 | 0.11mi |
| 1953 S Brightside View Dr Unit B Baton Rouge, LA | 2.0 | 2.5 | 1218 | $1,300 | $1.07 | 14d | 1 | 0.11mi |
| 2173 Plantation Ln Baton Rouge, LA | 2.0 | 2.0 | 1374 | $1,200 | $0.87 | 21d | 1 | 0.13mi |
| 1835 S Brightside View Dr Unit C Baton Rouge, LA | 2.0 | 2.5 | 1250 | $1,375 | $1.10 | 23d | 1 | 0.16mi |
| 5416 Heatherstone Dr Baton Rouge, LA | 4.0 | 3.0 | 1990 | $2,000 | $1.01 | 43d | 1 | 0.16mi |
| 2000 Brightside Dr Baton Rouge, LA | 1.0–3.0 | 1.0–2.0 | 792 | $1,496 | $1.89 | 14d | 1 | 0.16mi |
| 5648 Riverstone Dr Unit 94A Baton Rouge, LA | 2.0 | 2.0 | 1603 | $1,250 | $0.78 | 21d | 1 | 0.17mi |
| 5628 Moorstone Dr Baton Rouge, LA | 3.0 | 2.5 | 1900 | $1,650 | $0.87 | 44d | 1 | 0.21mi |
| 1274 Sharlo Ave Unit 1519871P Baton Rouge, LA | 3.0 | 2.0 | 1786 | $3,298 | $1.85 | 14d | 1 | 0.22mi |
| 1741 Brightside Dr Baton Rouge, LA | 2.0–3.0 | 2.0 | 1436 | $1,850 | $1.29 | 14d | 3 | 0.23mi |
| 2452 Brightside Dr Baton Rouge, LA | 2.0 | 2.0 | 1246 | $1,600 | $1.28 | 14d | 1 | 0.24mi |
| 1704 Brightside Dr Unit C Baton Rouge, LA | 2.0 | 2.0 | 1088 | $1,175 | $1.08 | 21d | 1 | 0.29mi |
| 1724 Brightside Dr Apt A Baton Rouge, LA | 2.0 | 1.5 | 1050 | $1,025 | $0.98 | 23d | 1 | 0.31mi |
| 1714 Brightside Dr Unit A Baton Rouge, LA | 2.0 | 1.5 | 1050 | $1,025 | $0.98 | 43d | 1 | 0.31mi |
| 1345 Harwich Dr Baton Rouge, LA | 3.0 | 2.0 | 1478 | $1,800 | $1.22 | 43d | 1 | 0.39mi |
| 4521 Y a Tittle Ave Baton Rouge, LA | 3.0 | 2.0 | 1300 | $1,150 | $0.88 | 14d | 1 | 0.52mi |
| 5107 Nicholson Dr Unit A30 Baton Rouge, LA | 2.0 | 2.0 | 1365 | $1,350 | $0.99 | 23d | 1 | 0.66mi |
| 900 Dean Lee Dr Baton Rouge, LA | 2.0–3.0 | 2.0–3.0 | 1585 | $1,800 | $1.14 | 23d | 3 | 0.67mi |
| 900 Dean Lee Dr Baton Rouge, LA | 2.0–3.0 | 2.0–3.0 | 1585 | $1,800 | $1.14 | 43d | 3 | 0.67mi |
| 5111 Nicholson Dr Unit A44 Baton Rouge, LA | 3.0 | 2.0 | 1567 | $1,650 | $1.05 | 23d | 1 | 0.67mi |
| 839 E Boyd Dr Unit C Baton Rouge, LA | 2.0 | 1.5 | 1080 | $1,400 | $1.30 | 19d | 1 | 0.80mi |
| 837 E Boyd Dr Unit A Baton Rouge, LA | 2.0 | 1.5 | 1080 | $1,300 | $1.20 | 19d | 1 | 0.80mi |
| 5157 Etta St Unit 4G Baton Rouge, LA | 3.0 | 2.0 | 1473 | $1,650 | $1.12 | 43d | 1 | 0.81mi |
| 5618 Cottage Lake Dr Baton Rouge, LA | 3.0 | 2.5 | 2002 | $3,000 | $1.50 | 43d | 1 | 0.83mi |
| 5618 Cottage Lake Dr Baton Rouge, LA | 3.0 | 2.0 | 2002 | $3,000 | $1.50 | 19d | 1 | 0.83mi |
| 582 Jennifer Jean Dr Baton Rouge, LA | 3.0 | 2.0 | 1370 | $1,500 | $1.09 | 43d | 1 | 0.96mi |
| 4441 Burbank Dr #108 Baton Rouge, LA | 3.0 | 3.0 | 1500 | $1,725 | $1.15 | 23d | 1 | 1.03mi |
| 436 Jennifer Jean Dr Baton Rouge, LA | 3.0 | 2.0 | 1100 | $1,950 | $1.77 | 14d | 1 | 1.06mi |
| 436 Jennifer Jean Dr Baton Rouge, LA | 3.0 | 2.0 | 1100 | $1,950 | $1.77 | 23d | 1 | 1.06mi |
| 4441 Burbank Dr Baton Rouge, LA | 3.0 | 2.0–3.0 | 1544 | $1,750 | $1.13 | 43d | 2 | 1.07mi |
| 4464 Highland Rd Baton Rouge, LA | 2.0 | 2.0 | 1219 | $1,675 | $1.37 | 43d | 1 | 1.22mi |
| 5030 Myrtle Trail Dr Baton Rouge, LA | 2.0 | 2.5 | 1601 | $2,350 | $1.47 | 14d | 1 | 1.25mi |
| 5578 Arialo Dr Baton Rouge, LA | 3.0 | 2.0 | 1484 | $2,100 | $1.42 | 43d | 1 | 1.38mi |
| 5151 Highland Rd Baton Rouge, LA | 4.0 | 1.0–4.0 | 1129 | $1,495 | $1.32 | 14d | 150 | 1.43mi |
HOA detail
- Monthly dues
- $75 · $900/yr
- Likely covers
- securityparking
Listing history 3 events
-
2026-06-07statusdays on market $199,000 Pending 2 DOM
-
2026-06-05remarks 687-char remark
-
2026-06-05$199,000 Active 1 DOM
ⓘ Source: listings_history table (triggers on properties + properties_extension) + one-shot
backfill from property_details.listing_events for pre-trigger history.
Tax reassessment forecast LA · Resets to sale price
- Current annual tax
- $2,276 · $190/mo
- Projected year-2 tax
- $2,276 · $190/mo
- Expected delta
- $0/yr ($0/mo · 0.0%)
ⓘ Screening estimate from a state-policy table — verify with the county assessor before closing.
Climate risk First Street
- Flood 1/10 Low FEMA zone X · 0% chance over 30 yrs
- Wildfire 1/10 Low
- Heat 8/10 Severe 7 d/yr ≥108°F today · 21 d/yr by 30 yrs out
- Wind 9/10 Extreme 99% chance of damaging wind over 30 yrs
- Air quality 2/10 Low 1 unhealthy d/yr today · 1 by 30 yrs out
Nearby sold comps map
Loading sold comps map…
Walkable amenities ~0.75 mi
Loading nearby amenities…
Taxation est. · year 1
- Rental income
- $21,100
- − Mortgage interest
- −$11,147
- − Property taxes
- −$2,276
- − Insurance
- −$995
- − Repairs & maintenance
- −$1,688
- − Management
- −$1,688
- − HOA
- −$900
- − Depreciation
- −$5,789
- Taxable loss
- −$3,384
- Est. tax savings @ 24.0%
- +$812
- After-tax cash flow
- $786/yr
For passive investors: Depreciation is non-cash, so a rental often shows a tax loss while cash-flowing — sheltering income. Rental losses are passive: they offset passive income freely, and up to $25,000/yr can offset ordinary (W-2) income if you actively participate and your MAGI is under $100k (phasing out to $0 by $150k); unused losses carry forward. On sale, claimed depreciation is recaptured at up to 25%, and gains may owe capital-gains tax (a 1031 exchange can defer both). Figures are a year-1 estimate at your 24.0% rate — not tax advice; consult a CPA.
Schools (NCES district)
- District
- East Baton Rouge Parish
- NCES district ID
- 2200540
- Math proficiency
- 22% ▼ -36.00%
- Reading proficiency
- 34% ▼ -31.00%
- Median HH income
- $46,263
- Composite
- 24.14/100
- National rank
- #7745
- State rank
- #47 of 98 in LA
Livability — Baton Rouge
- Score
- 74/100
- State rank
- #24
- US rank
- #4535
Category grades
Schools grade is shown separately in the Schools card above.
Census & demographics
- Census place
- Baton Rouge, LA
- County
- East Baton Rouge Parish · 399,686 people
- City population
- 351,868
- Metro
- Baton Rouge, LA
- Population (ZIP)
- 23,377
- Household income
- $47,429
- Rent vs Own
- Severe rent burden
- 1879.0
Population outlook (East Baton Rouge County) Hauer SSP2
- Today (2025)
- 464,810 people
- By 2030
- 472,137 · +1.6%
- By 2040
- 480,243 · +3.3%
- By 2050
- 484,422 · +4.2%
- By 2075
- 492,069 · +5.9%
- By 2100
- 476,347 · +2.5%
Race, ethnicity, and origin ACS 2023
- Neighborhood character
- Diverse neighborhood (Simpson 0.63)
- Race & ethnicity
- White 56% Black 21% Hispanic / Latino 13% Asian 7% Two or more races 5% Native American 2%
- Hispanic origin (detail)
- Mexican 3%
- Common ancestry
- Lithuanian 7% Italian 2% Scotch-Irish 1%
- Foreign-born
- 13% · Canada, China, South Korea
- Languages at home
- 84% English-only · Spanish 9% Other Indo-European 3% Chinese 1%
Political lean MEDSL · East Baton Rouge
- 2024 margin
- D (+11.1) · D 54.5% · R 43.4% · Other 2.1%
- 2008→2024 swing
- +8.9pp toward D · 2008: 2.2pp · 2024: 11.1pp
- All cycles
- 2024: D+11.1 2020: D+13.1 2016: D+9.2 2012: D+5.2 2008: D+2.2
Not yet ingested
- Civics
- —
Market trends
- HPI YoY
- ▼ -56.10%
- Current HPI
- 131.5382
- Rent YoY
- ▲ 2.79%
- Metro
- Baton Rouge, LA
- State GDP YoY
- ▲ 3.29%
- F500 in state
- 10
Industry mix (Fortune 500 HQ in LA)
| Industry | F500 HQs | Revenue |
|---|---|---|
| Telecommunications | 2 | $23B |
|
||
| Utilities | 1 | $12B |
|
||
| Wholesale / Distribution | 1 | $5B |
|
||
| Advertising | 1 | $2B |
|
||
Price history
+34.6% since first listed10 events — show timeline
- 2026-06-04 Listed $199,000 AcadianaMLS
- 2026-06-04 Listed $199,000 GBRMLS
- 2022-08-29 Sold (Public Records) $190,000 Public Records
- 2022-08-26 Sold (MLS) — GBRMLS
- 2022-08-11 Pending — GBRMLS
- 2022-07-25 Delisted — GBRMLS
- 2022-07-22 Listed $190,000 AcadianaMLS
- 2022-07-22 Listed $190,000 GBRMLS
- 2005-10-10 Listed $185,000 AcadianaMLS
- 2004-05-28 Listed $147,900 AcadianaMLS
Property tax history
+0.2%/yrLatest (2025): $2,276 · +4.5% YoY. Source: county tax records.
Cash-flow waterfall
monthlySold comps — $/sqft
last 12 mo · ≤1 miLoading sold comps…