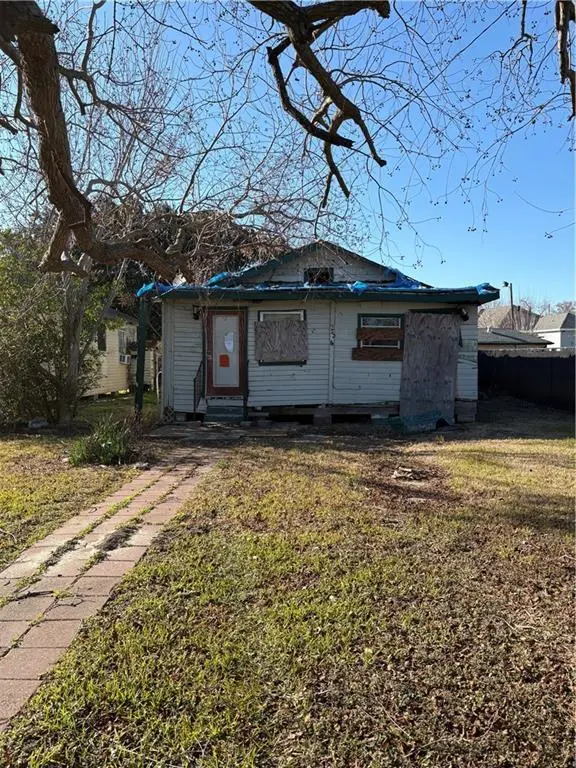
234 Providence Ln · River Ridge, LA
Flood risk 7/10 · Major
- FEMA flood zone
- X
- Chance of flooding over 30 yrs
- 0.59%
- Est. flood insurance / yr
- $507 – $1,088
Fire risk 1/10 · Minimal
- Est. fire insurance / yr
- $1,269 – $2,357
Heat risk 10/10 · Severe
- Hot days now (above 108°F)
- 7 days/yr
- Hot days in 30 yrs
- 20 days/yr
Wind risk 10/10 · Severe
- Chance of severe wind over 30 yrs
- 99.0%
Air-quality risk 3/10 · Minor
- Unhealthy air days now
- 2 days/yr
- Unhealthy air days in 30 yrs
- 3 days/yr
Risk factors via First Street. Map © Google.
Why this score? — see what drove the D grade
The composite is a weighted blend of 9 inputs, each scored 0–100. Each bar is that input's sub-score; the figure is the points it added to the 100-point composite (weight × sub-score).
- Cash flow +15.0/30.0
- ARV discount +7.5/15.0
- 1% rule +5.0/10.0
- DSCR +5.0/10.0
- Livability +3.7/5.0
- Rent growth +2.5/5.0
- Schools +2.5/10.0
- Condition / age +2.5/5.0
- Appreciation +0.0/10.0
$36,000
🖨 Deal sheet 📄 Offer letter ✓ Due diligence
Listing remarks MLS
Sold as-is. No repairs will be made. Property is in poor condition and is best suited as a tear-down. Land value opportunity. Bring offers!
Key facts
- Built 1970
- Listed 7 days
Neighborhood map
What this means for you Summary
Snapshot
- This is a 3-bed/1.0-bath single-family listed at $36k.
Deal economics
- At list price, monthly cash flow is $1k ($12k/yr) — positive.
- The deal already cash-flows at list — no discount required.
- Meets the 1% rule at list price ($2k rent vs $36k).
- Cap rate 42.2% vs local median 3.9% in River Ridge — top-decile yield for the area; either an underpriced asset or a hidden risk that comps aren't pricing in. Stress-test before assuming the spread holds.
Location & tenants
- Location reads 73/100 on livability (#31 in LA) — a middle-class / working-renter tenant base. Strengths: housing A+, employment A, crime A-; Watch: amenities F, commute F.
- Jefferson Parish (suburban): math 24% / reading 34% proficiency, ranked #44 of 98 in LA (top 45%) — low school quality limits family demand, transient renter base, plan for 1-2y turnover; 70% free/reduced lunch — lower-income household profile, screen leases tightly.
- Market conditions: 92 active listings in the ZIP; 26 comparable units currently listed for rent nearby; rentals at typical pace (median 24d on market — plan ~3-4 weeks tenant-placement turnaround); 518 units permitted in Jefferson Parish in 2024 (43 in 5+ unit buildings).
- This rent runs 41% of the median local income ($51k/yr) — at the standard rent-burdened threshold; future hikes will face affordability resistance.
Forward outlook
- Local home prices are declining (-3.0%/yr); year-one equity from $249 of loan paydown is wiped out by about $1k of value loss. Plan a longer hold.
- At projected returns (-3.0% appreciation + 3.0% rent growth), your $10k cash investment doubles in ~1 year — after that, you're playing with house money.
Negotiation context
- Only 7 days on market — expect competitive offers; lowballing is unlikely to land.
- 2 sale attempts with the ask held roughly flat each time — persistent listings suggest the price (not the market) is what's stuck; bring a comps-based counter.
Risks & watch-outs
- Watch-outs: property tax is 3.9% of price; flood insurance adds $66/mo.
- Climate carrying-cost: major flood risk; severe wind risk, 99% chance of damaging wind over 30y; extreme-heat days projected 7→20/yr by 2055 (HVAC capex compounding) — expect insurance premiums to compound above CPI over the hold.
Questions for the listing agent
- Built in 1970 — when were the roof, HVAC, electrical panel, plumbing, and water heater last replaced?
- Property tax is high relative to price — has the assessment been appealed recently, and will the sale trigger a re-assessment?
- What's the actual annual flood-insurance premium (NFIP or private), and is the property in a SFHA with mandatory coverage?
- Is there a deadline driving the sale (1031 exchange, divorce, estate, relocation)? That informs how much negotiation room exists.
- Schools are B-rated — typically a magnet for longer-tenancy family renters. What's the average tenant stay here, and is there a school-zone premium baked into asking?
- The area grade is low — what's the realistic commute time and amenity access for the typical tenant pool here? Any planned neighborhood developments (good or bad) we should know about?
- What's the average days-on-market for RENTAL listings here right now (not sales)? A rising rental-DOM trend means longer vacancies and softer asking-rent achievability than the comps imply.
- What's the recent tenant-quality profile in this submarket — average credit score on applications, eviction rate, late-payment / NSF rate, and stable-employment percentage? A property-management company in the area should have these aggregated.
- How much new for-sale + rental construction is in the pipeline within 1–3 miles? Heavy new supply typically softens prices + rents 12–24 months out; constrained supply supports both.
Investment metrics
- 1% rule
- 4.92% ✓
- Cap rate
- 42.21%
- Cash-on-cash
- 128.27%
- DSCR
- 6.71
- GRM
- 1.7
CMA / ARV
- ARV (on-the-fly)
- $221,028
- Comps found
- 12
Show comp detail 12 sales within ~0.75 mi
| Address | Dist | Beds/Ba | Sqft | Sold | Price | $/sf | Match |
|---|---|---|---|---|---|---|---|
| 229 Providence Ln | 0.03mi | 3/2.0 | 1,400 (+3%) | 12mo | $217,000 | $155 | 79 |
| 324 Filmore St | 0.05mi | 3/2.0 | 1,520 (+12%) | 1mo | $292,500 | $192 | 72 |
| 308 Florida St | 0.50mi | 3/1.0 | 1,331 (-2%) | 3mo | $121,000 | $91 | 71 |
| 119 Providence Ln | 0.11mi | 3/2.0 | 1,540 (+14%) | 11mo | $251,000 | $163 | 59 |
| 312 Sophia St | 0.42mi | 3/2.0 | 1,465 (+8%) | 14mo | $317,575 | $217 | 51 |
| 229 N Atlanta St | 0.69mi | 2/1.0 (-1) | 1,260 (-7%) | 0mo | $124,000 | $98 | 50 |
| 216 N Cumberland St | 0.71mi | 3/1.0 | 1,266 (-7%) | 10mo | $157,000 | $124 | 48 |
| 220 Grove Ave | 0.62mi | 4/2.0 (+1) | 1,250 (-8%) | 2mo | $243,000 | $194 | 47 |
| 236 Florida St St | 0.50mi | 3/1.0 | 1,189 (-12%) | 12mo | $236,000 | $198 | 46 |
| 1101 Fairway Dr | 0.65mi | 3/2.0 | 1,444 (+6%) | 12mo | $235,000 | $163 | 45 |
| 304 N Cumberland St | 0.74mi | 3/2.0 | 1,250 (-8%) | 6mo | $131,000 | $105 | 43 |
| 1023 S Starrett Rd | 0.49mi | 4/2.0 (+1) | 1,534 (+13%) | 5mo | $98,000 | $64 | 42 |
Match score weights: distance 35% · size 25% · config 20% · recency 20%. Top-matched comps best support the ARV.
Projected returns pro-forma
-3.0% appreciation · 3.0% rent growth · sell at horizon
- IRR
- —
- Equity multiple
- 6.82×
- Total profit
- $58,673
- Equity at exit
- $5,368
- IRR
- —
- Equity multiple
- 14.34×
- Total profit
- $134,465
- Equity at exit
- $3,113
Cash invested: $10,080 (down + closing). Projections, not guarantees.
Landlord ↔ Tenant lean methodology
- Overall (STATE)
- 90 Strongly Landlord-Friendly
- State Louisiana
- 90 Strongly Landlord-Friendly · R+12
- County
- — inherits STATE
- City
- — inherits STATE
ZIP-level market 70062
- Active inventory
- 92
- Price-to-rent
- 1.7×
Monthly cashflow live
- Estimated rent
- $1,771 high interval (Pro) →
- Mortgage (P&I)
- −$189
- Tax from tax record
- −$118 /mo · $1,411/yr
- Insurance
- −$15
- Flood insurance flood zone
- −$66 /mo · $798/yr
- HOA
- −$0
- Vacancy / Maint / Mgmt
- −$372
- Net cashflow
- $1,011
Break-even live
UW: 25.0% down · 7.5% · 30yr · 1.5% tax · 5.0% vac · 8.0% maint · 8.0% mgmt
Financing live
Cash to close
- Down payment
- $9,000
- Closing costs
- $1,080
- Reserves months
- —
- Total cash needed
- —
Loan-product check · same deal, 3 products live
Conventional
25% down · 7.5% · 30yr
- Down + closing
- —
- Monthly P&I
- —
- Monthly cashflow
- —
- DSCR
- —
- Eligible?
- —
Personal DTI + credit; lowest rate.
DSCR
20% down · 8.5% · 30yr
- Down + closing
- —
- Monthly P&I
- —
- Monthly cashflow
- —
- DSCR
- —
- Eligible?
- —
No personal income docs; deal must DSCR.
Hard money
10% down · 12.0% · 12mo
- Down + closing
- —
- Monthly P&I
- —
- Monthly cashflow
- —
- DSCR
- —
- Eligible?
- —
Short-term bridge; refi at stabilization.
Rent comps 26 comps
| Address | Beds | Baths | Sqft | Rent | $/sqft | DOM | Units | Dist |
|---|---|---|---|---|---|---|---|---|
| 621 S Bengal Rd Metairie, LA | 3.0 | 2.0 | 900 | $1,600 | $1.78 | 3d | 1 | 0.23mi |
| 1916 4th St Kenner, LA | 2.0 | 2.0 | 1000 | $1,200 | $1.20 | 14d | 1 | 0.67mi |
| 927 Compromise St Unit A Kenner, LA | 2.0 | 1.0 | 1300 | $1,100 | $0.85 | 24d | 1 | 0.69mi |
| 929 Compromise St Kenner, LA | 2.0 | 1.0 | 1500 | $1,400 | $0.93 | 24d | 1 | 0.69mi |
| 413 Maryland Ave Metairie, LA | 3.0 | 2.0 | 1330 | $1,400 | $1.05 | 24d | 1 | 0.70mi |
| 10613 Chadwick Dr New Orleans, LA | 3.0 | 2.0 | 1460 | $2,200 | $1.51 | 2d | 1 | 0.74mi |
| 1300 Webster St Kenner, LA | 3.0 | 2.0 | 1200 | $1,700 | $1.42 | 44d | 1 | 0.79mi |
| 1300 Webster St Kenner, LA | 3.0 | 2.0 | 1200 | $1,700 | $1.42 | 24d | 1 | 0.79mi |
| 216 Trudeau Dr Metairie, LA | 4.0 | 3.0 | 1825 | $2,800 | $1.53 | 4d | 1 | 0.90mi |
| 10017 River Rd Westwego, LA | 2.0 | 1.0 | 1100 | $1,600 | $1.45 | 3d | 1 | 0.93mi |
| 129 Stewart Ave New Orleans, LA | 3.0 | 1.0 | 1466 | $1,950 | $1.33 | 24d | 1 | 1.03mi |
| 1711 Moisant St Kenner, LA | 2.0 | 1.0 | 1097 | $1,575 | $1.44 | 4d | 1 | 1.08mi |
| 512 N Howard Ave Metairie, LA | 2.0 | 1.0 | 1000 | $1,650 | $1.65 | 4d | 1 | 1.12mi |
| 527 Little Farms Ave New Orleans, LA | 3.0 | 2.0 | 1855 | $2,800 | $1.51 | 24d | 1 | 1.12mi |
| 1001 Maine Ave Kenner, LA | 2.0 | 1.0 | 985 | $1,600 | $1.62 | 44d | 1 | 1.15mi |
| 1001 Minnesota Ave Kenner, LA | 3.0 | 2.0 | 1800 | $2,100 | $1.17 | 44d | 1 | 1.21mi |
| 1108 Maryland Ave Kenner, LA | 3.0 | 1.0 | 1050 | $2,050 | $1.95 | 14d | 1 | 1.22mi |
| 808 Cynthia Ave Metairie, LA | 3.0 | 2.0 | 1500 | $2,100 | $1.40 | 14d | 1 | 1.23mi |
| 310 N Wilson St Metairie, LA | 2.0 | 1.0 | 900 | $1,175 | $1.31 | 24d | 1 | 1.25mi |
| 220 Azalea Dr Westwego, LA | 3.0 | 1.0 | 1300 | $1,675 | $1.29 | 4d | 1 | 1.35mi |
| 128 Phyllis Ct New Orleans, LA | 3.0 | 2.0 | 1264 | $2,400 | $1.90 | 24d | 1 | 1.36mi |
| 240 Azalea Dr Westwego, LA | 3.0 | 1.0 | 1100 | $1,480 | $1.35 | 24d | 1 | 1.39mi |
| 240 Azalea Dr Westwego, LA | 3.0 | 1.0 | 1100 | $1,600 | $1.45 | 44d | 1 | 1.39mi |
| 606 N Wilson St Metairie, LA | 3.0 | 1.5 | 1200 | $1,800 | $1.50 | 44d | 1 | 1.39mi |
| 705 N Lester Ave Metairie, LA | 3.0 | 2.0 | 1334 | $2,100 | $1.57 | 44d | 1 | 1.40mi |
| 1217 N Cumberland St Metairie, LA | 3.0 | 1.0 | 1022 | $2,100 | $2.05 | 4d | 1 | 1.42mi |
Listing history 5 events
-
2026-04-24status Pending 139-char remark
Show marketing remark (139 chars)
Sold as-is. No repairs will be made. Property is in poor condition and is best suited as a tear-down. Land value opportunity. Bring offers!
-
2026-04-24status Pending
Show marketing remark (139 chars)
Sold as-is. No repairs will be made. Property is in poor condition and is best suited as a tear-down. Land value opportunity. Bring offers!
-
2026-04-16$36,000 Active 139-char remark
Show marketing remark (139 chars)
Sold as-is. No repairs will be made. Property is in poor condition and is best suited as a tear-down. Land value opportunity. Bring offers!
-
2026-04-16$36,000 Active
Show marketing remark (139 chars)
Sold as-is. No repairs will be made. Property is in poor condition and is best suited as a tear-down. Land value opportunity. Bring offers!
-
2000-05-01soldstatus
ⓘ Source: listings_history table (triggers on properties + properties_extension) + one-shot
backfill from property_details.listing_events for pre-trigger history.
Tax reassessment forecast LA · Resets to sale price
- Current annual tax
- $1,411 · $118/mo
- Projected year-2 tax
- $1,411 · $118/mo
- Expected delta
- $0/yr ($0/mo · 0.0%)
ⓘ Screening estimate from a state-policy table — verify with the county assessor before closing.
Climate risk First Street
- Flood 7/10 Severe FEMA zone X · 59% chance over 30 yrs
- Wildfire 1/10 Low
- Heat 10/10 Extreme 7 d/yr ≥108°F today · 20 d/yr by 30 yrs out
- Wind 10/10 Extreme 99% chance of damaging wind over 30 yrs
- Air quality 3/10 Moderate 2 unhealthy d/yr today · 3 by 30 yrs out
Nearby sold comps map
Loading sold comps map…
Walkable amenities ~0.75 mi
Loading nearby amenities…
Taxation est. · year 1
- Rental income
- $21,249
- − Mortgage interest
- −$2,017
- − Property taxes
- −$1,411
- − Insurance
- −$978
- − Repairs & maintenance
- −$1,700
- − Management
- −$1,700
- − Depreciation
- −$1,047
- Taxable income
- $12,397
- Est. tax owed @ 24.0%
- −$2,975
- After-tax cash flow
- $9,157/yr
For passive investors: Depreciation is non-cash, so a rental often shows a tax loss while cash-flowing — sheltering income. Rental losses are passive: they offset passive income freely, and up to $25,000/yr can offset ordinary (W-2) income if you actively participate and your MAGI is under $100k (phasing out to $0 by $150k); unused losses carry forward. On sale, claimed depreciation is recaptured at up to 25%, and gains may owe capital-gains tax (a 1031 exchange can defer both). Figures are a year-1 estimate at your 24.0% rate — not tax advice; consult a CPA.
Schools (NCES district)
- District
- Jefferson Parish
- NCES district ID
- 2200840
- Math proficiency
- 24% ▼ -36.00%
- Reading proficiency
- 34% ▼ -30.00%
- Median HH income
- $48,421
- Composite
- 25.19/100
- National rank
- #7511
- State rank
- #44 of 98 in LA
Livability — River Ridge
- Score
- 73/100
- State rank
- #31
- US rank
- #5069
Category grades
Schools grade is shown separately in the Schools card above.
Census & demographics
- Census place
- River Ridge, LA
- County
- Jefferson Parish · 426,999 people
- City population
- 27,386
- Metro
- New Orleans-Metairie, LA
- Population (ZIP)
- 17,771
- Household income
- $51,477
- Rent vs Own
- Severe rent burden
- 1082.0
Population outlook (Jefferson County) Hauer SSP2
- Today (2025)
- 451,696 people
- By 2030
- 455,451 · +0.8%
- By 2040
- 458,308 · +1.5%
- By 2050
- 461,031 · +2.1%
- By 2075
- 476,351 · +5.5%
- By 2100
- 499,377 · +10.6%
Race, ethnicity, and origin ACS 2023
- Neighborhood character
- Highly diverse neighborhood (Simpson 0.70)
- Race & ethnicity
- Hispanic / Latino 37% Black 29% White 27% Two or more races 17% Asian 2% Native American 1%
- Hispanic origin (detail)
- Mexican 6% Cuban 2% Dominican 2%
- Common ancestry
- Lithuanian 5%
- Foreign-born
- 22% · Canada
- Languages at home
- 66% English-only · Spanish 32% Other Indo-European 2%
Political lean MEDSL · Jefferson
- 2024 margin
- R (+12.9) · D 42.5% · R 55.5% · Other 2.1%
- 2008→2024 swing
- +13.6pp toward D · 2008: -26.6pp · 2024: -12.9pp
- All cycles
- 2024: R+12.9 2020: R+11.1 2016: R+14.8 2012: R+18.4 2008: R+26.6
Not yet ingested
- Civics
- —
Market trends
- HPI YoY
- ▼ -108.55%
- Current HPI
- 105.3411
- Rent YoY
- —
- Metro
- New Orleans-Metairie, LA
- State GDP YoY
- ▲ 3.29%
- F500 in state
- 10
Industry mix (Fortune 500 HQ in LA)
| Industry | F500 HQs | Revenue |
|---|---|---|
| Telecommunications | 2 | $23B |
|
||
| Utilities | 1 | $12B |
|
||
| Wholesale / Distribution | 1 | $5B |
|
||
| Advertising | 1 | $2B |
|
||
Price history
+0.0% since first listed5 events — show timeline
- 2026-04-24 Pending — AcadianaMLS
- 2026-04-24 Pending — GSREIN
- 2026-04-16 Listed $36,000 GSREIN
- 2026-04-16 Listed $36,000 AcadianaMLS
- 2000-05-01 Sold (Public Records) — Public Records
Property tax history
+2.5%/yrLatest (2025): $1,411 · +5.2% YoY. Source: county tax records.
Cash-flow waterfall
monthlySold comps — $/sqft
last 12 mo · ≤1 miLoading sold comps…