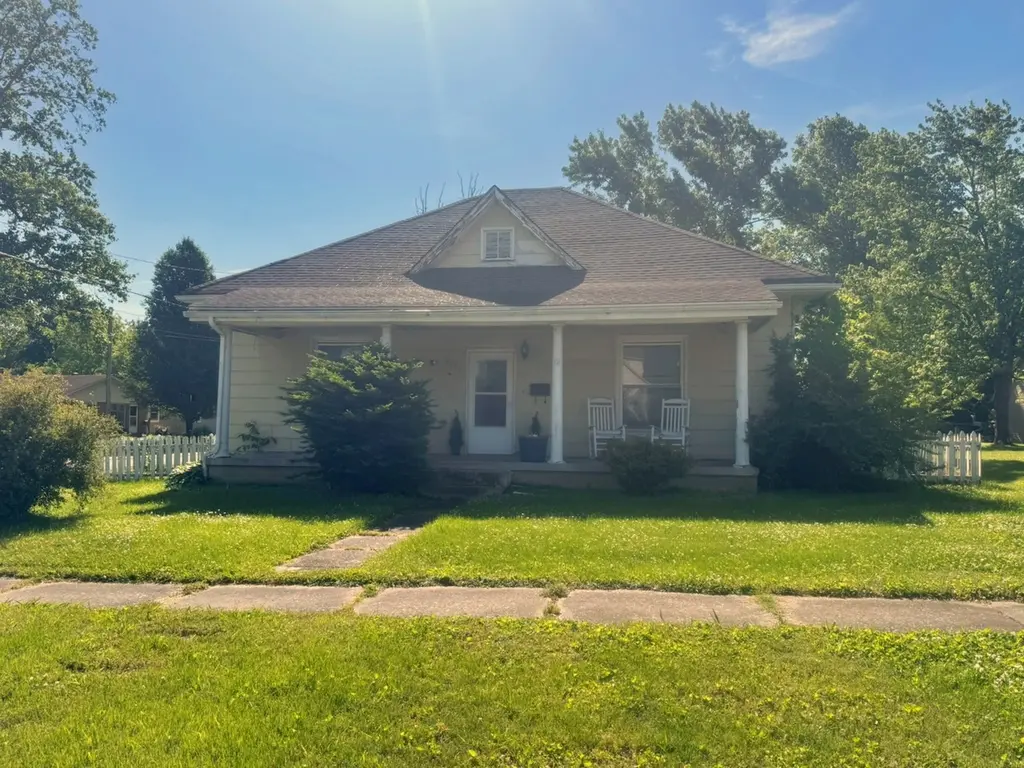
1120 Girard St · Metropolis, IL
Flood risk 1/10 · Minimal
- FEMA flood zone
- X
- Chance of flooding over 30 yrs
- 0.0%
- Est. flood insurance / yr
- $507 – $1,088
Fire risk 3/10 · Minor
- Est. fire insurance / yr
- $804 – $1,492
Heat risk 6/10 · Moderate
- Hot days now (above 108°F)
- 7 days/yr
- Hot days in 30 yrs
- 20 days/yr
Wind risk 3/10 · Minor
- Chance of severe wind over 30 yrs
- 6.0%
Air-quality risk 2/10 · Minimal
- Unhealthy air days now
- 1 days/yr
- Unhealthy air days in 30 yrs
- 2 days/yr
Risk factors via First Street. Map © Google.
Why this score? — see what drove the B- grade
The composite is a weighted blend of 9 inputs, each scored 0–100. Each bar is that input's sub-score; the figure is the points it added to the 100-point composite (weight × sub-score).
- Cash flow +29.1/30.0
- DSCR +10.0/10.0
- 1% rule +9.1/10.0
- ARV discount +9.0/15.0
- Livability +3.8/5.0
- Rent growth +2.5/5.0
- Condition / age +2.5/5.0
- Schools +2.2/10.0
- Appreciation +0.0/10.0
$69,900
🖨 Deal sheet 📄 Offer letter ✓ Due diligence
Listing remarks MLS
Great house in a great location! This two bedroom home has been well maintained and is ready for its next owner. The house is situated on a nice corner lot and has a fenced-in yard, enclosed back porch and a detached garage.
Key facts
- Fenced backyard
- Corner lot
- Detached garage
Tags
Property features AI
Finance
- Other: Property located in unincorporated Metropolis; directions: From Hwy 45 to E 12th Street. Property is on the corner of 12th St and Girard.
- HOA & community: No master association fee required
Exterior
- Parking: Detached garage (1 garage space, 1 total parking space)
- Utilities: Public water; Public sewer
- Home design: Detached single-family home; One-story layout; Fee simple ownership; Built prior to 1978 (estimated age 71–80 years)
- Construction: Frame and Masonite construction
- Exterior features: Corner lot with dimensions approximately 50 x 120
Interior
- Kitchen: Kitchen on the main level
- Bedrooms: 2 bedrooms (both on the main level); Master bedroom on the main level
- Flooring: Carpet in living room and bedrooms; Hardwood in dining room; Laminate in kitchen
- Bathrooms: 1 full bathroom
- Heating & cooling: Natural gas forced-air heating; Central air conditioning
- Interior features: Five total rooms
- Laundry & utility: Dedicated laundry room
Neighborhood map
What this means for you Summary
Snapshot
- This is a 2-bed/1.0-bath single-family listed at $70k.
Deal economics
- At list price, monthly cash flow is $241 ($3k/yr) — positive.
- The deal already cash-flows at list — no discount required.
- Meets the 1% rule at list price ($984 rent vs $70k).
- Cap rate 10.4% vs local median 5.3% in Metropolis — top-decile yield for the area; either an underpriced asset or a hidden risk that comps aren't pricing in. Stress-test before assuming the spread holds.
Location & tenants
- Location reads 75/100 on livability (#217 in IL, #4,091 nationally) — a middle-class / working-renter tenant base. Strengths: cost of living A+, housing A+, health & safety A+; Watch: schools D-, commute F, employment D-.
- Massac UD 1 (rural): math 24% / reading 28% proficiency, ranked #318 of 620 in IL (top 51%) — low school quality limits family demand, transient renter base, plan for 1-2y turnover.
- Market conditions: 73 active listings in the ZIP; 5 units permitted in Massac County in 2024 (0 in 5+ unit buildings).
Forward outlook
- Local home prices are declining (-3.0%/yr); year-one equity from $483 of loan paydown is wiped out by about $2k of value loss. Plan a longer hold.
- Massac County population projected at -28% by 2050 — secular population decline; favor cash flow + early exit over multi-decade hold.
- At projected returns (-3.0% appreciation + 3.0% rent growth), your $20k cash investment doubles in ~8 years — after that, you're playing with house money.
Negotiation context
- Only 11 days on market — expect competitive offers; lowballing is unlikely to land.
- 8 sale attempts since 20y ago with the ask held roughly flat each time — persistent listings suggest the price (not the market) is what's stuck; bring a comps-based counter.
Risks & watch-outs
- Watch-outs: built in 1950 — expect roof / HVAC / electrical / plumbing capex.
- Climate carrying-cost: extreme-heat days projected 7→20/yr by 2055 (HVAC capex compounding) — expect insurance premiums to compound above CPI over the hold.
Questions for the listing agent
- Built in 1950 — when were the roof, HVAC, electrical panel, plumbing, and water heater last replaced?
- Is there a deadline driving the sale (1031 exchange, divorce, estate, relocation)? That informs how much negotiation room exists.
- Schools are D-rated, which usually means shorter tenancies and higher turnover. Who's the typical renter profile here, and what's been the actual vacancy rate?
- What's the average days-on-market for RENTAL listings here right now (not sales)? A rising rental-DOM trend means longer vacancies and softer asking-rent achievability than the comps imply.
- What's the recent tenant-quality profile in this submarket — average credit score on applications, eviction rate, late-payment / NSF rate, and stable-employment percentage? A property-management company in the area should have these aggregated.
- How much new for-sale + rental construction is in the pipeline within 1–3 miles? Heavy new supply typically softens prices + rents 12–24 months out; constrained supply supports both.
Investment metrics
- 1% rule
- 1.41% ✓
- Cap rate
- 10.43%
- Cash-on-cash
- 14.76%
- DSCR
- 1.66
- GRM
- 5.9
CMA / ARV
- ARV (on-the-fly)
- $72,261
- Comps found
- 12
Show comp detail 12 sales within ~0.75 mi
| Address | Dist | Beds/Ba | Sqft | Sold | Price | $/sf | Match |
|---|---|---|---|---|---|---|---|
| 1120 Girard St | 0.00mi | 2/1.0 | 1,147 (0%) | 0mo | $60,000 | $52 | 100 |
| 1018 Girard St | 0.07mi | 3/1.0 (+1) | 1,197 (+4%) | 0mo | $19,000 | $16 | 84 |
| 1302 Catherine St | 0.10mi | 2/1.0 | 1,064 (-7%) | 7mo | $93,900 | $88 | 78 |
| 307 E 8th St | 0.27mi | 3/1.5 (+1) | 1,125 (-2%) | 0mo | $70,500 | $63 | 77 |
| 718 Girard St | 0.30mi | 2/1.0 | 1,200 (+5%) | 8mo | $73,000 | $61 | 71 |
| 1002 Ferry St | 0.20mi | 3/1.5 (+1) | 1,200 (+5%) | 8mo | $59,000 | $49 | 69 |
| 1806 Market St | 0.45mi | 3/1.0 (+1) | 1,094 (-5%) | 2mo | $94,500 | $86 | 65 |
| 404 E 7th St | 0.39mi | 3/1.0 (+1) | 1,088 (-5%) | 7mo | $37,500 | $34 | 63 |
| 212 E 19th St St | 0.41mi | 3/1.0 (+1) | 1,000 (-13%) | 4mo | $140,000 | $140 | 51 |
| 508 Hillcrest St | 0.73mi | 3/1.0 (+1) | 1,216 (+6%) | 3mo | $118,500 | $97 | 48 |
| 113 E 21st St | 0.60mi | 3/2.0 (+1) | 1,216 (+6%) | 6mo | $76,500 | $63 | 48 |
| 528 W 20th St | 0.73mi | 3/2.0 (+1) | 1,231 (+7%) | 2mo | $130,000 | $106 | 43 |
Match score weights: distance 35% · size 25% · config 20% · recency 20%. Top-matched comps best support the ARV.
Projected returns pro-forma
-3.0% appreciation · 3.0% rent growth · sell at horizon
- IRR
- 5.3%
- Equity multiple
- 1.21×
- Total profit
- $4,055
- Equity at exit
- $10,422
- IRR
- 14.8%
- Equity multiple
- 2.20×
- Total profit
- $23,469
- Equity at exit
- $6,044
Cash invested: $19,572 (down + closing). Projections, not guarantees.
Landlord ↔ Tenant lean methodology
- Overall (STATE)
- 43 Moderately Tenant-Leaning
- State Illinois
- 43 Moderately Tenant-Leaning · D+7
- County
- — inherits STATE
- City
- — inherits STATE
ZIP-level market 62960
- Home prices YoY
- -19.6%
- Active inventory
- 73
- Price-to-rent
- 5.9×
Monthly cashflow live
- Estimated rent
- $984 medium interval (Pro) →
- Mortgage (P&I)
- −$367
- Tax from tax record
- −$141 /mo · $1,689/yr
- Insurance
- −$29
- HOA
- −$0
- Vacancy / Maint / Mgmt
- −$207
- Net cashflow
- $241
Break-even live
UW: 25.0% down · 7.5% · 30yr · 1.5% tax · 5.0% vac · 8.0% maint · 8.0% mgmt
Financing live
Cash to close
- Down payment
- $17,475
- Closing costs
- $2,097
- Reserves months
- —
- Total cash needed
- —
Loan-product check · same deal, 3 products live
Conventional
25% down · 7.5% · 30yr
- Down + closing
- —
- Monthly P&I
- —
- Monthly cashflow
- —
- DSCR
- —
- Eligible?
- —
Personal DTI + credit; lowest rate.
DSCR
20% down · 8.5% · 30yr
- Down + closing
- —
- Monthly P&I
- —
- Monthly cashflow
- —
- DSCR
- —
- Eligible?
- —
No personal income docs; deal must DSCR.
Hard money
10% down · 12.0% · 12mo
- Down + closing
- —
- Monthly P&I
- —
- Monthly cashflow
- —
- DSCR
- —
- Eligible?
- —
Short-term bridge; refi at stabilization.
Listing history 22 events
-
2026-05-15status Pending
-
2026-05-04$69,900 Active
-
2022-07-14soldstatus $70,000 224-char remark
Show marketing remark (224 chars)
Great house in a great location! This two bedroom home has been well maintained and is ready for its next owner. The house is situated on a nice corner lot and has a fenced-in yard, enclosed back porch and a detached garage.
-
2022-07-14soldstatus $70,000 Closed 224-char remark
Show marketing remark (224 chars)
Great house in a great location! This two bedroom home has been well maintained and is ready for its next owner. The house is situated on a nice corner lot and has a fenced-in yard, enclosed back porch and a detached garage.
-
2022-06-02historical Under Contract 224-char remark
Show marketing remark (224 chars)
Great house in a great location! This two bedroom home has been well maintained and is ready for its next owner. The house is situated on a nice corner lot and has a fenced-in yard, enclosed back porch and a detached garage.
-
2021-11-23$73,900 224-char remark
Show marketing remark (224 chars)
Great house in a great location! This two bedroom home has been well maintained and is ready for its next owner. The house is situated on a nice corner lot and has a fenced-in yard, enclosed back porch and a detached garage.
-
2021-11-23$73,900 Active 224-char remark
Show marketing remark (224 chars)
Great house in a great location! This two bedroom home has been well maintained and is ready for its next owner. The house is situated on a nice corner lot and has a fenced-in yard, enclosed back porch and a detached garage.
-
2021-08-06historical
-
2021-08-06historical
-
2016-01-22historical
-
2015-11-20historical
-
2009-09-23soldstatus $76,500
-
2009-09-23soldstatus $76,500
-
2009-09-23soldstatus $76,500
-
2009-08-19$79,900
-
2009-08-19$79,900
-
2007-07-03soldstatus $65,000
-
2007-07-03soldstatus $65,000
-
2007-05-03$75,000
-
2007-05-03$75,000
-
2006-07-26soldstatus $50,000
-
2006-06-20$54,500
ⓘ Source: listings_history table (triggers on properties + properties_extension) + one-shot
backfill from property_details.listing_events for pre-trigger history.
Tax reassessment forecast IL · Partial reset (capped growth)
- Current annual tax
- $1,689 · $141/mo
- Projected year-2 tax
- $1,689 · $141/mo
- Expected delta
- $0/yr ($0/mo · 0.0%)
ⓘ Screening estimate from a state-policy table — verify with the county assessor before closing.
Climate risk First Street
- Flood 1/10 Low FEMA zone X · 0% chance over 30 yrs
- Wildfire 3/10 Moderate
- Heat 6/10 Major 7 d/yr ≥108°F today · 20 d/yr by 30 yrs out
- Wind 3/10 Moderate 6% chance of damaging wind over 30 yrs
- Air quality 2/10 Low 1 unhealthy d/yr today · 2 by 30 yrs out
Nearby sold comps map
Loading sold comps map…
Walkable amenities ~0.75 mi
Loading nearby amenities…
Taxation est. · year 1
- Rental income
- $11,805
- − Mortgage interest
- −$3,915
- − Property taxes
- −$1,689
- − Insurance
- −$350
- − Repairs & maintenance
- −$944
- − Management
- −$944
- − Depreciation
- −$2,033
- Taxable income
- $1,929
- Est. tax owed @ 24.0%
- −$463
- After-tax cash flow
- $2,426/yr
For passive investors: Depreciation is non-cash, so a rental often shows a tax loss while cash-flowing — sheltering income. Rental losses are passive: they offset passive income freely, and up to $25,000/yr can offset ordinary (W-2) income if you actively participate and your MAGI is under $100k (phasing out to $0 by $150k); unused losses carry forward. On sale, claimed depreciation is recaptured at up to 25%, and gains may owe capital-gains tax (a 1031 exchange can defer both). Figures are a year-1 estimate at your 24.0% rate — not tax advice; consult a CPA.
Schools (NCES district)
- District
- Massac UD 1
- NCES district ID
- 1725000
- Math proficiency
- 24% ▼ -13.00%
- Reading proficiency
- 28% ▼ -13.00%
- Median HH income
- $41,431
- Composite
- 22.06/100
- National rank
- #8192
- State rank
- #318 of 620 in IL
Livability — Metropolis
- Score
- 75/100
- State rank
- #217
- US rank
- #4091
Category grades
Schools grade is shown separately in the Schools card above.
Census & demographics
- Census place
- Metropolis, IL
- Population (ZIP)
- 10,823
Population outlook (Massac County) Hauer SSP2
- Today (2025)
- 13,461 people
- By 2030
- 12,675 · -5.8%
- By 2040
- 11,124 · -17.4%
- By 2050
- 9,711 · -27.9%
- By 2075
- 7,253 · -46.1%
- By 2100
- 5,666 · -57.9%
Race, ethnicity, and origin ACS 2023
- Neighborhood character
- Predominantly White (86%)
- Race & ethnicity
- White 86% Black 7% Two or more races 5% Hispanic / Latino 3%
- Common ancestry
- Romanian 2% Serbian 2% Lithuanian 2%
- Foreign-born
- 2% · Canada
- Languages at home
- 97% English-only · Spanish 2%
Political lean MEDSL · Massac
- 2024 margin
- Solid R (+48.8) · D 25.2% · R 74.0%
- 2008→2024 swing
- -25.4pp toward R · 2008: -23.4pp · 2024: -48.8pp
- All cycles
- 2024: R+48.8 2020: R+48.0 2016: R+49.6 2012: R+33.7 2008: R+23.4
Not yet ingested
- Civics
- —
Market trends
- HPI YoY
- ▼ -33.38%
- Current HPI
- 137.0772
- Rent YoY
- —
- Metro
- —
- State GDP YoY
- ▲ 1.59%
- F500 in state
- 60
Industry mix (Fortune 500 HQ in IL)
| Industry | F500 HQs | Revenue |
|---|---|---|
| Insurance | 4 | $201B |
|
||
| Consumer Goods | 4 | $87B |
|
||
| Industrial Machinery | 3 | $64B |
|
||
| Healthcare | 2 | $55B |
|
||
| Retail / Pharmacy | 1 | $148B |
|
||
| Agriculture / Food | 1 | $86B |
|
||
Price history
+28.3% since first listed22 events — show timeline
- 2026-05-15 Pending — MRED as Distributed by MLS Grid
- 2026-05-04 Listed $69,900 MRED as Distributed by MLS Grid
- 2022-07-14 Sold (MLS) $70,000 RMLSA as Distributed by MLS Grid
- 2022-07-14 Sold (MLS) $70,000 MRED as Distributed by MLS Grid
- 2022-06-02 Contingent — RMLSA as Distributed by MLS Grid
- 2021-11-23 Listed $73,900 RMLSA as Distributed by MLS Grid
- 2021-11-23 Listed $73,900 MRED as Distributed by MLS Grid
- 2021-08-06 Listing Removed — RMLSA as Distributed by MLS Grid
- 2021-08-06 Listing Removed — RMLSA as Distributed by MLS Grid
- 2016-01-22 Listing Removed — MRED as Distributed by MLS Grid
- 2015-11-20 Listing Removed — MRED as Distributed by MLS Grid
- 2009-09-23 Sold (Public Records) $76,500 Public Records
- 2009-09-23 Sold (MLS) $76,500 RMLSA as Distributed by MLS Grid
- 2009-09-23 Sold (MLS) $76,500 MRED as Distributed by MLS Grid
- 2009-08-19 Listed $79,900 RMLSA as Distributed by MLS Grid
- 2009-08-19 Listed $79,900 MRED as Distributed by MLS Grid
- 2007-07-03 Sold (MLS) $65,000 RMLSA as Distributed by MLS Grid
- 2007-07-03 Sold (MLS) $65,000 MRED as Distributed by MLS Grid
- 2007-05-03 Listed $75,000 RMLSA as Distributed by MLS Grid
- 2007-05-03 Listed $75,000 MRED as Distributed by MLS Grid
- 2006-07-26 Sold (MLS) $50,000 RMLSA as Distributed by MLS Grid
- 2006-06-20 Listed $54,500 RMLSA as Distributed by MLS Grid
Property tax history
+1.0%/yrLatest (2024): $1,689 · -3.4% YoY. Source: county tax records.
Cash-flow waterfall
monthlySold comps — $/sqft
last 12 mo · ≤1 miLoading sold comps…