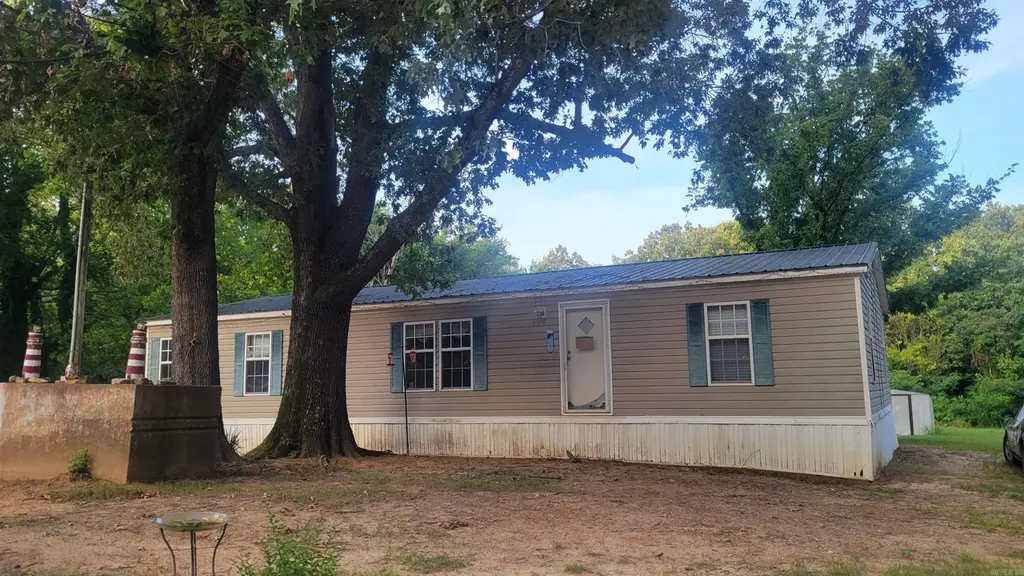
376 1st · Black Rock, AR
Flood risk No data
- FEMA flood zone
- —
- Chance of flooding over 30 yrs
- —
- Est. flood insurance / yr
- —
Fire risk No data
- Est. fire insurance / yr
- —
Heat risk No data
- Hot days now (above threshold)
- —
- Hot days in 30 yrs
- —
Wind risk No data
- Chance of severe wind over 30 yrs
- —
Air-quality risk No data
- Unhealthy air days now
- —
- Unhealthy air days in 30 yrs
- —
Risk factors via First Street. Map © Google.
Why this score? — see what drove the B- grade
The composite is a weighted blend of 9 inputs, each scored 0–100. Each bar is that input's sub-score; the figure is the points it added to the 100-point composite (weight × sub-score).
- Cash flow +27.1/30.0
- DSCR +9.4/10.0
- ARV discount +7.5/15.0
- 1% rule +7.3/10.0
- Appreciation +5.0/10.0
- Livability +3.2/5.0
- Rent growth +2.5/5.0
- Condition / age +2.5/5.0
- Schools +2.0/10.0
$90,000
🖨 Deal sheet 📄 Offer letter ✓ Due diligence
Listing remarks MLS
Mobile home located in Black Rock. Features 2 bedrooms, 2 bathrooms and is situated on one acre. Wooded lot. Home is being sold as-is. Storage building in backyard.
Key facts
- Wooded lot
- Storage building
- 1 acre lot
Tags
Neighborhood map
What this means for you Summary
Snapshot
- This is a 3-bed/2.0-bath manufactured listed at $90k.
Deal economics
- At list price, monthly cash flow is $255 ($3k/yr) — positive.
- The deal already cash-flows at list — no discount required.
- Meets the 1% rule at list price ($1k rent vs $90k).
- Recommended offer: $82k (9.0% below list) — sets the bar for market timing.
Location & tenants
- Location reads 63/100 on livability (#196 in AR) — a middle-class / working-renter tenant base. Strengths: crime A+, cost of living A+, housing A+; Watch: schools F, amenities F, commute F.
- Lawrence County School District (town): math 24% / reading 25% proficiency, ranked #188 of 238 in AR (top 79%) — low school quality limits family demand, transient renter base, plan for 1-2y turnover.
- Market conditions: 9 active listings in the ZIP; 63 units permitted in Lawrence County in 2024 (15 in 5+ unit buildings).
Forward outlook
- In year one you build about $3k of equity ($622 loan paydown + $3k appreciation (3.0% local appreciation)).
- Lawrence County population projected at -23% by 2050 — secular population decline; favor cash flow + early exit over multi-decade hold.
- At projected returns (3.0% appreciation + 3.0% rent growth), your $25k cash investment doubles in ~4 years — after that, you're playing with house money.
- By year 10, paydown + projected appreciation supports a ~$32k cash-out refi (75% LTV) — recoverable capital for the next deal without selling this one.
Negotiation context
- It's been on market 112 days — a 9% lower offer ($82k) is reasonable based on typical stale-listing flexibility.
- 10 sale attempts since 3y ago with the ask held roughly flat each time — persistent listings suggest the price (not the market) is what's stuck; bring a comps-based counter.
Questions for the listing agent
- It's been on market 112 days. Have you received any prior offers? Is the seller open to a 9% concession, seller financing, or rate buy-down credit?
- Why hasn't it sold? Are there any deal-killer items the seller is aware of (foundation, flood, title, zoning, code violations)?
- Is there a deadline driving the sale (1031 exchange, divorce, estate, relocation)? That informs how much negotiation room exists.
- Schools are F-rated, which usually means shorter tenancies and higher turnover. Who's the typical renter profile here, and what's been the actual vacancy rate?
- What's the average days-on-market for RENTAL listings here right now (not sales)? A rising rental-DOM trend means longer vacancies and softer asking-rent achievability than the comps imply.
- What's the recent tenant-quality profile in this submarket — average credit score on applications, eviction rate, late-payment / NSF rate, and stable-employment percentage? A property-management company in the area should have these aggregated.
- How much new for-sale + rental construction is in the pipeline within 1–3 miles? Heavy new supply typically softens prices + rents 12–24 months out; constrained supply supports both.
Investment metrics
- 1% rule
- 1.23% ✓
- Cap rate
- 9.69%
- Cash-on-cash
- 12.13%
- DSCR
- 1.54
- GRM
- 6.8
CMA / ARV
No comps found within radius.
Projected returns pro-forma
3.0% appreciation · 3.0% rent growth · sell at horizon
- IRR
- 18.9%
- Equity multiple
- 2.07×
- Total profit
- $27,088
- Equity at exit
- $40,468
- IRR
- 20.2%
- Equity multiple
- 3.93×
- Total profit
- $73,723
- Equity at exit
- $62,366
Cash invested: $25,200 (down + closing). Projections, not guarantees.
Landlord ↔ Tenant lean methodology
- Overall (STATE)
- 92 Strongly Landlord-Friendly
- State Arkansas
- 92 Strongly Landlord-Friendly · R+14
- County
- — inherits STATE
- City
- — inherits STATE
ZIP-level market 72415
- Active inventory
- 9
- Price-to-rent
- 6.8×
Monthly cashflow live
- Estimated rent
- $1,110 medium interval (Pro) →
- Mortgage (P&I)
- −$472
- Tax est. 1.5%
- −$112 /mo · $1,350/yr
- Insurance
- −$38
- HOA
- −$0
- Vacancy / Maint / Mgmt
- −$233
- Net cashflow
- $255
Break-even live
UW: 25.0% down · 7.5% · 30yr · 1.5% tax · 5.0% vac · 8.0% maint · 8.0% mgmt
Financing live
Cash to close
- Down payment
- $22,500
- Closing costs
- $2,700
- Reserves months
- —
- Total cash needed
- —
Loan-product check · same deal, 3 products live
Conventional
25% down · 7.5% · 30yr
- Down + closing
- —
- Monthly P&I
- —
- Monthly cashflow
- —
- DSCR
- —
- Eligible?
- —
Personal DTI + credit; lowest rate.
DSCR
20% down · 8.5% · 30yr
- Down + closing
- —
- Monthly P&I
- —
- Monthly cashflow
- —
- DSCR
- —
- Eligible?
- —
No personal income docs; deal must DSCR.
Hard money
10% down · 12.0% · 12mo
- Down + closing
- —
- Monthly P&I
- —
- Monthly cashflow
- —
- DSCR
- —
- Eligible?
- —
Short-term bridge; refi at stabilization.
Listing history 32 events
-
2026-06-19days on market $90,000 Active 112 DOM
-
2026-06-18days on market $90,000 Active 111 DOM
-
2026-06-17days on market $90,000 Active 110 DOM
-
2026-06-16days on market $90,000 Active 109 DOM
-
2026-06-15days on market $90,000 Active 108 DOM
-
2026-06-14days on market $90,000 Active 106 DOM
-
2026-06-12days on market $90,000 Active 105 DOM
-
2026-06-09days on market $90,000 Active 102 DOM
-
2026-06-08days on market $90,000 Active 101 DOM
-
2026-06-07days on market $90,000 Active 100 DOM
-
2026-06-07days on market $90,000 Active 99 DOM
-
2026-06-04days on market $90,000 Active 96 DOM
-
2026-06-02days on market $90,000 Active 95 DOM
-
2026-06-01days on market $90,000 Active 94 DOM
-
2026-05-31days on market $90,000 Active 93 DOM
-
2026-05-31days on market $90,000 Active 92 DOM
-
2026-02-27$90,000 New Listing 164-char remark
Show marketing remark (164 chars)
Mobile home located in Black Rock. Features 3 bedrooms, 2 bathrooms and is situated on one acre. Wooded lot. Home is being sold as-is. Storage building in backyard.
-
2026-02-27$90,000 Active 164-char remark
Show marketing remark (164 chars)
Mobile home located in Black Rock. Features 3 bedrooms, 2 bathrooms and is situated on one acre. Wooded lot. Home is being sold as-is. Storage building in backyard.
-
2026-01-15historical
-
2025-07-21$90,000 Active
-
2025-07-21$90,000 New Listing
-
2025-03-25historical
-
2024-11-05$90,000 Active
-
2024-11-05$90,000 New Listing
-
2024-07-12historical
-
2024-05-23status Active
-
2024-05-23status Back on Market
-
2024-05-02historical
-
2024-05-01status Under Contract
-
2023-02-17price $90,000
-
2023-01-11$105,000 New Listing
-
2023-01-11$90,000 Active
ⓘ Source: listings_history table (triggers on properties + properties_extension) + one-shot
backfill from property_details.listing_events for pre-trigger history.
Nearby sold comps map
Loading sold comps map…
Walkable amenities ~0.75 mi
Loading nearby amenities…
Taxation est. · year 1
- Rental income
- $13,318
- − Mortgage interest
- −$5,041
- − Property taxes
- −$1,350
- − Insurance
- −$450
- − Repairs & maintenance
- −$1,065
- − Management
- −$1,065
- − Depreciation
- −$2,618
- Taxable income
- $1,728
- Est. tax owed @ 24.0%
- −$415
- After-tax cash flow
- $2,643/yr
For passive investors: Depreciation is non-cash, so a rental often shows a tax loss while cash-flowing — sheltering income. Rental losses are passive: they offset passive income freely, and up to $25,000/yr can offset ordinary (W-2) income if you actively participate and your MAGI is under $100k (phasing out to $0 by $150k); unused losses carry forward. On sale, claimed depreciation is recaptured at up to 25%, and gains may owe capital-gains tax (a 1031 exchange can defer both). Figures are a year-1 estimate at your 24.0% rate — not tax advice; consult a CPA.
Schools (NCES district)
- District
- Lawrence County School District
- NCES district ID
- 0500082
- Math proficiency
- 24% ▼ -21.00%
- Reading proficiency
- 25% ▼ -13.00%
- Median HH income
- $34,340
- Composite
- 20.15/100
- National rank
- #8637
- State rank
- #188 of 238 in AR
Livability — Black Rock
- Score
- 63/100
- State rank
- #196
- US rank
- #15493
Category grades
Schools grade is shown separately in the Schools card above.
Census & demographics
- Census place
- Black Rock, AR
- Population (ZIP)
- 1,136
Population outlook (Lawrence County) Hauer SSP2
- Today (2025)
- 15,453 people
- By 2030
- 14,697 · -4.9%
- By 2040
- 13,247 · -14.3%
- By 2050
- 11,937 · -22.8%
- By 2075
- 9,466 · -38.7%
- By 2100
- 7,441 · -51.8%
Race, ethnicity, and origin ACS 2023
- Neighborhood character
- Predominantly White (96%)
- Race & ethnicity
- White 96% Two or more races 4%
- Common ancestry
- Slovak 5% Lithuanian 2% Portuguese 1%
Political lean MEDSL · Lawrence
- 2024 margin
- Solid R (+64.0) · D 16.9% · R 81.0% · Other 2.1%
- 2008→2024 swing
- -43.1pp toward R · 2008: -20.9pp · 2024: -64.0pp
- All cycles
- 2024: R+64.0 2020: R+59.6 2016: R+49.8 2012: R+31.6 2008: R+20.9
Not yet ingested
- Civics
- —
Market trends
- HPI YoY
- —
- Current HPI
- —
- Rent YoY
- —
- Metro
- —
- State GDP YoY
- ▲ 3.80%
- F500 in state
- 10
Industry mix (Fortune 500 HQ in AR)
| Industry | F500 HQs | Revenue |
|---|---|---|
| Retail | 1 | $681B |
|
||
| Food / Agriculture | 1 | $53B |
|
||
| Retail / Energy | 1 | $22B |
|
||
| Transportation / Logistics | 1 | $12B |
|
||
| Energy | 1 | $4B |
|
||
Price history
-14.3% since first listed16 events — show timeline
- 2026-02-27 Listed $90,000 NEABOR MLS
- 2026-02-27 Listed $90,000 CARMLS
- 2026-01-15 Listing Removed — CARMLS
- 2025-07-21 Listed $90,000 CARMLS
- 2025-07-21 Listed $90,000 NEABOR MLS
- 2025-03-25 Listing Removed — CARMLS
- 2024-11-05 Listed $90,000 CARMLS
- 2024-11-05 Listed $90,000 NEABOR MLS
- 2024-07-12 Listing Removed — CARMLS
- 2024-05-23 Relisted — NEABOR MLS
- 2024-05-23 Relisted — CARMLS
- 2024-05-02 Delisted — NEABOR MLS
- 2024-05-01 Pending — CARMLS
- 2023-02-17 Price Changed $90,000 CARMLS
- 2023-01-11 Listed $90,000 NEABOR MLS
- 2023-01-11 Listed $105,000 CARMLS
Property tax history
-8.0%/yrLatest (2025): $21 · +0.0% YoY. Source: county tax records.
Cash-flow waterfall
monthlySold comps — $/sqft
last 12 mo · ≤1 miLoading sold comps…