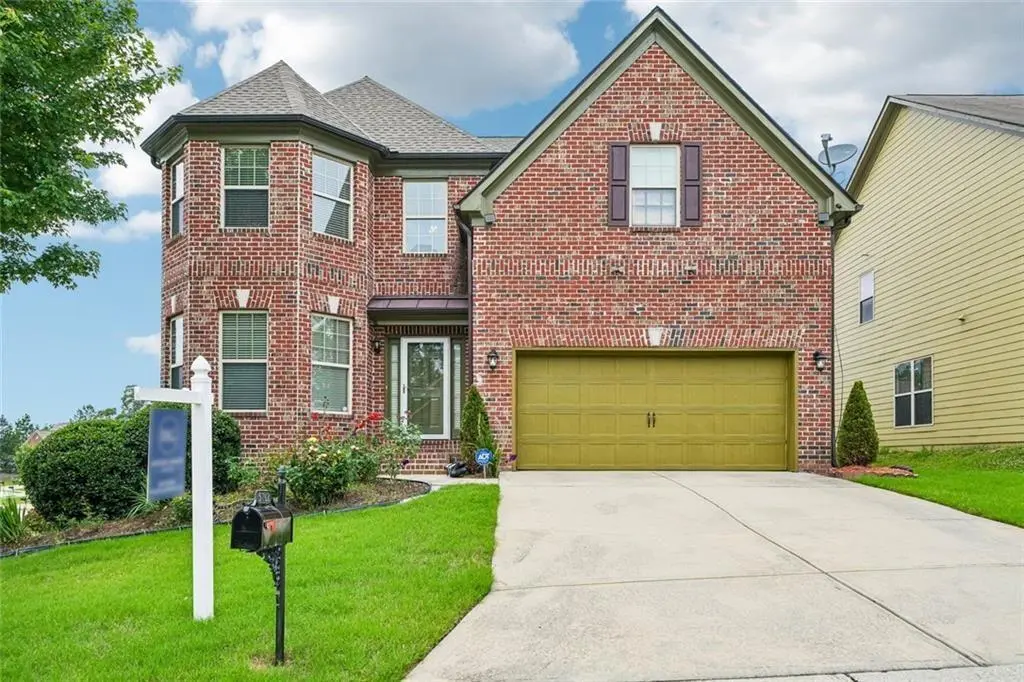
5742 Barrington Run · Union City, GA
Flood risk 1/10 · Minimal
- FEMA flood zone
- X (unshaded)
- Chance of flooding over 30 yrs
- 0.0%
- Est. flood insurance / yr
- $507 – $1,088
Fire risk 4/10 · Minor
- Est. fire insurance / yr
- $963 – $1,789
Heat risk 6/10 · Moderate
- Hot days now (above 104°F)
- 7 days/yr
- Hot days in 30 yrs
- 19 days/yr
Wind risk 6/10 · Moderate
- Chance of severe wind over 30 yrs
- 27.0%
Air-quality risk 4/10 · Minor
- Unhealthy air days now
- 4 days/yr
- Unhealthy air days in 30 yrs
- 6 days/yr
Risk factors via First Street. Map © Google.
Why this score? — see what drove the D- grade
The composite is a weighted blend of 9 inputs, each scored 0–100. Each bar is that input's sub-score; the figure is the points it added to the 100-point composite (weight × sub-score).
- Appreciation +10.0/10.0
- Cash flow +7.1/30.0
- Schools +4.5/10.0
- ARV discount +4.4/15.0
- Rent growth +3.1/5.0
- Livability +2.9/5.0
- Condition / age +2.5/5.0
- DSCR +1.3/10.0
- 1% rule +0.7/10.0
$399,999
🖨 Deal sheet (PDF) 📄 Offer letter ✓ Due diligence
Listing remarks MLS
This beautiful home is minutes way from the Hartsfield-Jackson Airport. This home is a 4 bedroom 3 1/2 bath with lots of room to grow. Come check out the unfinished basement, and create an additional area for great expansion to this marvelous home. Barrington Subdivision is one of the most in-demand to reside in the city of Union City. Only minutes from downtown Atlanta via I-85 Barrington run is conveniently located to the city of Atlanta. The community was built in 2019 with wonderful amenities such as a swimming pool, playground, tennis court and evening walking. There are nearby shopping centers within a few miles, along with Ronald Bridges Park if you would like to take a nice morning walk.
Key facts
- Tennis court
- Unfinished basement
- Swimming pool
Tags
Property features AI
Finance
- Other: Directions: Use GPS
- HOA & community: Homeowners association with an annual fee of $480 covering access to the community pool; Community amenities include a pool and a playground
Exterior
- Parking: Garage parking (2 spaces total)
- Utilities: Public water; Public sewer; 110-volt electric; Cable available; Electricity available; Sewer available; Water available; Natural gas available
- Home design: Two levels; Resale property
- Construction: Frame and brick construction; Composition roof; Concrete perimeter foundation; Built/maintained as of resale (confirmed data)
- Exterior features: Deck; Asphalt road frontage on a county road
Interior
- Kitchen: Dishwasher; Refrigerator; Microwave
- Bedrooms: Four bedrooms on the upper level
- Flooring: Laminate; Carpet
- Bathrooms: Three full bathrooms; One half bathroom on the main level; Master bath with double vanity and soaking tub
- Heating & cooling: Forced air heating; Central air conditioning
- Interior features: High 10-ft ceilings on the main level; One fireplace located in the family room; Full basement; No shared/common walls
- Laundry & utility: Dryer; Gas water heater; Laundry in a common area and a laundry closet
Neighborhood map
What this means for you Summary
Snapshot
- This is a 4-bed/3.0-bath single-family listed at $400k.
Deal economics
- At list price, monthly cash flow is $-567 ($-7k/yr) — negative.
- To cash-flow at today's rent, offer at most $300k (25.0% below list).
- To meet the 1% rule (rent ≥ 1% of price), the offer needs to be $230k (42.5% below list).
- Recommended offer: $230k (42.5% below list) — sets the bar for 1% rule.
Location & tenants
- Location reads 58/100 on livability (#443 in GA) — a working-class tenant base; expect higher turnover. Strengths: cost of living A+, housing A+; Watch: crime D+, amenities F, commute F.
- Fulton County (suburban): math 49% / reading 53% proficiency, ranked #12 of 174 in GA (top 7%) — acceptable for families but not a draw, mixed tenant base, ~2y average lease.
- Zoned schools: Bethune Elementary School (math 17% / reading 22%, grade F, #878 of 1,228 statewide, top 75%, 524 students, 100% FRL); Banneker High School (math 24% / reading 75%, grade D+, #28 of 424 statewide, top 7%, 1,610 students, 100% FRL) — zoned schools average 100% FRL vs 41% district-wide (59 pts higher); higher-poverty schools than district average — tighter screening recommended.
- Zoned-school proficiency averages 35% at this address vs 51% district-wide (-16 pts) — the specific schools serving this property underperform the Fulton County average; the district grade overstates school quality for this exact location.
- Market conditions: Rents rising (+2.2%/yr); 167 active listings in the ZIP; 4 comparable units currently listed for rent nearby; rentals lingering (median 45d on market — plan ~5-8 weeks vacancy on turnover, expect pricing pressure); 75% of comp listings sitting > 30 days — soft ceiling on asking rent; 11,565 units permitted in Fulton County in 2024 (8,159 in 5+ unit buildings).
- At $2,298/mo this rent would consume 57% of the median local household income ($48k/yr) (locally 1778% of renters already pay >50% of income on rent) — very limited rent-growth headroom before tenants either downsize or default.
Forward outlook
- In year one you build about $43k of equity ($3k loan paydown + $40k appreciation (10.0% local appreciation)).
- Fulton County population projected at +38% by 2050 — long-run rental-demand tailwind backs the buy-and-hold thesis.
- By year 2, paydown + projected appreciation supports a ~$69k cash-out refi (75% LTV) — recoverable capital for the next deal without selling this one.
Negotiation context
- Only 6 days on market — expect competitive offers; lowballing is unlikely to land.
- 2 sale attempts with the ask held roughly flat each time — persistent listings suggest the price (not the market) is what's stuck; bring a comps-based counter.
- Current owner paid $190k; list at $400k implies a 111% gain — meaningful room to come down on a strong offer.
Risks & watch-outs
- Climate carrying-cost: major wind risk, 27% chance of damaging wind over 30y; extreme-heat days projected 7→19/yr by 2055 (HVAC capex compounding) — expect insurance premiums to compound above CPI over the hold.
Questions for the listing agent
- What do current leases actually rent for vs. the listed asking? Can we see a recent rent roll and the last 12 months of T-12 income?
- What does the HOA fee cover, when was the last increase, and are there any pending special assessments or reserve-fund shortfalls?
- Is there a deadline driving the sale (1031 exchange, divorce, estate, relocation)? That informs how much negotiation room exists.
- Schools are F-rated, which usually means shorter tenancies and higher turnover. Who's the typical renter profile here, and what's been the actual vacancy rate?
- Crime grade is D in this area — have there been break-ins, vandalism, or insurance claims at this property in the last 3 years? What carrier currently insures it and at what premium?
- The area grade is low — what's the realistic commute time and amenity access for the typical tenant pool here? Any planned neighborhood developments (good or bad) we should know about?
- What's the average days-on-market for RENTAL listings here right now (not sales)? A rising rental-DOM trend means longer vacancies and softer asking-rent achievability than the comps imply.
- What's the recent tenant-quality profile in this submarket — average credit score on applications, eviction rate, late-payment / NSF rate, and stable-employment percentage? A property-management company in the area should have these aggregated.
- How much new for-sale + rental construction is in the pipeline within 1–3 miles? Heavy new supply typically softens prices + rents 12–24 months out; constrained supply supports both.
Investment metrics
- 1% rule
- 0.57% ✗
- Cap rate
- 4.59%
- Cash-on-cash
- -6.08%
- DSCR
- 0.73
- GRM
- 14.5
CMA / ARV
- ARV (on-the-fly)
- $374,070
- Comps found
- 3
Show comp detail 3 sales within ~0.75 mi
| Address | Dist | Beds/Ba | Sqft | Sold | Price | $/sf | Match |
|---|---|---|---|---|---|---|---|
| 5606 Village Pkwy | 0.11mi | 4/3.0 | 2,885 (-14%) | 10mo | $367,000 | $127 | 62 |
| 5809 Providence Ct | 0.12mi | 5/3.5 (+1) | 2,971 (-12%) | 18mo | $330,000 | $111 | 53 |
| 5509 Village Trce | 0.21mi | 4/2.5 | 2,871 (-15%) | 14mo | $311,000 | $108 | 52 |
Match score weights: distance 35% · size 25% · config 20% · recency 20%. Top-matched comps best support the ARV.
Projected returns pro-forma
10.0% appreciation · 2.2% rent growth · sell at horizon
- IRR
- 19.8%
- Equity multiple
- 2.60×
- Total profit
- $179,693
- Equity at exit
- $360,351
- IRR
- 18.0%
- Equity multiple
- 5.94×
- Total profit
- $553,572
- Equity at exit
- $777,110
Cash invested: $112,000 (down + closing). Projections, not guarantees.
Landlord ↔ Tenant lean methodology
- Overall (STATE)
- 90 Strongly Landlord-Friendly
- State Georgia
- 90 Strongly Landlord-Friendly · R+3
- County
- — inherits STATE
- City
- — inherits STATE
ZIP-level market 30291
- Home prices YoY
- 11.1%
- Rents YoY
- 2.2%
- Active inventory
- 167
- Price-to-rent
- 14.5×
Monthly cashflow live
- Estimated rent
- $2,298 medium interval (Pro) →
- Mortgage (P&I)
- −$2,098
- Tax from tax record
- −$78 /mo · $939/yr
- Insurance
- −$167
- HOA
- −$40
- Vacancy / Maint / Mgmt
- −$483
- Net cashflow
- $-567
Break-even live
Sensitivity live
| Price | -10% $-341 | -5% $-454 | +0% $-567 | +5% $-680 | +10% $-794 |
|---|---|---|---|---|---|
| Rent | -10% $-749 | -5% $-658 | +0% $-567 | +5% $-476 | +10% $-386 |
| Rate | -1.0pp $-366 | -0.5pp $-465 | base $-567 | +0.5pp $-671 | +1.0pp $-776 |
UW: 25.0% down · 7.5% · 30yr · 1.5% tax · 5.0% vac · 8.0% maint · 8.0% mgmt
Financing live
Cash to close
- Down payment
- $100,000
- Closing costs
- $12,000
- Reserves months
- —
- Total cash needed
- —
Loan-product check · same deal, 3 products live
Conventional
25% down · 7.5% · 30yr
- Down + closing
- —
- Monthly P&I
- —
- Monthly cashflow
- —
- DSCR
- —
- Eligible?
- —
Personal DTI + credit; lowest rate.
DSCR
20% down · 8.5% · 30yr
- Down + closing
- —
- Monthly P&I
- —
- Monthly cashflow
- —
- DSCR
- —
- Eligible?
- —
No personal income docs; deal must DSCR.
Hard money
10% down · 12.0% · 12mo
- Down + closing
- —
- Monthly P&I
- —
- Monthly cashflow
- —
- DSCR
- —
- Eligible?
- —
Short-term bridge; refi at stabilization.
Rent comps 4 comps
| Address | Beds | Baths | Sqft | Rent | $/sqft | DOM | Units | Dist |
|---|---|---|---|---|---|---|---|---|
| 255 Buffington Dr Union City, GA | 3.0 | 2.0 | 3000 | $1,795 | $0.60 | 44d | 1 | 0.44mi |
| 7225 Boulder Pass Union City, GA | 4.0 | 3.5 | 2436 | $2,299 | $0.94 | 21d | 1 | 0.86mi |
| 610 Dot Dr Atlanta, GA | 4.0 | 2.5 | 3202 | $2,656 | $0.83 | 44d | 1 | 1.39mi |
| 7286 Madison Cir Union City, GA | 3.0 | 2.0 | 2608 | $2,200 | $0.84 | 44d | 1 | 1.49mi |
HOA detail
- Monthly dues
- $40 · $480/yr
- Likely covers
- pool
Listing history 5 events
-
2026-06-09days on market $399,999 Active 6 DOM
-
2026-06-08days on market $399,999 Active 5 DOM
-
2026-06-07days on market $399,999 Active 4 DOM
-
2026-06-04remarks 699-char remark
-
2026-06-04$399,999 Active 1 DOM
ⓘ Source: listings_history table (triggers on properties + properties_extension) + one-shot
backfill from property_details.listing_events for pre-trigger history.
Tax reassessment forecast GA · Resets to sale price
- Current annual tax
- $939 · $78/mo
- Projected year-2 tax
- $3,680 · $307/mo
- Expected delta
- +$2,741/yr (+$228/mo · 291.7%)
ⓘ Screening estimate from a state-policy table — verify with the county assessor before closing.
Climate risk First Street
- Flood 1/10 Low FEMA zone X (unshaded) · 0% chance over 30 yrs
- Wildfire 4/10 Moderate
- Heat 6/10 Major 7 d/yr ≥104°F today · 19 d/yr by 30 yrs out
- Wind 6/10 Major 27% chance of damaging wind over 30 yrs
- Air quality 4/10 Moderate 4 unhealthy d/yr today · 6 by 30 yrs out
Nearby sold comps map
Loading sold comps map…
Walkable amenities ~0.75 mi
Loading nearby amenities…
Taxation est. · year 1
- Rental income
- $27,576
- − Mortgage interest
- −$22,406
- − Property taxes
- −$939
- − Insurance
- −$2,000
- − Repairs & maintenance
- −$2,206
- − Management
- −$2,206
- − HOA
- −$480
- − Depreciation
- −$11,636
- Taxable loss
- −$14,298
- Est. tax savings @ 24.0%
- +$3,431
- After-tax cash flow
- $-3,374/yr
For passive investors: Depreciation is non-cash, so a rental often shows a tax loss while cash-flowing — sheltering income. Rental losses are passive: they offset passive income freely, and up to $25,000/yr can offset ordinary (W-2) income if you actively participate and your MAGI is under $100k (phasing out to $0 by $150k); unused losses carry forward. On sale, claimed depreciation is recaptured at up to 25%, and gains may owe capital-gains tax (a 1031 exchange can defer both). Figures are a year-1 estimate at your 24.0% rate — not tax advice; consult a CPA.
Schools (NCES district)
- District
- Fulton County
- NCES district ID
- 1302280
- Math proficiency
- 49% ▼ -2.00%
- Reading proficiency
- 53% ▬ 0.00%
- Median HH income
- $68,035
- Composite
- 45.33/100
- National rank
- #2640
- State rank
- #12 of 174 in GA
Livability — Union City
- Score
- 58/100
- State rank
- #443
- US rank
- #21281
Category grades
Schools grade is shown separately in the Schools card above.
Census & demographics
- Census place
- Union City, GA
- County
- Fulton County · 1,094,430 people
- City population
- 25,130
- Metro
- Atlanta-Sandy Springs-Alpharetta, GA
- Population (ZIP)
- 25,130
- Household income
- $48,184
- Rent vs Own
- Severe rent burden
- 1778.0
Population outlook (Fulton County) Hauer SSP2
- Today (2025)
- 1,203,707 people
- By 2030
- 1,299,706 · +8.0%
- By 2040
- 1,488,256 · +23.6%
- By 2050
- 1,664,580 · +38.3%
- By 2075
- 2,036,072 · +69.2%
- By 2100
- 2,222,402 · +84.6%
Race, ethnicity, and origin ACS 2023
- Neighborhood character
- Predominantly Black (86%)
- Race & ethnicity
- Black 86% Hispanic / Latino 7% Two or more races 6% White 3%
- Hispanic origin (detail)
- Mexican 4%
- Common ancestry
- Italian 1%
- Foreign-born
- 5% · Canada
- Languages at home
- 92% English-only · Spanish 6%
Political lean MEDSL · Fulton
- 2024 margin
- Solid D (+44.9) · D 71.9% · R 27.0% · Other 1.1%
- 2008→2024 swing
- +9.8pp toward D · 2008: 35.0pp · 2024: 44.9pp
- All cycles
- 2024: D+44.9 2020: D+46.4 2016: D+42.1 2012: D+29.6 2008: D+35.0
Not yet ingested
- Civics
- —
Market trends
- HPI YoY
- ▲ 23.98%
- Current HPI
- 239.3471
- Rent YoY
- ▲ 2.20%
- Metro
- Atlanta-Sandy Springs-Alpharetta, GA
- State GDP YoY
- ▲ 2.66%
- F500 in state
- 28
Industry mix (Fortune 500 HQ in GA)
| Industry | F500 HQs | Revenue |
|---|---|---|
| Paper / Packaging | 2 | $29B |
|
||
| Retail | 1 | $160B |
|
||
| Transportation / Logistics | 1 | $91B |
|
||
| Airlines | 1 | $62B |
|
||
| Consumer Goods | 1 | $47B |
|
||
| Utilities | 1 | $25B |
|
||
Price history
+110.6% since first listed3 events — show timeline
- 2026-06-03 Listed $399,999 GAMLS
- 2026-06-03 Listed $399,999 FMLS
- 2008-11-10 Sold (Public Records) $189,900 Public Records
Property tax history
-3.8%/yrLatest (2025): $939 · +4.0% YoY. Source: county tax records.
Cash-flow waterfall
monthlySold comps — $/sqft
last 12 mo · ≤1 miLoading sold comps…