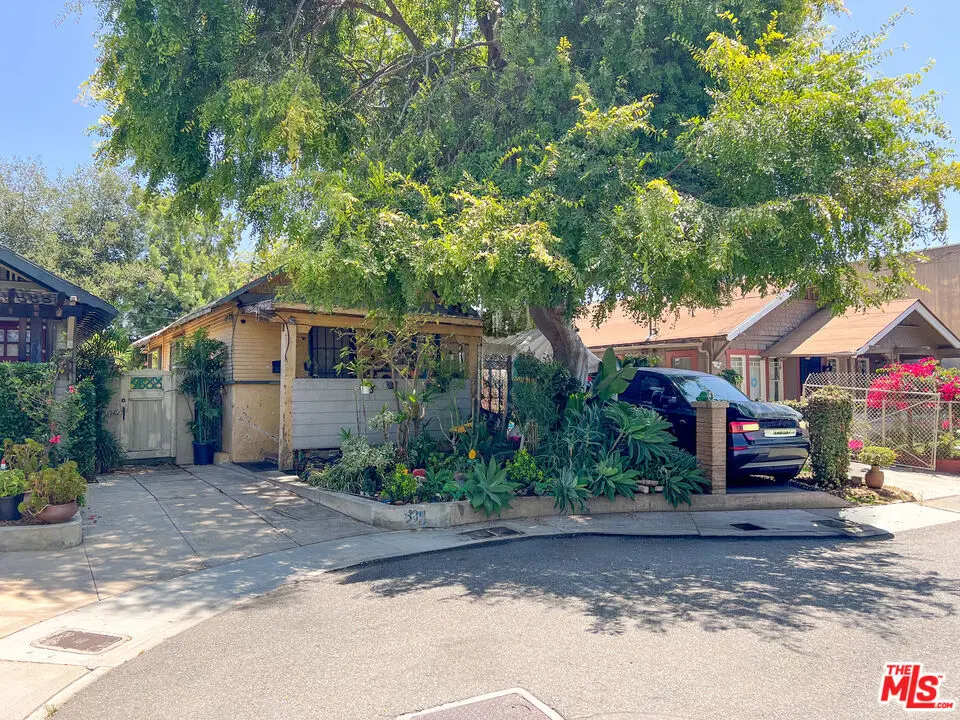
534 Concordia Ct · Pasadena, CA
Flood risk 1/10 · Minimal
- FEMA flood zone
- X (unshaded)
- Chance of flooding over 30 yrs
- 0.0%
- Est. flood insurance / yr
- $507 – $1,088
Fire risk 1/10 · Minimal
- Est. fire insurance / yr
- $659 – $1,223
Heat risk 6/10 · Moderate
- Hot days now (above 97°F)
- 7 days/yr
- Hot days in 30 yrs
- 21 days/yr
Wind risk 1/10 · Minimal
- Chance of severe wind over 30 yrs
- —
Air-quality risk 6/10 · Moderate
- Unhealthy air days now
- 11 days/yr
- Unhealthy air days in 30 yrs
- 12 days/yr
Risk factors via First Street. Map © Google.
Why this score? — see what drove the B- grade
The composite is a weighted blend of 9 inputs, each scored 0–100. Each bar is that input's sub-score; the figure is the points it added to the 100-point composite (weight × sub-score).
- Cash flow +25.9/30.0
- DSCR +8.7/10.0
- ARV discount +7.5/15.0
- Appreciation +7.4/10.0
- 1% rule +5.7/10.0
- Schools +4.6/10.0
- Livability +3.6/5.0
- Rent growth +2.9/5.0
- Condition / age +2.5/5.0
$300,000
🖨 Deal sheet 📄 Offer letter ✓ Due diligence
Listing remarks
Property has existing health & safety building code violations issued by the City of Pasadena, to be remediated by the buyer post-close. Buyers to conduct their own due diligence and independently verify all information with appropriate entities and satisfy self. Major fixer in Pasadena! Opportunity to reposition, redevelop, or restore in a central Pasadena location with commercial-overlay zoning potential - Ideal for investors, builders, flippers, or owner-users. Zoned PSC (Pasadena Specific Commercial) which provides flexibility beyond traditional SFR and may allow for mixed-use, live/work, or potential redevelopment (Buyer to verify). Located minutes from Old Town Pasadena, along F
Key facts
- 2,638 sq ft lot
- Parking
- Built 1903
Neighborhood map
What this means for you Summary
Snapshot
- This is a 2-bed/1.0-bath single-family listed at $300k.
Deal economics
- At list price, monthly cash flow is $740 ($9k/yr) — positive.
- The deal already cash-flows at list — no discount required.
- Meets the 1% rule at list price ($3k rent vs $300k).
- Cap rate 9.3% vs local median 1.5% in Pasadena — top-decile yield for the area; either an underpriced asset or a hidden risk that comps aren't pricing in. Stress-test before assuming the spread holds.
Location & tenants
- Location reads 72/100 on livability (#181 in CA) — a middle-class / working-renter tenant base. Strengths: amenities A+, commute A+, employment A+; Watch: schools D+, health & safety D+, crime F.
- Pasadena Unified (urban): math 42% / reading 60% proficiency, ranked #123 of 517 in CA (top 24%) — acceptable for families but not a draw, mixed tenant base, ~2y average lease.
- Market conditions: Rents rising (+1.6%/yr); 60 active listings in the ZIP; 40 comparable units currently listed for rent nearby; rentals leasing fast (median 14d on market — plan ~1-2 weeks tenant-placement turnaround); high-income renter base; 19,697 units permitted in Los Angeles County in 2024 (9,426 in 5+ unit buildings).
Forward outlook
- In year one you build about $16k of equity ($2k loan paydown + $14k appreciation (4.8% local appreciation)).
- Los Angeles County population projected at +9% by 2050 — modest demand growth; plan on rents tracking national, not racing it.
- At projected returns (4.8% appreciation + 1.6% rent growth), your $84k cash investment doubles in ~4 years — after that, you're playing with house money.
- By year 3, paydown + projected appreciation supports a ~$41k cash-out refi (75% LTV) — recoverable capital for the next deal without selling this one.
Negotiation context
- Only 14 days on market — expect competitive offers; lowballing is unlikely to land.
Risks & watch-outs
- Watch-outs: built in 1903 — expect roof / HVAC / electrical / plumbing capex.
- Climate carrying-cost: extreme-heat days projected 7→21/yr by 2055 (HVAC capex compounding) — expect insurance premiums to compound above CPI over the hold.
Questions for the listing agent
- Built in 1903 — when were the roof, HVAC, electrical panel, plumbing, and water heater last replaced?
- Is there a deadline driving the sale (1031 exchange, divorce, estate, relocation)? That informs how much negotiation room exists.
- Schools are D-rated, which usually means shorter tenancies and higher turnover. Who's the typical renter profile here, and what's been the actual vacancy rate?
- Crime grade is F in this area — have there been break-ins, vandalism, or insurance claims at this property in the last 3 years? What carrier currently insures it and at what premium?
- What's the average days-on-market for RENTAL listings here right now (not sales)? A rising rental-DOM trend means longer vacancies and softer asking-rent achievability than the comps imply.
- What's the recent tenant-quality profile in this submarket — average credit score on applications, eviction rate, late-payment / NSF rate, and stable-employment percentage? A property-management company in the area should have these aggregated.
- How much new for-sale + rental construction is in the pipeline within 1–3 miles? Heavy new supply typically softens prices + rents 12–24 months out; constrained supply supports both.
Investment metrics
- 1% rule
- 1.07% ✓
- Cap rate
- 9.25%
- Cash-on-cash
- 10.57%
- DSCR
- 1.47
- GRM
- 7.8
CMA / ARV
- ARV (on-the-fly)
- $976,336
- Comps found
- 4
Show comp detail 4 sales within ~0.75 mi
| Address | Dist | Beds/Ba | Sqft | Sold | Price | $/sf | Match |
|---|---|---|---|---|---|---|---|
| 427 Waldo Ave | 0.43mi | 2/1.0 | 951 (+8%) | 1mo | $1,057,650 | $1,112 | 65 |
| 233 Ohio St | 0.63mi | 1/1.0 (-1) | 840 (-4%) | 1mo | $550,000 | $655 | 58 |
| 221 Ohio St | 0.63mi | 1/1.0 (-1) | 840 (-4%) | 16mo | $815,000 | $970 | 45 |
| 11 Grace Ter | 0.71mi | 2/1.0 | 972 (+11%) | 23mo | $1,150,000 | $1,183 | 29 |
Match score weights: distance 35% · size 25% · config 20% · recency 20%. Top-matched comps best support the ARV.
Projected returns pro-forma
4.79% appreciation · 1.64% rent growth · sell at horizon
- IRR
- 20.8%
- Equity multiple
- 2.29×
- Total profit
- $108,266
- Equity at exit
- $166,243
- IRR
- 20.0%
- Equity multiple
- 4.33×
- Total profit
- $280,138
- Equity at exit
- $283,849
Cash invested: $84,000 (down + closing). Projections, not guarantees.
Landlord ↔ Tenant lean methodology
- Overall (STATE)
- 18 Strongly Tenant-Friendly
- State California
- 18 Strongly Tenant-Friendly · D+13
- County
- — inherits STATE
- City
- — inherits STATE
ZIP-level market 91105
- Home prices YoY
- 1.3%
- Rents YoY
- 1.6%
- Active inventory
- 60
- Price-to-rent
- 7.8×
Monthly cashflow live
- Estimated rent
- $3,201 high interval (Pro) →
- Mortgage (P&I)
- −$1,573
- Tax from tax record
- −$91 /mo · $1,088/yr
- Insurance
- −$125
- HOA
- −$0
- Vacancy / Maint / Mgmt
- −$672
- Net cashflow
- $740
Break-even live
UW: 25.0% down · 7.5% · 30yr · 1.5% tax · 5.0% vac · 8.0% maint · 8.0% mgmt
Financing live
Cash to close
- Down payment
- $75,000
- Closing costs
- $9,000
- Reserves months
- —
- Total cash needed
- —
Loan-product check · same deal, 3 products live
Conventional
25% down · 7.5% · 30yr
- Down + closing
- —
- Monthly P&I
- —
- Monthly cashflow
- —
- DSCR
- —
- Eligible?
- —
Personal DTI + credit; lowest rate.
DSCR
20% down · 8.5% · 30yr
- Down + closing
- —
- Monthly P&I
- —
- Monthly cashflow
- —
- DSCR
- —
- Eligible?
- —
No personal income docs; deal must DSCR.
Hard money
10% down · 12.0% · 12mo
- Down + closing
- —
- Monthly P&I
- —
- Monthly cashflow
- —
- DSCR
- —
- Eligible?
- —
Short-term bridge; refi at stabilization.
Rent comps 40 comps
| Address | Beds | Baths | Sqft | Rent | $/sqft | DOM | Units | Dist |
|---|---|---|---|---|---|---|---|---|
| 295 W California Blvd Unit 12 Pasadena, CA | 2.0 | 1.0 | 1100 | $2,494 | $2.27 | 20d | 1 | 0.32mi |
| 180 Fillmore St Unit F192 Pasadena, CA | 2.0 | 1.0 | 800 | $2,595 | $3.24 | 6d | 1 | 0.35mi |
| 271 E Bellevue Dr Pasadena, CA | 1.0–2.0 | 1.0–2.0 | 874 | $4,050 | $4.63 | 1d | 6 | 0.38mi |
| 400 S Marengo Ave Unit 4 Pasadena, CA | 1.0 | 1.0 | 580 | $1,900 | $3.28 | 7d | 1 | 0.39mi |
| 226 Fillmore St Unit 240 Pasadena, CA | 1.0 | 1.0 | 650 | $2,095 | $3.22 | 43d | 1 | 0.40mi |
| 305 E California Blvd Pasadena, CA | 1.0–2.0 | 1.0 | 721 | $2,595 | $3.60 | 13d | 2 | 0.41mi |
| 300 E Bellevue Dr Pasadena, CA | 1.0–3.0 | 1.0–2.0 | 889 | $3,528 | $3.97 | 2d | 18 | 0.41mi |
| 788 S Marengo Ave Unit 790 Pasadena, CA | 1.0 | 1.0 | 600 | $2,000 | $3.33 | 12d | 1 | 0.41mi |
| 381 Waldo Ave Unit 3811 Pasadena, CA | 2.0 | 2.0 | 1050 | $2,795 | $2.66 | 2d | 1 | 0.43mi |
| 265 S Arroyo Pkwy Pasadena, CA | 2.0 | 1.0–2.0 | 1049 | $3,746 | $3.57 | 1d | 20 | 0.43mi |
| 231 S De Lacey Ave Pasadena, CA | 2.0 | 1.0–2.0 | 857 | $3,884 | $4.53 | 1d | 18 | 0.43mi |
| 350 E California Blvd Pasadena, CA | 1.0–2.0 | 2.0 | 1250 | $3,650 | $2.92 | 4d | 2 | 0.43mi |
| 275 S Marengo Ave Pasadena, CA | 1.0 | 1.0 | 685 | $2,400 | $3.50 | 43d | 1 | 0.44mi |
| 280 E Del Mar Blvd Pasadena, CA | 1.0–2.0 | 1.0–2.0 | 890 | $3,247 | $3.65 | 1d | 13 | 0.44mi |
| 238 S Arroyo Pkwy Pasadena, CA | 2.0 | 2.0 | 1042 | $3,650 | $3.50 | 43d | 1 | 0.45mi |
| 165 S De Lacey Ave Pasadena, CA | 3.0 | 1.0–2.0 | 1146 | $4,263 | $3.72 | 1d | 10 | 0.51mi |
| 904 S Marengo Ave Unit 904 Pasadena, CA | 1.0 | 1.0 | 1000 | $2,600 | $2.60 | 43d | 1 | 0.51mi |
| 910 S Marengo Ave Apt 1 Pasadena, CA | 1.0 | 1.0 | 525 | $1,750 | $3.33 | 16d | 1 | 0.51mi |
| 350 E Del Mar Blvd Pasadena, CA | 2.0 | 1.0 | 795 | $4,610 | $5.80 | 2d | 1 | 0.52mi |
| 249 Alpine St #48 Pasadena, CA | 1.0 | 1.0 | 742 | $3,000 | $4.04 | 13d | 1 | 0.53mi |
| 65 W Dayton St Pasadena, CA | 1.0–2.0 | 1.0–2.0 | 796 | $3,795 | $4.76 | 3d | 2 | 0.55mi |
| 975 S Marengo Ave Unit 995 Pasadena, CA | 1.0 | 1.0 | 800 | $2,195 | $2.74 | 2d | 1 | 0.56mi |
| 355 S Los Robles Ave #144 Pasadena, CA | 1.0 | 1.0 | 675 | $2,345 | $3.47 | 43d | 1 | 0.56mi |
| 275 Cordova St Pasadena, CA | 1.0 | 1.0 | 700 | $2,085 | $2.98 | 43d | 1 | 0.57mi |
| 77 W Glenarm St Pasadena, CA | 1.0 | 1.0 | 550 | $3,500 | $6.36 | 43d | 1 | 0.57mi |
| 22 W Green St Pasadena, CA | 2.0 | 2.0 | 901 | $3,550 | $3.94 | 10d | 1 | 0.57mi |
| 520 S Los Robles Ave Unit 4 Pasadena, CA | 1.0 | 1.0 | 700 | $3,795 | $5.42 | 24d | 1 | 0.58mi |
| 500 S Los Robles Ave Pasadena, CA | 2.0 | 2.0 | 1048 | $3,390 | $3.23 | 6d | 1 | 0.59mi |
| 263 Ohio St Unit 2 Pasadena, CA | 1.0 | 1.0 | 650 | $2,150 | $3.31 | 43d | 1 | 0.60mi |
| 293 Ohio St #2 Pasadena, CA | 2.0 | 3.0 | 1104 | $3,700 | $3.35 | 43d | 1 | 0.62mi |
| 325 Cordova St Pasadena, CA | 1.0–2.0 | 1.0–2.0 | 827 | $3,496 | $4.22 | 2d | 3 | 0.63mi |
| 399 E Del Mar Blvd #103 Pasadena, CA | 1.0 | 1.0 | 834 | $4,500 | $5.40 | 19d | 1 | 0.63mi |
| 360 S Los Robles Ave #6 Pasadena, CA | 2.0 | 2.0 | 1062 | $3,300 | $3.11 | 24d | 1 | 0.63mi |
| 178 S Euclid Ave #211 Pasadena, CA | 2.0 | 2.0 | 1011 | $4,500 | $4.45 | 5d | 1 | 0.67mi |
| 388 Cordova St #305 Pasadena, CA | 1.0 | 2.0 | 1008 | $4,200 | $4.17 | 43d | 1 | 0.68mi |
| 495 S Madison Ave Pasadena, CA | 1.0 | 1.0 | 600 | $2,095 | $3.49 | 43d | 2 | 0.69mi |
| 14 N Fair Oaks Ave Ste 300 Pasadena, CA | 1.0 | 1.0 | 662 | $2,400 | $3.63 | 43d | 1 | 0.69mi |
| 501 E Del Mar Blvd #113 Pasadena, CA | 2.0 | 2.0 | 1081 | $3,400 | $3.15 | 13d | 1 | 0.70mi |
| 529 S Madison Ave Pasadena, CA | 1.0 | 1.0 | 750 | $2,000 | $2.67 | 17d | 1 | 0.71mi |
| 255 S Oakland Ave Pasadena, CA | 1.0 | 1.0 | 750 | $2,195 | $2.93 | 43d | 1 | 0.73mi |
Listing history 2 events
-
2026-04-21status Pending
-
2026-03-25$300,000 Active
ⓘ Source: listings_history table (triggers on properties + properties_extension) + one-shot
backfill from property_details.listing_events for pre-trigger history.
Tax reassessment forecast CA · Resets to sale price
- Current annual tax
- $1,088 · $91/mo
- Projected year-2 tax
- $2,280 · $190/mo
- Expected delta
- +$1,192/yr (+$99/mo · 109.6%)
ⓘ Screening estimate from a state-policy table — verify with the county assessor before closing.
Climate risk First Street
- Flood 1/10 Low FEMA zone X (unshaded) · 0% chance over 30 yrs
- Wildfire 1/10 Low
- Heat 6/10 Major 7 d/yr ≥97°F today · 21 d/yr by 30 yrs out
- Wind 1/10 Low
- Air quality 6/10 Major 11 unhealthy d/yr today · 12 by 30 yrs out
Nearby sold comps map
Loading sold comps map…
Walkable amenities ~0.75 mi
Loading nearby amenities…
Taxation est. · year 1
- Rental income
- $38,407
- − Mortgage interest
- −$16,805
- − Property taxes
- −$1,088
- − Insurance
- −$1,500
- − Repairs & maintenance
- −$3,073
- − Management
- −$3,073
- − Depreciation
- −$8,727
- Taxable income
- $4,142
- Est. tax owed @ 24.0%
- −$994
- After-tax cash flow
- $7,881/yr
For passive investors: Depreciation is non-cash, so a rental often shows a tax loss while cash-flowing — sheltering income. Rental losses are passive: they offset passive income freely, and up to $25,000/yr can offset ordinary (W-2) income if you actively participate and your MAGI is under $100k (phasing out to $0 by $150k); unused losses carry forward. On sale, claimed depreciation is recaptured at up to 25%, and gains may owe capital-gains tax (a 1031 exchange can defer both). Figures are a year-1 estimate at your 24.0% rate — not tax advice; consult a CPA.
Schools (NCES district)
- District
- Pasadena Unified
- NCES district ID
- 0629940
- Math proficiency
- 42% ▲ 7.00%
- Reading proficiency
- 60% ▲ 15.00%
- Median HH income
- $73,762
- Composite
- 45.82/100
- National rank
- #2557
- State rank
- #123 of 517 in CA
Livability — Pasadena
- Score
- 72/100
- State rank
- #181
- US rank
- #5981
Category grades
Schools grade is shown separately in the Schools card above.
Census & demographics
- Census place
- Pasadena, CA
- County
- Los Angeles County · 9,444,647 people
- City population
- 151,001
- Metro
- Los Angeles-Long Beach-Anaheim, CA
- Population (ZIP)
- 12,531
- Household income
- $156,791
- Rent vs Own
- Severe rent burden
- 400.0
Population outlook (Los Angeles County) Hauer SSP2
- Today (2025)
- 10,940,515 people
- By 2030
- 11,256,481 · +2.9%
- By 2040
- 11,729,929 · +7.2%
- By 2050
- 11,948,407 · +9.2%
- By 2075
- 11,818,114 · +8.0%
- By 2100
- 10,842,928 · -0.9%
Race, ethnicity, and origin ACS 2023
- Neighborhood character
- Diverse neighborhood (Simpson 0.64)
- Race & ethnicity
- White 55% Asian 19% Hispanic / Latino 16% Two or more races 13% Black 3%
- Hispanic origin (detail)
- Mexican 8% Cuban 2%
- Common ancestry
- Lithuanian 3% Italian 2% Iranian 2%
- Foreign-born
- 22% · China, Canada, Vietnam
- Languages at home
- 71% English-only · Spanish 10% Chinese 10% Other Indo-European 3%
Political lean MEDSL · Los Angeles
- 2024 margin
- Solid D (+32.9) · D 64.8% · R 31.9% · Other 3.3%
- 2008→2024 swing
- -7.4pp toward R · 2008: 40.4pp · 2024: 32.9pp
- All cycles
- 2024: D+32.9 2020: D+44.2 2016: D+48.0 2012: D+40.0 2008: D+40.4
Not yet ingested
- Civics
- —
Market trends
- HPI YoY
- ▲ 4.79%
- Current HPI
- 386.1241
- Rent YoY
- ▲ 1.64%
- Metro
- Los Angeles-Long Beach-Anaheim, CA
- State GDP YoY
- ▲ 3.21%
- F500 in state
- 116
Industry mix (Fortune 500 HQ in CA)
| Industry | F500 HQs | Revenue |
|---|---|---|
| Technology | 27 | $1,492B |
|
||
| Financial Services | 3 | $174B |
|
||
| Retail | 3 | $44B |
|
||
| Insurance | 3 | $26B |
|
||
| Media / Entertainment | 2 | $115B |
|
||
| Pharmaceuticals / Biotech | 2 | $62B |
|
||
Price history
2 events — show timeline
- 2026-04-21 Pending — TheMLS
- 2026-03-25 Listed $300,000 TheMLS
Property tax history
+5.2%/yrLatest (2025): $1,088 · +14.0% YoY. Source: county tax records.
Cash-flow waterfall
monthlySold comps — $/sqft
last 12 mo · ≤1 miLoading sold comps…