2639 Westwinds Dr #5 · Iowa City, IA
Flood risk 1/10 · Minimal
- FEMA flood zone
- X (unshaded)
- Chance of flooding over 30 yrs
- 0.0%
- Est. flood insurance / yr
- $507 – $1,088
Fire risk 3/10 · Minor
- Est. fire insurance / yr
- $902 – $1,676
Heat risk 3/10 · Minor
- Hot days now (above 106°F)
- 7 days/yr
- Hot days in 30 yrs
- 16 days/yr
Wind risk 2/10 · Minimal
- Chance of severe wind over 30 yrs
- —
Air-quality risk 2/10 · Minimal
- Unhealthy air days now
- 1 days/yr
- Unhealthy air days in 30 yrs
- 2 days/yr
Risk factors via First Street. Map © Google.
Why this score? — see what drove the D- grade
The composite is a weighted blend of 9 inputs, each scored 0–100. Each bar is that input's sub-score; the figure is the points it added to the 100-point composite (weight × sub-score).
- Cash flow +8.5/30.0
- ARV discount +7.5/15.0
- Schools +5.7/10.0
- 1% rule +5.1/10.0
- Livability +4.3/5.0
- Rent growth +3.7/5.0
- Condition / age +2.5/5.0
- DSCR +2.3/10.0
- Appreciation +0.0/10.0
$99,000
🖨 Deal sheet 📄 Offer letter ✓ Due diligence
Listing remarks MLS
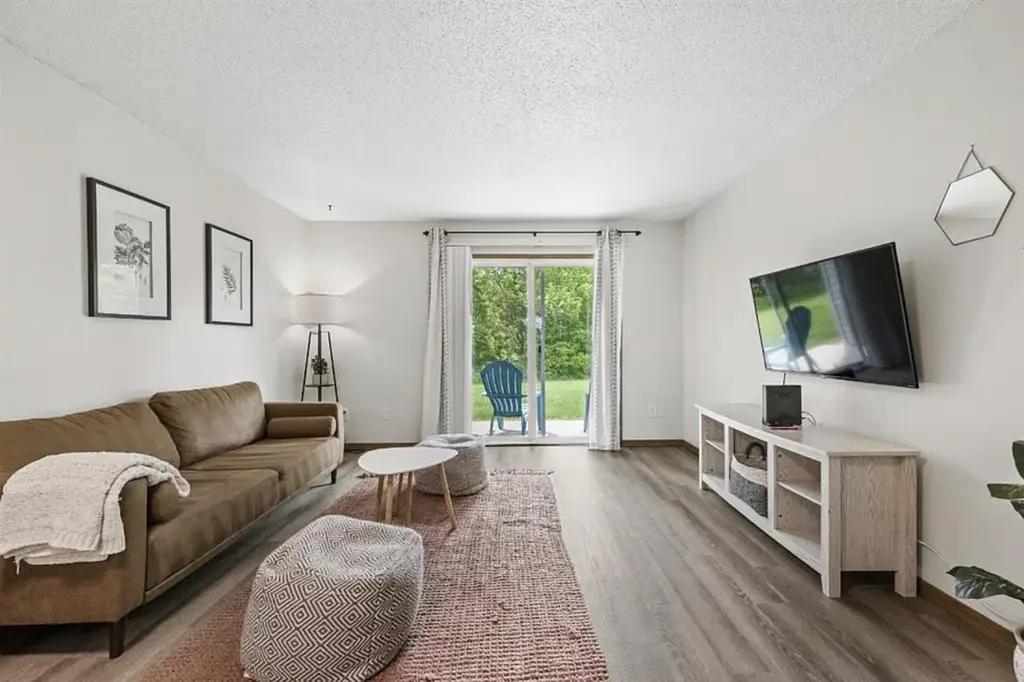
1 Bedroom, 1 Bathroom condo located in Iowa City. This west side, ground floor condo features a walk out patio that faces a small pond and walking trail. New LVP flooring and carpet in March 2023. Freshly painted. This unit is conveniently located near the U of I Hospitals and Clinics, Dental & Law schools, Kinnick Stadium, and shopping. On bus line with easy access to Hwy 218 and I380/I80.
Key facts
- Ground floor unit
- $200 HOA
- Parking
Tags
Property features AI
Finance
- Other: Directions: Melrose Avenue or Mormon Trek Boulevard to Westwinds Drive
- Financial info: Annual tax amount not included per instructions
- HOA & community: Homeowners association with an annual fee of $2,400 (equates to $200/month); Subdivision: Aspen Lake
Exterior
- Parking: 1 parking space total; Guest parking and on-street parking available
- Security: Carbon monoxide detector(s); Smoke detector(s)
- Utilities: Public water; Public sewer; Cable available
- Home design: Condominium (residential); Entry level and number of stories not specified; Facing direction not specified
- Construction: Frame construction; Year built not specified; Roof and foundation details not specified
- Exterior features: Patio; Sidewalks and street lights in the community
Interior
- Kitchen: Dishwasher; Microwave; Refrigerator
- Bedrooms: Details not provided
- Flooring: Carpet
- Bathrooms: 1 full bathroom
- Heating & cooling: Central air; Ceiling fan(s)
- Interior features: Ceiling fan(s); Central air; Dishwasher; Microwave; Refrigerator; Carpet flooring; No fireplace; Carbon monoxide and smoke detectors
- Laundry & utility: Washer and dryer; Laundry in hall with laundry closet
Neighborhood map
What this means for you Summary
Snapshot
- This is a 1-bed/1.0-bath condo listed at $99k.
Deal economics
- At list price, monthly cash flow is $-87 ($-1k/yr) — negative.
- To cash-flow at today's rent, offer at most $84k (15.6% below list).
- Meets the 1% rule at list price ($1k rent vs $99k).
- Recommended offer: $84k (15.6% below list) — sets the bar for cash-flow.
- Cap rate 5.2% vs local median 2.7% in Iowa City — top-decile yield for the area; either an underpriced asset or a hidden risk that comps aren't pricing in. Stress-test before assuming the spread holds.
Location & tenants
- Location reads 86/100 on livability (#13 in IA, #450 nationally) — a professional / high-income tenant draw. Strengths: amenities A+, commute A+, cost of living A+.
- Iowa City Community School District (urban): math 65% / reading 70% proficiency, ranked #174 of 289 in IA (top 60%) — acceptable for families but not a draw, mixed tenant base, ~2y average lease.
- Zoned schools: Norman Borlaug Elementary School (math 68% / reading 66%, grade B+, #273 of 616 statewide, top 51%, 417 students, 39% FRL); Northwest Junior High School (math 64% / reading 71%, grade A-, #133 of 246 statewide, top 56%, 730 students, 43% FRL); West Senior High School (math 71% / reading 77%, grade B+, #103 of 336 statewide, top 32%, 1,503 students, 38% FRL).
- Market conditions: Rents rising fast (+4.9%/yr); 207 active listings in the ZIP; 5 comparable units currently listed for rent nearby; rentals at typical pace (median 21d on market — plan ~3-4 weeks tenant-placement turnaround); 714 units permitted in Johnson County in 2024 (158 in 5+ unit buildings).
Forward outlook
- Local home prices are declining (-3.0%/yr); year-one equity from $684 of loan paydown is wiped out by about $3k of value loss. Plan a longer hold.
- Johnson County population projected at +60% by 2050 — long-run rental-demand tailwind backs the buy-and-hold thesis.
Negotiation context
- Only 9 days on market — expect competitive offers; lowballing is unlikely to land.
- 2 sale attempts since 3y ago with the ask held roughly flat each time — persistent listings suggest the price (not the market) is what's stuck; bring a comps-based counter.
- Current owner paid $83k; 19% above their basis — modest negotiation headroom, anchor on the comps not their cost.
Questions for the listing agent
- What do current leases actually rent for vs. the listed asking? Can we see a recent rent roll and the last 12 months of T-12 income?
- What does the HOA fee cover, when was the last increase, and are there any pending special assessments or reserve-fund shortfalls?
- Any open or pending special assessments — roof, HVAC, plumbing, elevator, façade? What's the per-unit balance and payoff schedule, and is the seller paying it off at close or rolling it to the buyer?
- Is there a deadline driving the sale (1031 exchange, divorce, estate, relocation)? That informs how much negotiation room exists.
- Schools are A-rated — typically a magnet for longer-tenancy family renters. What's the average tenant stay here, and is there a school-zone premium baked into asking?
- The area grade is low — what's the realistic commute time and amenity access for the typical tenant pool here? Any planned neighborhood developments (good or bad) we should know about?
- What's the average days-on-market for RENTAL listings here right now (not sales)? A rising rental-DOM trend means longer vacancies and softer asking-rent achievability than the comps imply.
- What's the recent tenant-quality profile in this submarket — average credit score on applications, eviction rate, late-payment / NSF rate, and stable-employment percentage? A property-management company in the area should have these aggregated.
- How much new apartment / multifamily construction is in the pipeline within 1–3 miles? Heavy new supply (>2% of stock underway) typically softens rents 12–24 months out; light construction supports rent growth.
Investment metrics
- 1% rule
- 1.01% ✓
- Cap rate
- 5.23%
- Cash-on-cash
- -3.78%
- DSCR
- 0.83
- GRM
- 8.2
CMA / ARV
No comps found within radius.
Projected returns pro-forma
-3.0% appreciation · 4.94% rent growth · sell at horizon
- IRR
- -19.7%
- Equity multiple
- 0.30×
- Total profit
- $-19,480
- Equity at exit
- $14,761
- IRR
- -7.8%
- Equity multiple
- 0.46×
- Total profit
- $-15,075
- Equity at exit
- $8,560
Cash invested: $27,720 (down + closing). Projections, not guarantees.
Landlord ↔ Tenant lean methodology
- Overall (STATE)
- 83 Strongly Landlord-Friendly
- State Iowa
- 83 Strongly Landlord-Friendly · R+6
- County
- — inherits STATE
- City
- — inherits STATE
ZIP-level market 52246
- Rents YoY
- 4.9%
- Active inventory
- 207
- Price-to-rent
- 8.2×
Monthly cashflow live
- Estimated rent
- $1,002 high interval (Pro) →
- Mortgage (P&I)
- −$519
- Tax from tax record
- −$118 /mo · $1,418/yr
- Insurance
- −$41
- HOA
- −$200
- Vacancy / Maint / Mgmt
- −$210
- Net cashflow
- $-87
Break-even live
UW: 25.0% down · 7.5% · 30yr · 1.5% tax · 5.0% vac · 8.0% maint · 8.0% mgmt
Financing live
Cash to close
- Down payment
- $24,750
- Closing costs
- $2,970
- Reserves months
- —
- Total cash needed
- —
Loan-product check · same deal, 3 products live
Conventional
25% down · 7.5% · 30yr
- Down + closing
- —
- Monthly P&I
- —
- Monthly cashflow
- —
- DSCR
- —
- Eligible?
- —
Personal DTI + credit; lowest rate.
DSCR
20% down · 8.5% · 30yr
- Down + closing
- —
- Monthly P&I
- —
- Monthly cashflow
- —
- DSCR
- —
- Eligible?
- —
No personal income docs; deal must DSCR.
Hard money
10% down · 12.0% · 12mo
- Down + closing
- —
- Monthly P&I
- —
- Monthly cashflow
- —
- DSCR
- —
- Eligible?
- —
Short-term bridge; refi at stabilization.
Rent comps 5 comps
| Address | Beds | Baths | Sqft | Rent | $/sqft | DOM | Units | Dist |
|---|---|---|---|---|---|---|---|---|
| 2639 Westwinds Dr #1 Iowa City, IA | 1.0 | 1.0 | 532 | $900 | $1.69 | 43d | 1 | 0.02mi |
| 302 Finkbine Ln Iowa City, IA | 1.0–2.0 | 1.0 | 765 | $935 | $1.22 | 13d | 3 | 0.52mi |
| 300 Grandview Ct #313 Iowa City, IA | 2.0 | 1.0 | 628 | $1,300 | $2.07 | 21d | 1 | 1.08mi |
| 100 Grandview Ct #104 Iowa City, IA | 1.0 | 1.0 | 611 | $1,200 | $1.96 | 21d | 1 | 1.13mi |
| 700 Carriage Hl Iowa City, IA | 2.0 | 1.0 | 750 | $1,150 | $1.53 | 13d | 1 | 1.48mi |
HOA detail condo
- Monthly dues
- $200 · $2,400/yr
- Assessments
- None detected in remarks — confirm with the listing agent.
Listing history 9 events
-
2026-06-19days on market $99,000 Active 9 DOM
-
2026-06-18days on market $99,000 Active 8 DOM
-
2026-06-17days on market $99,000 Active 7 DOM
-
2026-06-16days on market $99,000 Active 6 DOM
-
2026-06-15remarks 699-char remark
-
2026-06-15days on market $99,000 Active 5 DOM
-
2026-06-14days on market $99,000 Active 3 DOM
-
2026-06-13remarks 698-char remark
-
2026-06-13$99,000 Active 2 DOM
ⓘ Source: listings_history table (triggers on properties + properties_extension) + one-shot
backfill from property_details.listing_events for pre-trigger history.
Tax reassessment forecast IA · Partial reset (capped growth)
- Current annual tax
- $1,418 · $118/mo
- Projected year-2 tax
- $1,486 · $124/mo
- Expected delta
- +$68/yr (+$6/mo · 4.8%)
ⓘ Screening estimate from a state-policy table — verify with the county assessor before closing.
Climate risk First Street
- Flood 1/10 Low FEMA zone X (unshaded) · 0% chance over 30 yrs
- Wildfire 3/10 Moderate
- Heat 3/10 Moderate 7 d/yr ≥106°F today · 16 d/yr by 30 yrs out
- Wind 2/10 Low
- Air quality 2/10 Low 1 unhealthy d/yr today · 2 by 30 yrs out
Nearby sold comps map
Loading sold comps map…
Walkable amenities ~0.75 mi
Loading nearby amenities…
Taxation est. · year 1
- Rental income
- $12,018
- − Mortgage interest
- −$5,546
- − Property taxes
- −$1,418
- − Insurance
- −$495
- − Repairs & maintenance
- −$961
- − Management
- −$961
- − HOA
- −$2,400
- − Depreciation
- −$2,880
- Taxable loss
- −$2,643
- Est. tax savings @ 24.0%
- +$634
- After-tax cash flow
- $-414/yr
For passive investors: Depreciation is non-cash, so a rental often shows a tax loss while cash-flowing — sheltering income. Rental losses are passive: they offset passive income freely, and up to $25,000/yr can offset ordinary (W-2) income if you actively participate and your MAGI is under $100k (phasing out to $0 by $150k); unused losses carry forward. On sale, claimed depreciation is recaptured at up to 25%, and gains may owe capital-gains tax (a 1031 exchange can defer both). Figures are a year-1 estimate at your 24.0% rate — not tax advice; consult a CPA.
Schools (NCES district)
- District
- Iowa City Community School District
- NCES district ID
- 1914700
- Math proficiency
- 65% ▼ -6.00%
- Reading proficiency
- 70% ▲ 2.00%
- Median HH income
- $50,229
- Composite
- 57.3/100
- National rank
- #1088
- State rank
- #174 of 289 in IA
Livability — Iowa City
- Score
- 86/100
- State rank
- #13
- US rank
- #450
Category grades
Schools grade is shown separately in the Schools card above.
Census & demographics
- Census place
- Iowa City, IA
- County
- Johnson County · 132,710 people
- City population
- 80,235
- Metro
- Iowa City, IA
- Population (ZIP)
- 22,308
- Household income
- $62,521
- Rent vs Own
- Severe rent burden
- 1680.0
Population outlook (Johnson County) Hauer SSP2
- Today (2025)
- 180,405 people
- By 2030
- 200,014 · +10.9%
- By 2040
- 241,428 · +33.8%
- By 2050
- 288,144 · +59.7%
- By 2075
- 420,009 · +132.8%
- By 2100
- 546,596 · +203.0%
Race, ethnicity, and origin ACS 2023
- Neighborhood character
- Predominantly White (65%)
- Race & ethnicity
- White 65% Black 12% Asian 11% Hispanic / Latino 8% Two or more races 8%
- Hispanic origin (detail)
- Mexican 5%
- Common ancestry
- Portuguese 4% Swedish 3% Slovak 2%
- Foreign-born
- 17% · China, Canada, South Korea
- Languages at home
- 73% English-only · Spanish 6% Arabic 5% Chinese 4%
Political lean MEDSL · Johnson
- 2024 margin
- Solid D (+38.1) · D 68.4% · R 30.3% · Other 1.3%
- 2008→2024 swing
- -3.4pp toward R · 2008: 41.5pp · 2024: 38.1pp
- All cycles
- 2024: D+38.1 2020: D+43.2 2016: D+38.3 2012: D+35.4 2008: D+41.5
Not yet ingested
- Civics
- —
Market trends
- HPI YoY
- ▼ -151.08%
- Current HPI
- 159.5713
- Rent YoY
- ▲ 4.94%
- Metro
- Iowa City, IA
- State GDP YoY
- ▲ 2.48%
- F500 in state
- 4
Industry mix (Fortune 500 HQ in IA)
| Industry | F500 HQs | Revenue |
|---|---|---|
| Financial Services | 1 | $16B |
|
||
| Retail / Convenience | 1 | $15B |
|
||
Price history
-71.7% since first listed10 events — show timeline
- 2026-06-10 Listed $99,000 ICAARMLS
- 2024-04-05 Price Changed $83,000 ICAARMLS
- 2023-04-19 Sold (Public Records) $83,000 Public Records
- 2023-04-14 Sold (MLS) $83,000 ICAARMLS
- 2023-04-10 Pending — ICAARMLS
- 2023-04-10 Price Changed $84,900 ICAARMLS
- 2023-03-22 Contingent — ICAARMLS
- 2023-03-21 Listed $84,900 ICAARMLS
- 2022-02-07 Price Changed $740 RENT.
- 2021-01-15 Sold (Public Records) $350,000 Public Records
Property tax history
+1.7%/yrLatest (2025): $1,418 · +1.3% YoY. Source: county tax records.
Cash-flow waterfall
monthlySold comps — $/sqft
last 12 mo · ≤1 miLoading sold comps…