1124 Morfontaine St · Daytona Beach, FL
Flood risk No data
- FEMA flood zone
- —
- Chance of flooding over 30 yrs
- —
- Est. flood insurance / yr
- —
Fire risk No data
- Est. fire insurance / yr
- —
Heat risk No data
- Hot days now (above threshold)
- —
- Hot days in 30 yrs
- —
Wind risk No data
- Chance of severe wind over 30 yrs
- —
Air-quality risk No data
- Unhealthy air days now
- —
- Unhealthy air days in 30 yrs
- —
Risk factors via First Street. Map © Google.
Why this score? — see what drove the D- grade
The composite is a weighted blend of 9 inputs, each scored 0–100. Each bar is that input's sub-score; the figure is the points it added to the 100-point composite (weight × sub-score).
- Cash flow +8.5/30.0
- ARV discount +7.5/15.0
- Livability +4.2/5.0
- Appreciation +4.0/10.0
- Rent growth +3.9/5.0
- Schools +3.9/10.0
- 1% rule +3.1/10.0
- Condition / age +2.5/5.0
- DSCR +2.3/10.0
$444,990
🖨 Deal sheet (PDF) 📄 Offer letter ✓ Due diligence
Listing remarks
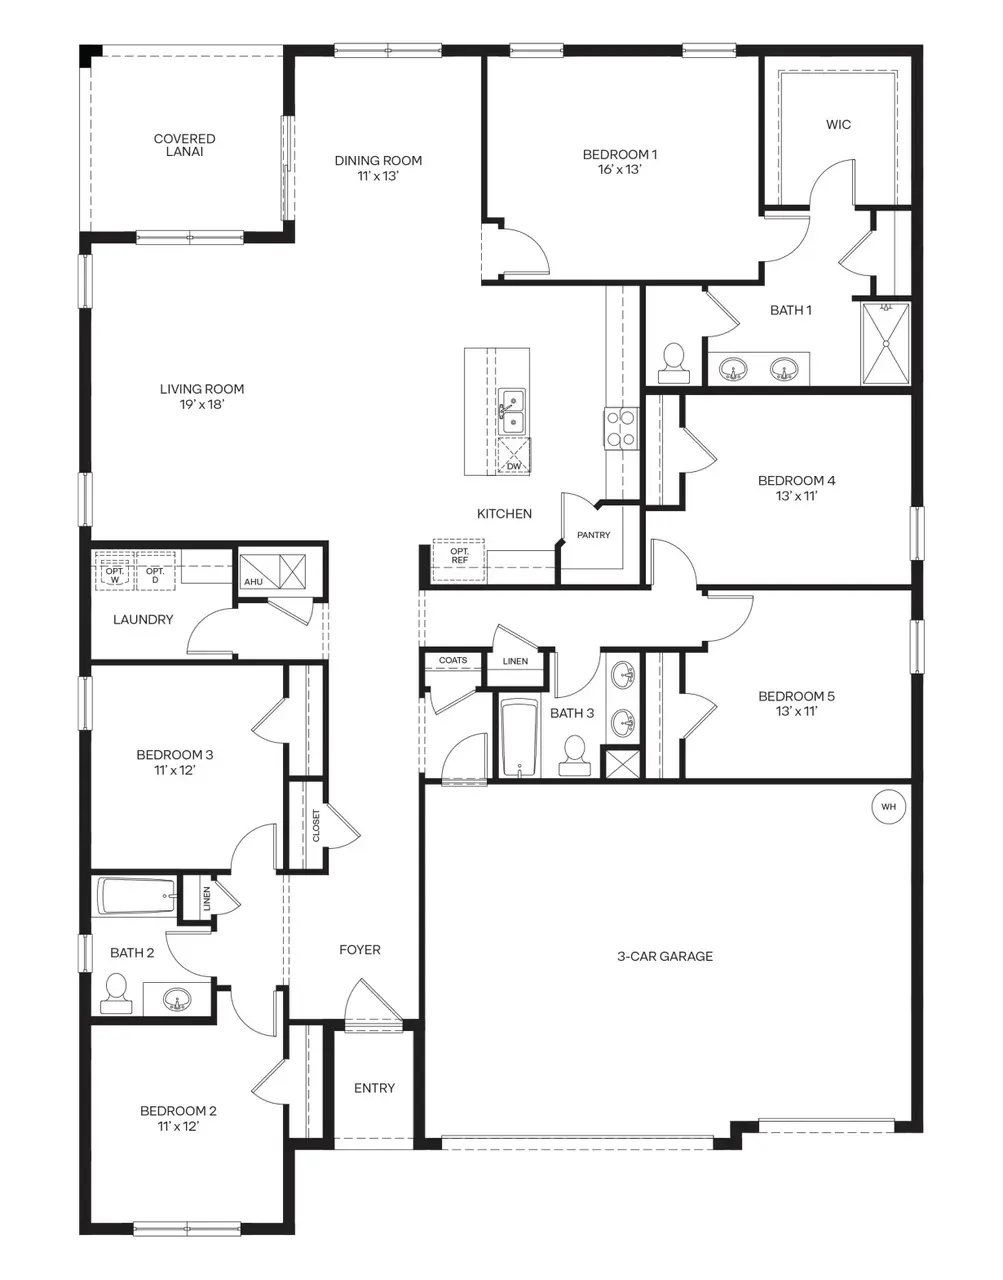
Under Construction. Welcome to the Covington, an exquisite single-story floor plan designed with your modern lifestyle in mind. This spacious home offers 5 bedrooms, 3 bathrooms, and a 3-car garage, ensuring ample space for comfortable living and entertaining. * Photos are of similar model but not that of exact house. Pictures, photographs, colors, features, and sizes are for illustration purposes only and will vary from the homes as built. Home and community information including pricing, included features, terms, availability and amenities are subject to change and prior sale at any time without notice or obligation. Please note that no representations or warranties are made regarding sch
Key facts
- 7,511 sq ft lot
- 3 garage spots
- Community pool
Property features AI
Finance
- Financial info: List price $451,990
Exterior
- Parking: 3-car garage / 3 total parking spaces
- Home design: Spec inventory, Covington plan
- Exterior features: Property located at 1124 Morfontaine St, Daytona Beach, FL 32124
Interior
- Bedrooms: 5 bedrooms
- Bathrooms: 3 full bathrooms
- Interior features: Open living area (2,490 living area)
Neighborhood map
What this means for you Summary
Snapshot
- This is a 5-bed/3.0-bath single-family listed at $445k.
Deal economics
- At list price, monthly cash flow is $-389 ($-5k/yr) — negative.
- To cash-flow at today's rent, offer at most $389k (12.7% below list).
- To meet the 1% rule (rent ≥ 1% of price), the offer needs to be $360k (19.1% below list).
- Recommended offer: $360k (19.1% below list) — sets the bar for 1% rule.
Location & tenants
- Location reads 83/100 on livability (#46 in FL, #867 nationally) — a professional / high-income tenant draw. Strengths: amenities A+, commute A+, cost of living A+; Watch: employment D-.
- Volusia (suburban): math 44% / reading 49% proficiency, ranked #47 of 73 in FL (top 64%) — families likely to look elsewhere, expect single-tenant / working-renter base with shorter leases.
- Zoned schools: Champion Elementary School (math 39% / reading 44%, grade F, #1,437 of 2,144 statewide, top 68%, 584 students, 70% FRL); David C. Hinson Sr. Middle School (math 52% / reading 49%, grade C, #246 of 571 statewide, top 44%, 950 students, 52% FRL); Mainland High School (math 30% / reading 37%, grade F, #400 of 667 statewide, top 61%, 1,855 students, 64% FRL).
- Market conditions: Rents rising fast (+5.5%/yr); 335 active listings in the ZIP; 9 comparable units currently listed for rent nearby; rentals at typical pace (median 26d on market — plan ~3-4 weeks tenant-placement turnaround); solid renter incomes; 3,402 units permitted in Volusia County in 2024 (681 in 5+ unit buildings).
- At $3,599/mo this rent would consume 47% of the median local household income ($93k/yr) (locally 54% of renters already pay >50% of income on rent) — very limited rent-growth headroom before tenants either downsize or default.
Forward outlook
- Local home prices are declining (-2.0%/yr); year-one equity from $3k of loan paydown is wiped out by about $9k of value loss. Plan a longer hold.
- Volusia County population projected at +19% by 2050 — long-run rental-demand tailwind backs the buy-and-hold thesis.
Negotiation context
- Only 11 days on market — expect competitive offers; lowballing is unlikely to land.
Questions for the listing agent
- What do current leases actually rent for vs. the listed asking? Can we see a recent rent roll and the last 12 months of T-12 income?
- What does the HOA fee cover, when was the last increase, and are there any pending special assessments or reserve-fund shortfalls?
- Is there a deadline driving the sale (1031 exchange, divorce, estate, relocation)? That informs how much negotiation room exists.
- Schools are D-rated, which usually means shorter tenancies and higher turnover. Who's the typical renter profile here, and what's been the actual vacancy rate?
- The area grade is low — what's the realistic commute time and amenity access for the typical tenant pool here? Any planned neighborhood developments (good or bad) we should know about?
- What's the average days-on-market for RENTAL listings here right now (not sales)? A rising rental-DOM trend means longer vacancies and softer asking-rent achievability than the comps imply.
- What's the recent tenant-quality profile in this submarket — average credit score on applications, eviction rate, late-payment / NSF rate, and stable-employment percentage? A property-management company in the area should have these aggregated.
- How much new for-sale + rental construction is in the pipeline within 1–3 miles? Heavy new supply typically softens prices + rents 12–24 months out; constrained supply supports both.
Investment metrics
- 1% rule
- 0.81% ✗
- Cap rate
- 5.24%
- Cash-on-cash
- -3.75%
- DSCR
- 0.83
- GRM
- 10.3
CMA / ARV
No comps found within radius.
Projected returns pro-forma
-1.99% appreciation · 5.46% rent growth · sell at horizon
- IRR
- -13.7%
- Equity multiple
- 0.45×
- Total profit
- $-68,532
- Equity at exit
- $86,646
- IRR
- -3.2%
- Equity multiple
- 0.72×
- Total profit
- $-34,561
- Equity at exit
- $74,259
Cash invested: $124,597 (down + closing). Projections, not guarantees.
Landlord ↔ Tenant lean methodology
- Overall (STATE)
- 87 Strongly Landlord-Friendly
- State Florida
- 87 Strongly Landlord-Friendly · R+3
- County
- — inherits STATE
- City
- — inherits STATE
ZIP-level market 32124
- Home prices YoY
- -0.6%
- Rents YoY
- 5.5%
- Active inventory
- 335
- Price-to-rent
- 10.3×
Monthly cashflow live
- Estimated rent
- $3,599 high interval (Pro) →
- Mortgage (P&I)
- −$2,334
- Tax est. 1.5%
- −$556 /mo · $6,675/yr
- Insurance
- −$185
- HOA
- −$157
- Vacancy / Maint / Mgmt
- −$756
- Net cashflow
- $-389
Break-even live
Sensitivity live
| Price | -10% $-82 | -5% $-235 | +0% $-389 | +5% $-543 | +10% $-697 |
|---|---|---|---|---|---|
| Rent | -10% $-673 | -5% $-531 | +0% $-389 | +5% $-247 | +10% $-105 |
| Rate | -1.0pp $-165 | -0.5pp $-276 | base $-389 | +0.5pp $-504 | +1.0pp $-622 |
UW: 25.0% down · 7.5% · 30yr · 1.5% tax · 5.0% vac · 8.0% maint · 8.0% mgmt
Financing live
Cash to close
- Down payment
- $111,248
- Closing costs
- $13,350
- Reserves months
- —
- Total cash needed
- —
Loan-product check · same deal, 3 products live
Conventional
25% down · 7.5% · 30yr
- Down + closing
- —
- Monthly P&I
- —
- Monthly cashflow
- —
- DSCR
- —
- Eligible?
- —
Personal DTI + credit; lowest rate.
DSCR
20% down · 8.5% · 30yr
- Down + closing
- —
- Monthly P&I
- —
- Monthly cashflow
- —
- DSCR
- —
- Eligible?
- —
No personal income docs; deal must DSCR.
Hard money
10% down · 12.0% · 12mo
- Down + closing
- —
- Monthly P&I
- —
- Monthly cashflow
- —
- DSCR
- —
- Eligible?
- —
Short-term bridge; refi at stabilization.
Rent comps 9 comps
| Address | Beds | Baths | Sqft | Rent | $/sqft | DOM | Units | Dist |
|---|---|---|---|---|---|---|---|---|
| 137 Lost Ball Dr Daytona Beach, FL | 4.0 | 2.5 | 2168 | $2,950 | $1.36 | 13d | 1 | 0.75mi |
| 284 Links Terrace Blvd Daytona Beach, FL | 4.0 | 2.5 | 2200 | $2,850 | $1.30 | 25d | 1 | 0.88mi |
| 129 Formby Grande Ave Daytona Beach, FL | 5.0 | 4.0 | 3317 | $3,600 | $1.09 | 25d | 1 | 0.90mi |
| 1203 Cabot Cliffs Dr Daytona Beach, FL | 5.0 | 2.5 | 2355 | $2,750 | $1.17 | 23d | 1 | 1.32mi |
| 1187 Cabot Cliffs Dr Daytona Beach, FL | 6.0 | 3.0 | 2600 | $3,700 | $1.42 | 13d | 1 | 1.34mi |
| 1143 Cabot Cliffs Dr Daytona Beach, FL | 5.0 | 2.5 | 2370 | $3,050 | $1.29 | 13d | 1 | 1.38mi |
| 1142 Pacific Dunes Ct Daytona Beach, FL | 4.0 | 3.0 | 2010 | $2,599 | $1.29 | 25d | 1 | 1.48mi |
| 1231 Belle Isle Ln Daytona Beach, FL | 5.0 | 2.5 | 2112 | $2,650 | $1.25 | 25d | 1 | 1.49mi |
| 1100 Sand Trap Ct Daytona Beach, FL | 4.0 | 2.0 | 1935 | $2,600 | $1.34 | 25d | 1 | 1.49mi |
HOA detail
- Monthly dues
- $157 · $1,884/yr
Listing history 17 events
-
2026-06-22days on market $444,990 Active 11 DOM
-
2026-06-18days on market $444,990 Active 8 DOM
-
2026-06-17days on market $444,990 Active 7 DOM
-
2026-06-16days on market $444,990 Active 6 DOM
-
2026-06-15days on market $444,990 Active 5 DOM
-
2026-06-14remarks 699-char remark
-
2026-06-14pricedays on market $444,990 Active 3 DOM
-
2026-06-10days on market $451,990 Active 13 DOM
-
2026-06-09days on market $451,990 Active 12 DOM
-
2026-06-08days on market $451,990 Active 11 DOM
-
2026-06-07days on market $451,990 Active 10 DOM
-
2026-06-05days on market $451,990 Active 7 DOM
-
2026-06-03days on market $451,990 Active 6 DOM
-
2026-06-03days on market $451,990 Active 5 DOM
-
2026-06-01days on market $451,990 Active 4 DOM
-
2026-05-31days on market $451,990 Active 3 DOM
-
2026-05-31days on market $451,990 Active 2 DOM
ⓘ Source: listings_history table (triggers on properties + properties_extension) + one-shot
backfill from property_details.listing_events for pre-trigger history.
Nearby sold comps map
Loading sold comps map…
Walkable amenities ~0.75 mi
Loading nearby amenities…
Taxation est. · year 1
- Rental income
- $43,187
- − Mortgage interest
- −$24,926
- − Property taxes
- −$6,675
- − Insurance
- −$2,225
- − Repairs & maintenance
- −$3,455
- − Management
- −$3,455
- − HOA
- −$1,884
- − Depreciation
- −$12,945
- Taxable loss
- −$12,378
- Est. tax savings @ 24.0%
- +$2,971
- After-tax cash flow
- $-1,698/yr
For passive investors: Depreciation is non-cash, so a rental often shows a tax loss while cash-flowing — sheltering income. Rental losses are passive: they offset passive income freely, and up to $25,000/yr can offset ordinary (W-2) income if you actively participate and your MAGI is under $100k (phasing out to $0 by $150k); unused losses carry forward. On sale, claimed depreciation is recaptured at up to 25%, and gains may owe capital-gains tax (a 1031 exchange can defer both). Figures are a year-1 estimate at your 24.0% rate — not tax advice; consult a CPA.
Schools (NCES district)
- District
- Volusia
- NCES district ID
- 1201920
- Math proficiency
- 44% ▼ -9.00%
- Reading proficiency
- 49% ▼ -3.00%
- Median HH income
- $42,946
- Composite
- 39.2/100
- National rank
- #4019
- State rank
- #47 of 73 in FL
Livability — Daytona Beach
- Score
- 83/100
- State rank
- #46
- US rank
- #867
Category grades
Schools grade is shown separately in the Schools card above.
Census & demographics
- Census place
- Daytona Beach, FL
- County
- Volusia County · 556,871 people
- City population
- 67,539
- Metro
- Deltona-Daytona Beach-Ormond Beach, FL
- Population (ZIP)
- 11,409
- Household income
- $92,616
- Rent vs Own
- Severe rent burden
- 54.0
Population outlook (Volusia County) Hauer SSP2
- Today (2025)
- 572,749 people
- By 2030
- 598,695 · +4.5%
- By 2040
- 644,880 · +12.6%
- By 2050
- 681,451 · +19.0%
- By 2075
- 759,957 · +32.7%
- By 2100
- 778,902 · +36.0%
Race, ethnicity, and origin ACS 2023
- Neighborhood character
- Predominantly White (71%)
- Race & ethnicity
- White 71% Black 20% Hispanic / Latino 5% Asian 2% Two or more races 1%
- Common ancestry
- Romanian 3% Italian 2% Portuguese 1%
- Foreign-born
- 10% · Canada, Mexico, South Korea
- Languages at home
- 91% English-only · Spanish 4% Other Asian/Pacific 1% Other Indo-European 1%
Political lean MEDSL · Volusia
- 2024 margin
- Strong R (+21.8) · D 38.7% · R 60.5%
- 2008→2024 swing
- -27.4pp toward R · 2008: 5.7pp · 2024: -21.8pp
- All cycles
- 2024: R+21.8 2020: R+14.1 2016: R+13.1 2012: R+1.2 2008: D+5.7
Not yet ingested
- Civics
- —
Market trends
- HPI YoY
- ▼ -1.99%
- Current HPI
- 311.7456
- Rent YoY
- ▲ 5.46%
- Metro
- Deltona-Daytona Beach-Ormond Beach, FL
- State GDP YoY
- ▲ 3.28%
- F500 in state
- 36
Industry mix (Fortune 500 HQ in FL)
| Industry | F500 HQs | Revenue |
|---|---|---|
| Industrial Technology | 2 | $29B |
|
||
| Insurance | 2 | $17B |
|
||
| Retail | 1 | $60B |
|
||
| Technology Distribution | 1 | $58B |
|
||
| Homebuilding | 1 | $35B |
|
||
| Technology Manufacturing | 1 | $35B |
|
||
Cash-flow waterfall
monthlySold comps — $/sqft
last 12 mo · ≤1 miLoading sold comps…