 🌊 Lakefront
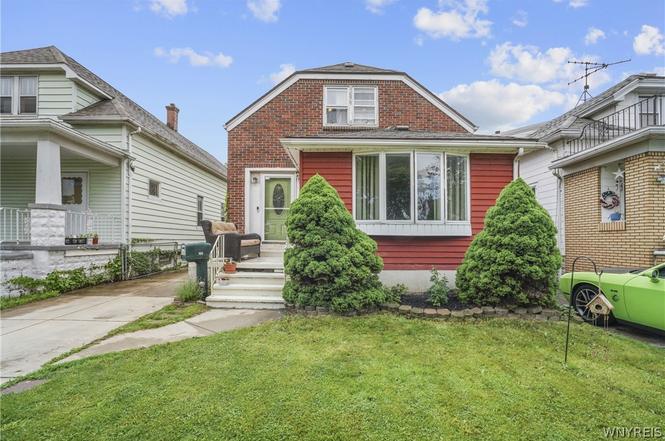
106 Pierce St · Buffalo, NY
Flood risk 4/10 · Minor
- FEMA flood zone
- X (unshaded)
- Chance of flooding over 30 yrs
- 0.22%
- Est. flood insurance / yr
- $473 – $860
Fire risk 1/10 · Minimal
- Est. fire insurance / yr
- $691 – $1,283
Heat risk 3/10 · Minor
- Hot days now (above 92°F)
- 7 days/yr
- Hot days in 30 yrs
- 15 days/yr
Wind risk 1/10 · Minimal
- Chance of severe wind over 30 yrs
- —
Air-quality risk 3/10 · Minor
- Unhealthy air days now
- 2 days/yr
- Unhealthy air days in 30 yrs
- 3 days/yr
Risk factors via First Street. Map © Google.
Why this score? — see what drove the C- grade
The composite is a weighted blend of 9 inputs, each scored 0–100. Each bar is that input's sub-score; the figure is the points it added to the 100-point composite (weight × sub-score).
- ARV discount +15.0/15.0
- Cash flow +9.8/30.0
- Appreciation +9.0/10.0
- Livability +3.9/5.0
- Schools +3.3/10.0
- DSCR +2.8/10.0
- Rent growth +2.5/5.0
- Condition / age +2.5/5.0
- 1% rule +1.7/10.0
$199,900
🖨 Deal sheet (PDF) 📄 Offer letter ✓ Due diligence
Listing remarks MLS
Terrific 4-bedroom home with large living room and kitchen on quiet street near shopping, restaurants, and entertainment. 2-Full Bath, Fenced Yard with Detached Garage, Vinyl Windows and New Roof in 2017. A lot of home at a great price close to everything less than 10min to Canalside and the Lakefront Downtown with Affordable Taxes. Furnace and A/C 10yrs old. H-W tank 5yrs old.
Key facts
- New furnace
- Roof replacement
- Central air system
Tags
Property features AI
Exterior
- Parking: Detached garage with electricity; Approximately 1.5 garage spaces
- Security: Fully fenced lot
- Utilities: Electricity connected (circuit breakers); Public water connected; Sewer connected; High-speed internet available; Cable available
- Home design: Single-story home; Block foundation; Aluminum siding and brick exterior; Asphalt shingle roof; Resale property; City street frontage; Rectangular residential lot (approximately 33 x 104)
- Construction: Built (existing); Copper plumbing
- Exterior features: Concrete driveway; Fully fenced yard; Hot tub/spa; Open porch
Interior
- Kitchen: Gas oven; Gas range; Microwave; Dishwasher; Refrigerator; Eat-in kitchen (see interior features)
- Bedrooms: One main-level bedroom
- Flooring: Carpet; Ceramic tile; Laminate; Varied flooring types
- Bathrooms: Two full bathrooms; One main-level bathroom
- Heating & cooling: Gas forced-air heating; Central air conditioning
- Interior features: Ceiling fans; Separate formal dining room; Eat-in kitchen; Separate formal living room; Hot tub/spa (interior feature noted); Natural woodwork; Main level primary bedroom; Programmable thermostat
- Laundry & utility: Washer and dryer; Laundry located in basement; Gas water heater
Neighborhood map
What this means for you Summary
Snapshot
- This is a 3-bed/1.0-bath single-family listed at $200k.
Deal economics
- At list price, monthly cash flow is $-129 ($-2k/yr) — negative.
- To cash-flow at today's rent, offer at most $177k (11.4% below list).
- To meet the 1% rule (rent ≥ 1% of price), the offer needs to be $135k (32.7% below list).
- Recommended offer: $135k (32.7% below list) — sets the bar for 1% rule.
- Cap rate 5.5% vs local median 8.0% in Buffalo — below-typical yield; the buyer is paying a premium for something (appreciation thesis, condition, location) that the cap rate doesn't capture.
Location & tenants
- Location reads 77/100 on livability (#195 in NY, #3,011 nationally) — a middle-class / working-renter tenant base. Strengths: commute A+, housing A+, health & safety A+; Watch: crime F, employment D-.
- Buffalo City School District (urban): math 41% / reading 40% proficiency, ranked #535 of 590 in NY (top 91%) — families likely to look elsewhere, expect single-tenant / working-renter base with shorter leases; 75% free/reduced lunch — lower-income household profile, screen leases tightly.
- Zoned schools: International School (math 8% / reading 17%, grade F, #2,048 of 2,108 statewide, top 97%, 981 students, 92% FRL); Hutchinson Central Technical High School (math 96% / reading 32%, grade B-, #807 of 1,100 statewide, top 73%, 1,175 students, 78% FRL).
- Market conditions: 170 active listings in the ZIP; 11 comparable units currently listed for rent nearby; rentals at typical pace (median 26d on market — plan ~3-4 weeks tenant-placement turnaround); 1,244 units permitted in Erie County in 2024 (563 in 5+ unit buildings).
- This rent runs 32% of the median local income ($50k/yr) — at the standard rent-burdened threshold; future hikes will face affordability resistance.
Forward outlook
- In year one you build about $17k of equity ($1k loan paydown + $16k appreciation (8.1% local appreciation)).
- By year 3, paydown + projected appreciation supports a ~$44k cash-out refi (75% LTV) — recoverable capital for the next deal without selling this one.
Negotiation context
- Only 6 days on market — expect competitive offers; lowballing is unlikely to land.
- 2 sale attempts since 8y ago with the ask held roughly flat each time — persistent listings suggest the price (not the market) is what's stuck; bring a comps-based counter.
- Current owner paid $135k; 48% above their basis — modest negotiation headroom, anchor on the comps not their cost.
Risks & watch-outs
- Watch-outs: built in 1948 — expect roof / HVAC / electrical / plumbing capex.
Questions for the listing agent
- What do current leases actually rent for vs. the listed asking? Can we see a recent rent roll and the last 12 months of T-12 income?
- Built in 1948 — when were the roof, HVAC, electrical panel, plumbing, and water heater last replaced?
- Is there a deadline driving the sale (1031 exchange, divorce, estate, relocation)? That informs how much negotiation room exists.
- Crime grade is F in this area — have there been break-ins, vandalism, or insurance claims at this property in the last 3 years? What carrier currently insures it and at what premium?
- This sits on a lake — are riparian / water-frontage rights deeded with the parcel? Any dock permits, shoreline easements, or HOA water-use restrictions?
- What's the documented flood / surge / shoreline-erosion history here (FEMA AND non-FEMA — e.g., storm surge, creek backup, septic-field saturation)?
- Any water-quality or seasonal algae-bloom issues that affect tenant satisfaction or short-term-rental demand?
- What's the average days-on-market for RENTAL listings here right now (not sales)? A rising rental-DOM trend means longer vacancies and softer asking-rent achievability than the comps imply.
- What's the recent tenant-quality profile in this submarket — average credit score on applications, eviction rate, late-payment / NSF rate, and stable-employment percentage? A property-management company in the area should have these aggregated.
- How much new for-sale + rental construction is in the pipeline within 1–3 miles? Heavy new supply typically softens prices + rents 12–24 months out; constrained supply supports both.
Investment metrics
- 1% rule
- 0.67% ✗
- Cap rate
- 5.52%
- Cash-on-cash
- -2.77%
- DSCR
- 0.88
- GRM
- 12.4
CMA / ARV
- ARV (on-the-fly)
- $286,293
- Comps found
- 12
Show comp detail 12 sales within ~0.75 mi
| Address | Dist | Beds/Ba | Sqft | Sold | Price | $/sf | Match |
|---|---|---|---|---|---|---|---|
| 102 S Pierce St | 0.16mi | 3/1.0 | 1,574 (+6%) | 7mo | $290,000 | $184 | 77 |
| 287 Willett St | 0.13mi | 3/1.0 | 1,342 (-10%) | 3mo | $192,000 | $143 | 76 |
| 236 Weimar St | 0.40mi | 3/1.0 | 1,544 (+4%) | 4mo | $165,000 | $107 | 72 |
| 175 Cable St | 0.32mi | 3/1.0 | 1,582 (+7%) | 3mo | $100,000 | $63 | 71 |
| 202 S Ogden St | 0.26mi | 3/1.0 | 1,592 (+7%) | 6mo | $205,500 | $129 | 71 |
| 143 Weiss St | 0.42mi | 3/1.0 | 1,410 (-5%) | 3mo | $106,000 | $75 | 70 |
| 104 Weimar St | 0.43mi | 3/1.0 | 1,549 (+4%) | 5mo | $172,900 | $112 | 69 |
| 238 S Ogden St | 0.20mi | 4/1.5 (+1) | 1,565 (+6%) | 8mo | $228,000 | $146 | 68 |
| 258 Holly St | 0.20mi | 4/2.0 (+1) | 1,594 (+8%) | 5mo | $245,000 | $154 | 65 |
| 9 Marann Ter | 0.26mi | 3/1.5 | 1,280 (-14%) | 2mo | $265,000 | $207 | 61 |
| 580 S Ogden St Unit W | 0.49mi | 4/1.0 (+1) | 1,362 (-8%) | 3mo | $145,800 | $107 | 56 |
| 253 N Meadowbrook Pkwy | 0.66mi | 4/1.0 (+1) | 1,346 (-9%) | 6mo | $250,000 | $186 | 44 |
Match score weights: distance 35% · size 25% · config 20% · recency 20%. Top-matched comps best support the ARV.
Projected returns pro-forma
8.06% appreciation · 3.0% rent growth · sell at horizon
- IRR
- 18.0%
- Equity multiple
- 2.34×
- Total profit
- $74,761
- Equity at exit
- $152,664
- IRR
- 17.0%
- Equity multiple
- 4.98×
- Total profit
- $222,863
- Equity at exit
- $303,797
Cash invested: $55,972 (down + closing). Projections, not guarantees.
Landlord ↔ Tenant lean methodology
- Overall (STATE)
- 15 Strongly Tenant-Friendly
- State New York
- 15 Strongly Tenant-Friendly · D+10
- County
- — inherits STATE
- City
- — inherits STATE
ZIP-level market 14206
- Home prices YoY
- 1.8%
- Active inventory
- 170
- Price-to-rent
- 12.4×
Monthly cashflow live
- Estimated rent
- $1,346 high interval (Pro) →
- Mortgage (P&I)
- −$1,048
- Tax from tax record
- −$61 /mo · $733/yr
- Insurance
- −$83
- HOA
- −$0
- Vacancy / Maint / Mgmt
- −$283
- Net cashflow
- $-129
Break-even live
Sensitivity live
| Price | -10% $-16 | -5% $-73 | +0% $-129 | +5% $-186 | +10% $-243 |
|---|---|---|---|---|---|
| Rent | -10% $-236 | -5% $-183 | +0% $-129 | +5% $-76 | +10% $-23 |
| Rate | -1.0pp $-29 | -0.5pp $-78 | base $-129 | +0.5pp $-181 | +1.0pp $-234 |
UW: 25.0% down · 7.5% · 30yr · 1.5% tax · 5.0% vac · 8.0% maint · 8.0% mgmt
Financing live
Cash to close
- Down payment
- $49,975
- Closing costs
- $5,997
- Reserves months
- —
- Total cash needed
- —
Loan-product check · same deal, 3 products live
Conventional
25% down · 7.5% · 30yr
- Down + closing
- —
- Monthly P&I
- —
- Monthly cashflow
- —
- DSCR
- —
- Eligible?
- —
Personal DTI + credit; lowest rate.
DSCR
20% down · 8.5% · 30yr
- Down + closing
- —
- Monthly P&I
- —
- Monthly cashflow
- —
- DSCR
- —
- Eligible?
- —
No personal income docs; deal must DSCR.
Hard money
10% down · 12.0% · 12mo
- Down + closing
- —
- Monthly P&I
- —
- Monthly cashflow
- —
- DSCR
- —
- Eligible?
- —
Short-term bridge; refi at stabilization.
Rent comps 11 comps
| Address | Beds | Baths | Sqft | Rent | $/sqft | DOM | Units | Dist |
|---|---|---|---|---|---|---|---|---|
| 34 Hayden St Unit Back Buffalo, NY | 3.0 | 1.0 | 1200 | $1,600 | $1.33 | 45d | 1 | 1.00mi |
| 1368 Harlem Rd Buffalo, NY | 2.0 | 1.0 | 1776 | $1,300 | $0.73 | 25d | 1 | 1.05mi |
| 1899 Seneca St Buffalo, NY | 3.0 | 1.0 | 1134 | $1,075 | $0.95 | 16d | 1 | 1.06mi |
| 1927 Seneca St Buffalo, NY | 3.0 | 1.0 | 1196 | $1,250 | $1.05 | 25d | 1 | 1.06mi |
| 23 Indian Orchard Pl Unit Lower Buffalo, NY | 3.0 | 1.0 | 1200 | $1,250 | $1.04 | 45d | 1 | 1.10mi |
| 76 Hammerschmidt Ave Buffalo, NY | 3.0 | 1.0 | 1200 | $1,275 | $1.06 | 3d | 1 | 1.15mi |
| 2111 Seneca St #3 Buffalo, NY | 2.0 | 1.0 | 937 | $1,150 | $1.23 | 45d | 1 | 1.16mi |
| 1150 Bailey Ave Buffalo, NY | 4.0 | 1.5 | 1100 | $1,200 | $1.09 | 25d | 1 | 1.31mi |
| 298 Cumberland Ave Buffalo, NY | 3.0 | 1.5 | 1208 | $2,200 | $1.82 | 3d | 1 | 1.41mi |
| 47 Lester St Unit Main Floor Buffalo, NY | 3.0 | 1.0 | 900 | $1,000 | $1.11 | 45d | 1 | 1.43mi |
| 214 Abbott Rd Unit 2 Buffalo, NY | 2.0 | 1.0 | 945 | $1,200 | $1.27 | 16d | 1 | 1.49mi |
Listing history 5 events
-
2026-06-21days on market $199,900 Active 6 DOM
-
2026-06-18days on market $199,900 Active 3 DOM
-
2026-06-17days on market $199,900 Active 2 DOM
-
2026-06-15remarks 699-char remark
-
2026-06-15$199,900 Active 1 DOM
ⓘ Source: listings_history table (triggers on properties + properties_extension) + one-shot
backfill from property_details.listing_events for pre-trigger history.
Tax reassessment forecast NY · Partial reset (capped growth)
- Current annual tax
- $733 · $61/mo
- Projected year-2 tax
- $2,056 · $171/mo
- Expected delta
- +$1,323/yr (+$110/mo · 180.4%)
ⓘ Screening estimate from a state-policy table — verify with the county assessor before closing.
Climate risk First Street
- Flood 4/10 Moderate FEMA zone X (unshaded) · 22% chance over 30 yrs
- Wildfire 1/10 Low
- Heat 3/10 Moderate 7 d/yr ≥92°F today · 15 d/yr by 30 yrs out
- Wind 1/10 Low
- Air quality 3/10 Moderate 2 unhealthy d/yr today · 3 by 30 yrs out
Nearby sold comps map
Loading sold comps map…
Walkable amenities ~0.75 mi
Loading nearby amenities…
Taxation est. · year 1
- Rental income
- $16,152
- − Mortgage interest
- −$11,198
- − Property taxes
- −$733
- − Insurance
- −$1,000
- − Repairs & maintenance
- −$1,292
- − Management
- −$1,292
- − Depreciation
- −$5,815
- Taxable loss
- −$5,178
- Est. tax savings @ 24.0%
- +$1,243
- After-tax cash flow
- $-309/yr
For passive investors: Depreciation is non-cash, so a rental often shows a tax loss while cash-flowing — sheltering income. Rental losses are passive: they offset passive income freely, and up to $25,000/yr can offset ordinary (W-2) income if you actively participate and your MAGI is under $100k (phasing out to $0 by $150k); unused losses carry forward. On sale, claimed depreciation is recaptured at up to 25%, and gains may owe capital-gains tax (a 1031 exchange can defer both). Figures are a year-1 estimate at your 24.0% rate — not tax advice; consult a CPA.
Schools (NCES district)
- District
- Buffalo City School District
- NCES district ID
- 3605850
- Math proficiency
- 41% ▲ 11.00%
- Reading proficiency
- 40% ▲ 7.00%
- Median HH income
- $31,665
- Composite
- 33.17/100
- National rank
- #5544
- State rank
- #535 of 590 in NY
Livability — Buffalo
- Score
- 77/100
- State rank
- #195
- US rank
- #3011
Category grades
Schools grade is shown separately in the Schools card above.
Census & demographics
- Census place
- Buffalo, NY
- County
- Erie County · 714,559 people
- City population
- 440,021
- Metro
- Buffalo-Cheektowaga, NY
- Population (ZIP)
- 21,631
- Household income
- $50,450
- Rent vs Own
- Severe rent burden
- 841.0
Population outlook (Erie County) Hauer SSP2
- Today (2025)
- 933,037 people
- By 2030
- 935,181 · +0.2%
- By 2040
- 928,531 · -0.5%
- By 2050
- 905,725 · -2.9%
- By 2075
- 834,037 · -10.6%
- By 2100
- 708,033 · -24.1%
Race, ethnicity, and origin ACS 2023
- Neighborhood character
- Majority White (65%)
- Race & ethnicity
- White 65% Hispanic / Latino 13% Black 12% Two or more races 8% Asian 4%
- Hispanic origin (detail)
- Mexican 2% Puerto Rican 10%
- Common ancestry
- Romanian 25% Lithuanian 1% Italian 1%
- Foreign-born
- 6% · Canada, China
- Languages at home
- 88% English-only · Spanish 5% Other Indo-European 3% Arabic 2%
Political lean MEDSL · Erie
- 2024 margin
- Lean D (+9.7) · D 54.8% · R 45.2%
- 2008→2024 swing
- -7.9pp toward R · 2008: 17.5pp · 2024: 9.7pp
- All cycles
- 2024: D+9.7 2020: D+14.7 2016: D+4.8 2012: D+15.6 2008: D+17.5
Not yet ingested
- Civics
- —
Market trends
- HPI YoY
- ▲ 8.06%
- Current HPI
- 457.3935
- Rent YoY
- —
- Metro
- Buffalo-Cheektowaga, NY
- State GDP YoY
- ▲ 2.60%
- F500 in state
- 92
Industry mix (Fortune 500 HQ in NY)
| Industry | F500 HQs | Revenue |
|---|---|---|
| Financial Services | 10 | $950B |
|
||
| Consumer Goods | 9 | $162B |
|
||
| Insurance | 4 | $225B |
|
||
| Telecommunications | 2 | $144B |
|
||
| Pharmaceuticals | 2 | $112B |
|
||
| Media / Entertainment | 2 | $69B |
|
||
Price history
+148.3% since first listed7 events — show timeline
- 2026-06-15 Listed $199,900 WNYREIS
- 2019-01-15 Sold (Public Records) $135,000 Public Records
- 2019-01-03 Sold (MLS) $130,000 WNYREIS
- 2018-12-03 Pending — WNYREIS
- 2018-11-20 Pending — WNYREIS
- 2018-11-17 Listed $119,900 WNYREIS
- 2003-11-21 Sold (Public Records) $80,500 Public Records
Property tax history
+4.9%/yrLatest (2025): $733 · +13.7% YoY. Source: county tax records.
Cash-flow waterfall
monthlySold comps — $/sqft
last 12 mo · ≤1 miLoading sold comps…