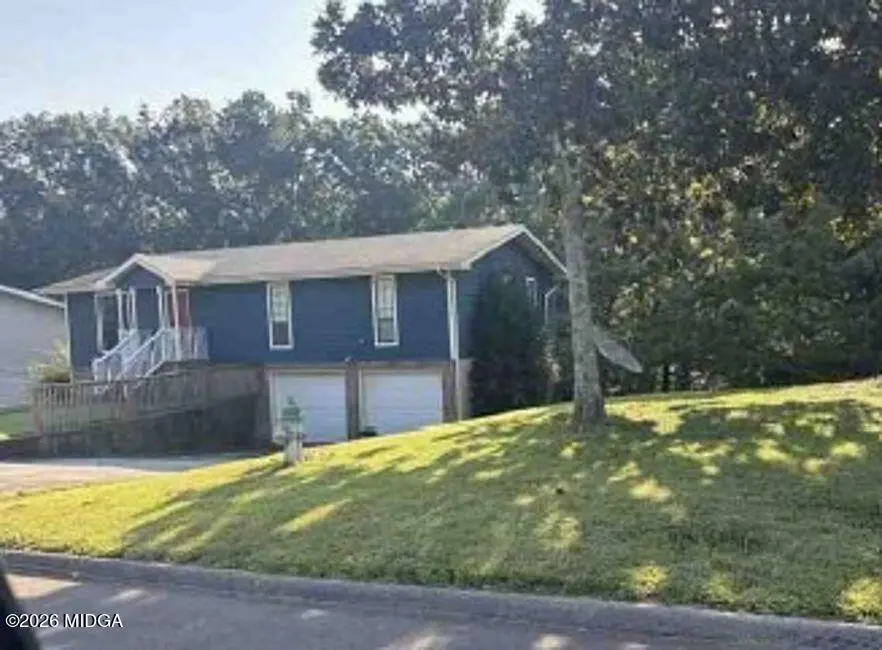
54 Crest Cir · Ringgold, GA
Flood risk 1/10 · Minimal
- FEMA flood zone
- X (unshaded)
- Chance of flooding over 30 yrs
- 0.0%
- Est. flood insurance / yr
- $507 – $1,088
Fire risk 4/10 · Minor
- Est. fire insurance / yr
- $963 – $1,789
Heat risk 5/10 · Moderate
- Hot days now (above 104°F)
- 7 days/yr
- Hot days in 30 yrs
- 19 days/yr
Wind risk 4/10 · Minor
- Chance of severe wind over 30 yrs
- 11.0%
Air-quality risk 3/10 · Minor
- Unhealthy air days now
- 2 days/yr
- Unhealthy air days in 30 yrs
- 2 days/yr
Risk factors via First Street. Map © Google.
Why this score? — see what drove the C grade
The composite is a weighted blend of 9 inputs, each scored 0–100. Each bar is that input's sub-score; the figure is the points it added to the 100-point composite (weight × sub-score).
- Cash flow +19.3/30.0
- ARV discount +15.0/15.0
- DSCR +6.1/10.0
- 1% rule +4.5/10.0
- Rent growth +4.2/5.0
- Livability +3.8/5.0
- Schools +3.3/10.0
- Condition / age +2.5/5.0
- Appreciation +0.0/10.0
$198,560
🖨 Deal sheet 📄 Offer letter ✓ Due diligence
Listing remarks MLS
Offers to be placed on Xome.com. Interior inspections are not available, do not trespass! Forward all inquiries and questions to Xome Customer Service. NO REPRESENTATION TO VALIDITY OF INFORMATION IS MADE, BUYER TO VERIFY ALL INFORMATION WHERIN.
Key facts
- 0.41 acre lot
- 2 garage spots
- Built 1984
Neighborhood map
What this means for you Summary
Snapshot
- This is a 3-bed/2.0-bath single-family listed at $199k.
Deal economics
- At list price, monthly cash flow is $216 ($3k/yr) — positive.
- The deal already cash-flows at list — no discount required.
- To meet the 1% rule (rent ≥ 1% of price), the offer needs to be $189k (5.0% below list).
- Recommended offer: $187k (6.0% below list) — sets the bar for market timing.
- Cap rate 7.6% vs local median 3.2% in Ringgold — top-decile yield for the area; either an underpriced asset or a hidden risk that comps aren't pricing in. Stress-test before assuming the spread holds.
Location & tenants
- Location reads 76/100 on livability (#28 in GA, #3,772 nationally) — a middle-class / working-renter tenant base. Strengths: cost of living A+, health & safety A+, housing B; Watch: schools C-, amenities C-, commute F.
- Catoosa County (suburban): math 36% / reading 41% proficiency, ranked #49 of 174 in GA (top 28%) — families likely to look elsewhere, expect single-tenant / working-renter base with shorter leases.
- Market conditions: Rents rising fast (+6.8%/yr); 353 active listings in the ZIP; 2 comparable units currently listed for rent nearby; solid renter incomes; 848 units permitted in Catoosa County in 2024 (256 in 5+ unit buildings).
Forward outlook
- Local home prices are declining (-3.0%/yr); year-one equity from $1k of loan paydown is wiped out by about $6k of value loss. Plan a longer hold.
- Catoosa County population projected at +5% by 2050 — modest demand growth; plan on rents tracking national, not racing it.
- At projected returns (-3.0% appreciation + 6.8% rent growth), your $56k cash investment doubles in ~10 years — after that, you're playing with house money.
Negotiation context
- It's been on market 87 days — a 6% lower offer ($187k) is reasonable based on typical stale-listing flexibility.
- 5 sale attempts since 4y ago; this cycle's ask has dropped $14k (6%) from the opening price — seller is motivated, your offer sets the floor, not the list.
Risks & watch-outs
- Climate carrying-cost: extreme-heat days projected 7→19/yr by 2055 (HVAC capex compounding) — expect insurance premiums to compound above CPI over the hold.
Questions for the listing agent
- It's been on market 87 days. Have you received any prior offers? Is the seller open to a 6% concession, seller financing, or rate buy-down credit?
- Why hasn't it sold? Are there any deal-killer items the seller is aware of (foundation, flood, title, zoning, code violations)?
- Is there a deadline driving the sale (1031 exchange, divorce, estate, relocation)? That informs how much negotiation room exists.
- What's the average days-on-market for RENTAL listings here right now (not sales)? A rising rental-DOM trend means longer vacancies and softer asking-rent achievability than the comps imply.
- What's the recent tenant-quality profile in this submarket — average credit score on applications, eviction rate, late-payment / NSF rate, and stable-employment percentage? A property-management company in the area should have these aggregated.
- How much new for-sale + rental construction is in the pipeline within 1–3 miles? Heavy new supply typically softens prices + rents 12–24 months out; constrained supply supports both.
Investment metrics
- 1% rule
- 0.95% ✗
- Cap rate
- 7.60%
- Cash-on-cash
- 4.67%
- DSCR
- 1.21
- GRM
- 8.8
CMA / ARV
- ARV (median comp)
- $238,821
- List price
- $198,560
- Delta
- -16.86%
- Verdict
- UNDERPRICED
- Comps
- 20 within 1.0 mi
Show comp detail 12 sales within ~0.75 mi
| Address | Dist | Beds/Ba | Sqft | Sold | Price | $/sf | Match |
|---|---|---|---|---|---|---|---|
| 200 Crest Cir | 0.14mi | 3/2.0 | 1,232 (-5%) | 6mo | $280,000 | $227 | 80 |
| 158 Smokewood Ln | 0.46mi | 3/3.0 | 1,299 (+0%) | 0mo | $190,000 | $146 | 74 |
| 54 Apple Ln | 0.31mi | 3/2.0 | 1,188 (-8%) | 3mo | $239,000 | $201 | 70 |
| 492 Smoketree Cir | 0.52mi | 3/2.0 | 1,347 (+4%) | 8mo | $275,000 | $204 | 62 |
| 257 Sparrow Ln | 0.55mi | 3/2.0 | 1,226 (-5%) | 5mo | $234,500 | $191 | 61 |
| 115 Smoketree Cir | 0.50mi | 3/2.0 | 1,200 (-7%) | 4mo | $180,000 | $150 | 61 |
| 158 Smoketree Cir | 0.49mi | 3/2.0 | 1,188 (-8%) | 4mo | $240,000 | $202 | 60 |
| 1931 Boynton Dr | 0.66mi | 3/2.0 | 1,279 (-1%) | 9mo | $300,000 | $235 | 60 |
| 88 Sparrow Ln | 0.68mi | 4/2.0 (+1) | 1,270 (-2%) | 10mo | $270,000 | $213 | 51 |
| 1933 Boynton Dr | 0.68mi | 3/2.0 | 1,205 (-7%) | 9mo | $277,150 | $230 | 49 |
| 128 Harbour Ln | 0.74mi | 3/2.0 | 1,376 (+6%) | 10mo | $248,000 | $180 | 47 |
| 63 Johns Dr | 0.67mi | 3/2.0 | 1,426 (+10%) | 10mo | $274,000 | $192 | 44 |
Match score weights: distance 35% · size 25% · config 20% · recency 20%. Top-matched comps best support the ARV.
Projected returns pro-forma
-3.0% appreciation · 6.84% rent growth · sell at horizon
- IRR
- -5.1%
- Equity multiple
- 0.80×
- Total profit
- $-10,860
- Equity at exit
- $29,606
- IRR
- 8.5%
- Equity multiple
- 1.75×
- Total profit
- $41,778
- Equity at exit
- $17,168
Cash invested: $55,597 (down + closing). Projections, not guarantees.
Landlord ↔ Tenant lean methodology
- Overall (STATE)
- 90 Strongly Landlord-Friendly
- State Georgia
- 90 Strongly Landlord-Friendly · R+3
- County
- — inherits STATE
- City
- — inherits STATE
ZIP-level market 30736
- Home prices YoY
- -21.9%
- Rents YoY
- 6.8%
- Active inventory
- 353
- Price-to-rent
- 8.8×
Monthly cashflow live
- Estimated rent
- $1,887 medium interval (Pro) →
- Mortgage (P&I)
- −$1,041
- Tax from tax record
- −$150 /mo · $1,802/yr
- Insurance
- −$83
- HOA
- −$0
- Vacancy / Maint / Mgmt
- −$396
- Net cashflow
- $216
Break-even live
UW: 25.0% down · 7.5% · 30yr · 1.5% tax · 5.0% vac · 8.0% maint · 8.0% mgmt
Financing live
Cash to close
- Down payment
- $49,640
- Closing costs
- $5,957
- Reserves months
- —
- Total cash needed
- —
Loan-product check · same deal, 3 products live
Conventional
25% down · 7.5% · 30yr
- Down + closing
- —
- Monthly P&I
- —
- Monthly cashflow
- —
- DSCR
- —
- Eligible?
- —
Personal DTI + credit; lowest rate.
DSCR
20% down · 8.5% · 30yr
- Down + closing
- —
- Monthly P&I
- —
- Monthly cashflow
- —
- DSCR
- —
- Eligible?
- —
No personal income docs; deal must DSCR.
Hard money
10% down · 12.0% · 12mo
- Down + closing
- —
- Monthly P&I
- —
- Monthly cashflow
- —
- DSCR
- —
- Eligible?
- —
Short-term bridge; refi at stabilization.
Rent comps 2 comps
| Address | Beds | Baths | Sqft | Rent | $/sqft | DOM | Units | Dist |
|---|---|---|---|---|---|---|---|---|
| 137 Jason Ct Ringgold, GA | 3.0 | 1.5 | 1100 | $1,823 | $1.66 | 43d | 1 | 0.76mi |
| 13 Arrowhead Ln Ringgold, GA | 2.0 | 1.5 | 1000 | $1,250 | $1.25 | 13d | 1 | 1.44mi |
Listing history 31 events
-
2026-06-18days on market $198,560 Active 87 DOM
-
2026-06-17days on market $198,560 Active 86 DOM
-
2026-06-16days on market $198,560 Active 85 DOM
-
2026-06-15days on market $198,560 Active 84 DOM
-
2026-06-14days on market $198,560 Active 82 DOM
-
2026-06-10days on market $198,560 Active 79 DOM
-
2026-06-09days on market $198,560 Active 78 DOM
-
2026-06-08days on market $198,560 Active 77 DOM
-
2026-06-07days on market $198,560 Active 76 DOM
-
2026-06-03days on market $198,560 Active 72 DOM
-
2026-06-02days on market $198,560 Active 71 DOM
-
2026-06-01days on market $198,560 Active 70 DOM
-
2026-05-31days on market $198,560 Active 69 DOM
-
2026-05-30days on market $198,560 Active 68 DOM
-
2026-04-09price $198,560 245-char remark
Show marketing remark (245 chars)
Offers to be placed on Xome.com. Interior inspections are not available, do not trespass! Forward all inquiries and questions to Xome Customer Service. NO REPRESENTATION TO VALIDITY OF INFORMATION IS MADE, BUYER TO VERIFY ALL INFORMATION WHERIN.
-
2026-03-23$212,160 Active 245-char remark
Show marketing remark (245 chars)
Offers to be placed on Xome.com. Interior inspections are not available, do not trespass! Forward all inquiries and questions to Xome Customer Service. NO REPRESENTATION TO VALIDITY OF INFORMATION IS MADE, BUYER TO VERIFY ALL INFORMATION WHERIN.
-
2026-01-20$275,000
-
2026-01-20historical
-
2025-11-04historical
-
2025-10-14price $229,500
-
2025-09-13$239,500 Active
-
2025-09-13$229,500 New
-
2022-10-17soldstatus $250,000 Closed
-
2022-09-18status Pending
-
2022-08-29price $260,000
-
2022-08-10$280,000 Active
-
2018-05-07soldstatus $149,000
-
2018-05-04soldstatus $149,900
-
2015-08-28soldstatus $139,000
-
2015-08-24soldstatus $139,000
-
2002-09-18soldstatus $101,500
ⓘ Source: listings_history table (triggers on properties + properties_extension) + one-shot
backfill from property_details.listing_events for pre-trigger history.
Tax reassessment forecast GA · Resets to sale price
- Current annual tax
- $1,802 · $150/mo
- Projected year-2 tax
- $1,827 · $152/mo
- Expected delta
- +$25/yr (+$2/mo · 1.4%)
ⓘ Screening estimate from a state-policy table — verify with the county assessor before closing.
Climate risk First Street
- Flood 1/10 Low FEMA zone X (unshaded) · 0% chance over 30 yrs
- Wildfire 4/10 Moderate
- Heat 5/10 Major 7 d/yr ≥104°F today · 19 d/yr by 30 yrs out
- Wind 4/10 Moderate 11% chance of damaging wind over 30 yrs
- Air quality 3/10 Moderate 2 unhealthy d/yr today · 2 by 30 yrs out
Nearby sold comps map
Loading sold comps map…
Walkable amenities ~0.75 mi
Loading nearby amenities…
Taxation est. · year 1
- Rental income
- $22,640
- − Mortgage interest
- −$11,122
- − Property taxes
- −$1,802
- − Insurance
- −$993
- − Repairs & maintenance
- −$1,811
- − Management
- −$1,811
- − Depreciation
- −$5,776
- Taxable loss
- −$676
- Est. tax savings @ 24.0%
- +$162
- After-tax cash flow
- $2,758/yr
For passive investors: Depreciation is non-cash, so a rental often shows a tax loss while cash-flowing — sheltering income. Rental losses are passive: they offset passive income freely, and up to $25,000/yr can offset ordinary (W-2) income if you actively participate and your MAGI is under $100k (phasing out to $0 by $150k); unused losses carry forward. On sale, claimed depreciation is recaptured at up to 25%, and gains may owe capital-gains tax (a 1031 exchange can defer both). Figures are a year-1 estimate at your 24.0% rate — not tax advice; consult a CPA.
Schools (NCES district)
- District
- Catoosa County
- NCES district ID
- 1300930
- Math proficiency
- 36% ▼ -15.00%
- Reading proficiency
- 41% ▼ -8.00%
- Median HH income
- $48,913
- Composite
- 33.13/100
- National rank
- #5558
- State rank
- #49 of 174 in GA
Livability — Ringgold
- Score
- 76/100
- State rank
- #28
- US rank
- #3772
Category grades
Schools grade is shown separately in the Schools card above.
Census & demographics
- County
- Catoosa County · 52,244 people
- City population
- 44,499
- Metro
- Chattanooga, TN-GA
- Population (ZIP)
- 44,499
- Household income
- $83,821
- Rent vs Own
- Severe rent burden
- 559.0
Population outlook (Catoosa County) Hauer SSP2
- Today (2025)
- 70,112 people
- By 2030
- 71,621 · +2.2%
- By 2040
- 73,595 · +5.0%
- By 2050
- 73,921 · +5.4%
- By 2075
- 72,135 · +2.9%
- By 2100
- 65,979 · -5.9%
Race, ethnicity, and origin ACS 2023
- Neighborhood character
- Predominantly White (89%)
- Race & ethnicity
- White 89% Two or more races 5% Hispanic / Latino 3% Black 2% Asian 1%
- Common ancestry
- Slovak 2% Italian 2% Serbian 2%
- Foreign-born
- 2% · Canada
- Languages at home
- 96% English-only · Spanish 2% Russian/Polish/Slavic 1%
Political lean MEDSL · Catoosa
- 2024 margin
- Solid R (+55.5) · D 22.0% · R 77.5%
- 2008→2024 swing
- -5.7pp toward R · 2008: -49.8pp · 2024: -55.5pp
- All cycles
- 2024: R+55.5 2020: R+56.0 2016: R+60.7 2012: R+52.8 2008: R+49.8
Not yet ingested
- Civics
- —
Market trends
- HPI YoY
- ▼ -70.42%
- Current HPI
- 251.8824
- Rent YoY
- ▲ 6.84%
- Metro
- Chattanooga, TN-GA
- State GDP YoY
- ▲ 2.66%
- F500 in state
- 28
Industry mix (Fortune 500 HQ in GA)
| Industry | F500 HQs | Revenue |
|---|---|---|
| Paper / Packaging | 2 | $29B |
|
||
| Retail | 1 | $160B |
|
||
| Transportation / Logistics | 1 | $91B |
|
||
| Airlines | 1 | $62B |
|
||
| Consumer Goods | 1 | $47B |
|
||
| Utilities | 1 | $25B |
|
||
Price history
+95.6% since first listed17 events — show timeline
- 2026-04-09 Price Changed $198,560 MGMLS
- 2026-03-23 Listed $212,160 MGMLS
- 2026-01-20 Listed $275,000 REALTRACS as Distributed by MLS Grid
- 2026-01-20 Listing Removed — REALTRACS as Distributed by MLS Grid
- 2025-11-04 Listing Removed — GAMLS
- 2025-10-14 Price Changed $229,500 FMLS
- 2025-09-13 Listed $229,500 GAMLS
- 2025-09-13 Listed $239,500 FMLS
- 2022-10-17 Sold (MLS) $250,000 GCAR
- 2022-09-18 Pending — GCAR
- 2022-08-29 Price Changed $260,000 GCAR
- 2022-08-10 Listed $280,000 GCAR
- 2018-05-07 Sold (Public Records) $149,000 Public Records
- 2018-05-04 Sold (MLS) $149,900 GCAR
- 2015-08-28 Sold (Public Records) $139,000 Public Records
- 2015-08-24 Sold (MLS) $139,000 GCAR
- 2002-09-18 Sold (Public Records) $101,500 Public Records
Property tax history
+5.8%/yrLatest (2025): $1,802 · -0.5% YoY. Source: county tax records.
Cash-flow waterfall
monthlySold comps — $/sqft
last 12 mo · ≤1 miLoading sold comps…