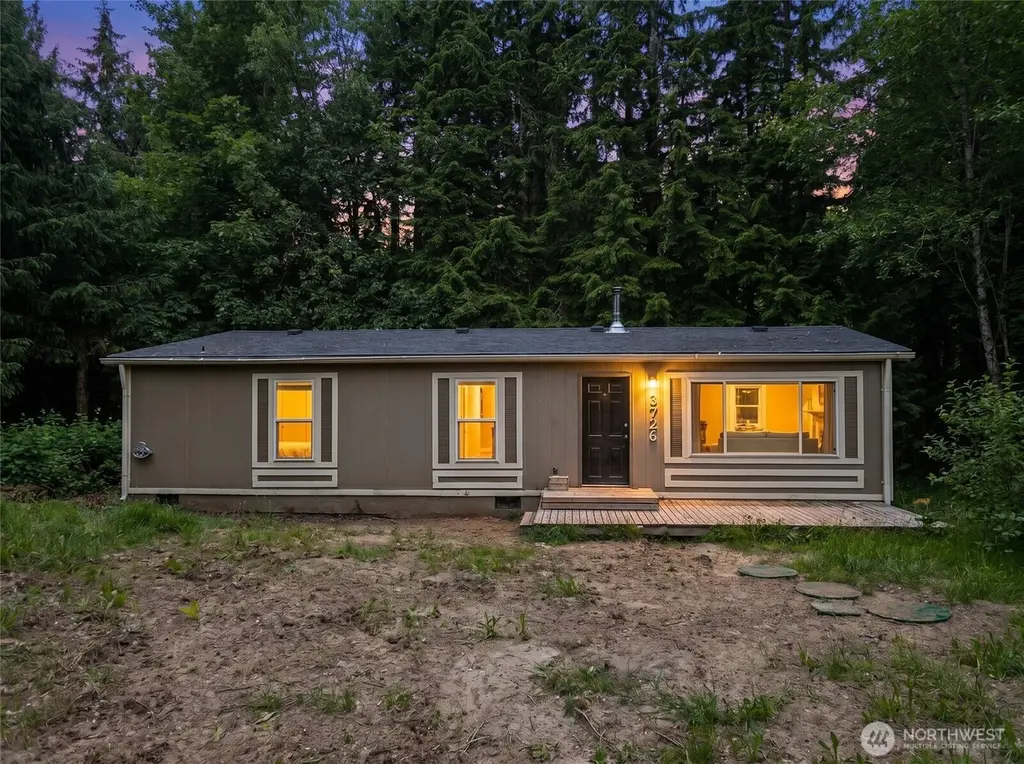
3726 234th Dr NE · Snohomish, WA
Flood risk 1/10 · Minimal
- FEMA flood zone
- X (unshaded)
- Chance of flooding over 30 yrs
- 0.0%
- Est. flood insurance / yr
- $507 – $1,088
Fire risk 3/10 · Minor
- Est. fire insurance / yr
- $604 – $1,122
Heat risk 2/10 · Minimal
- Hot days now (above 85°F)
- 7 days/yr
- Hot days in 30 yrs
- 15 days/yr
Wind risk 1/10 · Minimal
- Chance of severe wind over 30 yrs
- —
Air-quality risk 7/10 · Major
- Unhealthy air days now
- 9 days/yr
- Unhealthy air days in 30 yrs
- 11 days/yr
Risk factors via First Street. Map © Google.
Why this score? — see what drove the D+ grade
The composite is a weighted blend of 9 inputs, each scored 0–100. Each bar is that input's sub-score; the figure is the points it added to the 100-point composite (weight × sub-score).
- ARV discount +15.0/15.0
- Cash flow +13.6/30.0
- DSCR +4.1/10.0
- Livability +3.9/5.0
- Schools +3.5/10.0
- 1% rule +3.2/10.0
- Rent growth +2.5/5.0
- Condition / age +2.5/5.0
- Appreciation +0.0/10.0
$315,000
🖨 Deal sheet 📄 Offer letter ✓ Due diligence
Listing remarks
Tucked on a large private lot near Lake Alyson, this beautifully updated Granite Falls home delivers the peaceful PNW lifestyle you've been looking for. Tucked on a large private lot near Lake Alyson, this beautifully updated Granite Falls home delivers the peaceful PNW lifestyle you've been looking for. Open-concept living centers around a stunning kitchen with all-new stainless appliances, quartz countertops, white shaker cabinets, and a breakfast bar. Step onto the deck off the dining room, perfect for BBQs and entertaining. Three spacious bedrooms, beautiful bathrooms, and a mudroom complete the interior. A wood stove heats the entire home. Partially fenced yard with garden shed. New ro
Key facts
- Private lot
- Wood stove
- Stunning kitchen
Tags
Property features AI
Finance
- Financial info: Listing terms: Cash, Conventional, VA loan
Exterior
- Parking: Driveway
- Security: Partially fenced
- Utilities: Community water; Septic tank sewer; Electric water heater (located in bedroom closet); Power provided by Snohomish PUD (Snoh PUD1)
- Home design: Manufactured home on land (double wide); Redman 28x48 model; One story; Built on lot; Has a view; Entry/approach level: One level
- Construction: Wood construction; Composition roof; Pillar/post/pier foundation; Built as a manufactured double-wide
- Exterior features: Wood exterior; Wood products; Deck; Partially fenced yard; Outbuildings; Garden space; Wooded; Located on a cul-de-sac; Paved access
Interior
- Kitchen: Dishwasher; Microwave; Refrigerator; Stove/Range; Additional appliance notes: See remarks
- Bedrooms: 3 bedrooms (all on the main level)
- Flooring: Vinyl plank; Carpet
- Bathrooms: 1 full bath; 1 three-quarter bath; 2 total bathrooms on the main level
- Heating & cooling: Forced air heating; Wood stove / free-standing stove; No central cooling
- Interior features: Ceiling fan(s); Dining room; Fireplace; Skylight(s); Vaulted ceiling(s); Water heater
- Laundry & utility: Water heater located in bedroom closet
Neighborhood map
What this means for you Summary
Snapshot
- This is a 3-bed/1.0-bath manufactured listed at $315k.
Deal economics
- At list price, monthly cash flow is $18 ($214/yr) — positive.
- The deal already cash-flows at list — no discount required.
- To meet the 1% rule (rent ≥ 1% of price), the offer needs to be $257k (18.3% below list).
- Recommended offer: $257k (18.3% below list) — sets the bar for 1% rule.
- Cap rate 6.4% vs local median 2.3% in Snohomish — top-decile yield for the area; either an underpriced asset or a hidden risk that comps aren't pricing in. Stress-test before assuming the spread holds.
Location & tenants
- Location reads 78/100 on livability (#120 in WA, #2,426 nationally) — a middle-class / working-renter tenant base. Strengths: health & safety A+, housing A, schools A-; Watch: amenities F, cost of living F.
- Granite Falls School District (town): math 25% / reading 45% proficiency, ranked #232 of 291 in WA (top 80%) — families likely to look elsewhere, expect single-tenant / working-renter base with shorter leases.
- Market conditions: 97 active listings in the ZIP; 3,982 units permitted in Snohomish County in 2024 (1,492 in 5+ unit buildings).
Forward outlook
- Local home prices are declining (-3.0%/yr); year-one equity from $2k of loan paydown is wiped out by about $9k of value loss. Plan a longer hold.
- Snohomish County population projected at +30% by 2050 — long-run rental-demand tailwind backs the buy-and-hold thesis.
Negotiation context
- Only 14 days on market — expect competitive offers; lowballing is unlikely to land.
- 4 sale attempts since 23y ago with the ask held roughly flat each time — persistent listings suggest the price (not the market) is what's stuck; bring a comps-based counter.
Questions for the listing agent
- Is there a deadline driving the sale (1031 exchange, divorce, estate, relocation)? That informs how much negotiation room exists.
- Schools are A-rated — typically a magnet for longer-tenancy family renters. What's the average tenant stay here, and is there a school-zone premium baked into asking?
- The area grade is low — what's the realistic commute time and amenity access for the typical tenant pool here? Any planned neighborhood developments (good or bad) we should know about?
- What's the average days-on-market for RENTAL listings here right now (not sales)? A rising rental-DOM trend means longer vacancies and softer asking-rent achievability than the comps imply.
- What's the recent tenant-quality profile in this submarket — average credit score on applications, eviction rate, late-payment / NSF rate, and stable-employment percentage? A property-management company in the area should have these aggregated.
- How much new for-sale + rental construction is in the pipeline within 1–3 miles? Heavy new supply typically softens prices + rents 12–24 months out; constrained supply supports both.
Investment metrics
- 1% rule
- 0.82% ✗
- Cap rate
- 6.36%
- Cash-on-cash
- 0.24%
- DSCR
- 1.01
- GRM
- 10.2
CMA / ARV
- ARV (on-the-fly)
- $498,960
- Comps found
- 2
Show comp detail 2 sales within ~0.75 mi
| Address | Dist | Beds/Ba | Sqft | Sold | Price | $/sf | Match |
|---|---|---|---|---|---|---|---|
| 3705 232nd Dr NE | 0.03mi | 3/2.0 | 1,365 (+5%) | 17mo | $525,000 | $385 | 72 |
| 3425 230th Dr NE | 0.29mi | 3/2.0 | 1,404 (+8%) | 3mo | $260,000 | $185 | 66 |
Match score weights: distance 35% · size 25% · config 20% · recency 20%. Top-matched comps best support the ARV.
Projected returns pro-forma
-3.0% appreciation · 3.0% rent growth · sell at horizon
- IRR
- -15.9%
- Equity multiple
- 0.43×
- Total profit
- $-49,969
- Equity at exit
- $46,968
- IRR
- -7.6%
- Equity multiple
- 0.52×
- Total profit
- $-42,296
- Equity at exit
- $27,235
Cash invested: $88,200 (down + closing). Projections, not guarantees.
Landlord ↔ Tenant lean methodology
- Overall (STATE)
- 28 Tenant-Leaning
- State Washington
- 28 Tenant-Leaning · D+8
- County
- — inherits STATE
- City
- — inherits STATE
ZIP-level market 98252
- Active inventory
- 97
- Price-to-rent
- 10.2×
Monthly cashflow live
- Estimated rent
- $2,574 medium interval (Pro) →
- Mortgage (P&I)
- −$1,652
- Tax from tax record
- −$232 /mo · $2,788/yr
- Insurance
- −$131
- HOA
- −$0
- Vacancy / Maint / Mgmt
- −$541
- Net cashflow
- $18
Break-even live
UW: 25.0% down · 7.5% · 30yr · 1.5% tax · 5.0% vac · 8.0% maint · 8.0% mgmt
Financing live
Cash to close
- Down payment
- $78,750
- Closing costs
- $9,450
- Reserves months
- —
- Total cash needed
- —
Loan-product check · same deal, 3 products live
Conventional
25% down · 7.5% · 30yr
- Down + closing
- —
- Monthly P&I
- —
- Monthly cashflow
- —
- DSCR
- —
- Eligible?
- —
Personal DTI + credit; lowest rate.
DSCR
20% down · 8.5% · 30yr
- Down + closing
- —
- Monthly P&I
- —
- Monthly cashflow
- —
- DSCR
- —
- Eligible?
- —
No personal income docs; deal must DSCR.
Hard money
10% down · 12.0% · 12mo
- Down + closing
- —
- Monthly P&I
- —
- Monthly cashflow
- —
- DSCR
- —
- Eligible?
- —
Short-term bridge; refi at stabilization.
Listing history 10 events
-
2026-06-18days on market $315,000 Active 14 DOM
-
2026-06-17days on market $315,000 Active 13 DOM
-
2026-06-16days on market $315,000 Active 12 DOM
-
2026-06-15days on market $315,000 Active 11 DOM
-
2026-06-13days on market $315,000 Active 9 DOM
-
2026-06-13days on market $315,000 Active 8 DOM
-
2026-06-09days on market $315,000 Active 5 DOM
-
2026-06-08days on market $315,000 Active 4 DOM
-
2026-06-07remarks 699-char remark
-
2026-06-07$315,000 Active 3 DOM
ⓘ Source: listings_history table (triggers on properties + properties_extension) + one-shot
backfill from property_details.listing_events for pre-trigger history.
Tax reassessment forecast WA · Resets to sale price
- Current annual tax
- $2,788 · $232/mo
- Projected year-2 tax
- $3,087 · $257/mo
- Expected delta
- +$299/yr (+$25/mo · 10.7%)
ⓘ Screening estimate from a state-policy table — verify with the county assessor before closing.
Climate risk First Street
- Flood 1/10 Low FEMA zone X (unshaded) · 0% chance over 30 yrs
- Wildfire 3/10 Moderate
- Heat 2/10 Low 7 d/yr ≥85°F today · 15 d/yr by 30 yrs out
- Wind 1/10 Low
- Air quality 7/10 Severe 9 unhealthy d/yr today · 11 by 30 yrs out
Nearby sold comps map
Loading sold comps map…
Walkable amenities ~0.75 mi
Loading nearby amenities…
Taxation est. · year 1
- Rental income
- $30,886
- − Mortgage interest
- −$17,645
- − Property taxes
- −$2,788
- − Insurance
- −$1,575
- − Repairs & maintenance
- −$2,471
- − Management
- −$2,471
- − Depreciation
- −$9,164
- Taxable loss
- −$5,228
- Est. tax savings @ 24.0%
- +$1,255
- After-tax cash flow
- $1,468/yr
For passive investors: Depreciation is non-cash, so a rental often shows a tax loss while cash-flowing — sheltering income. Rental losses are passive: they offset passive income freely, and up to $25,000/yr can offset ordinary (W-2) income if you actively participate and your MAGI is under $100k (phasing out to $0 by $150k); unused losses carry forward. On sale, claimed depreciation is recaptured at up to 25%, and gains may owe capital-gains tax (a 1031 exchange can defer both). Figures are a year-1 estimate at your 24.0% rate — not tax advice; consult a CPA.
Schools (NCES district)
- District
- Granite Falls School District
- NCES district ID
- 5303210
- Math proficiency
- 25% ▼ -7.00%
- Reading proficiency
- 45% ▼ -5.00%
- Median HH income
- $69,578
- Composite
- 34.81/100
- National rank
- #10018
- State rank
- #232 of 291 in WA
Livability — Snohomish
- Score
- 78/100
- State rank
- #120
- US rank
- #2426
Category grades
Schools grade is shown separately in the Schools card above.
Census & demographics
- City population
- 39,826
- Population (ZIP)
- 10,487
Population outlook (Snohomish County) Hauer SSP2
- Today (2025)
- 899,800 people
- By 2030
- 960,975 · +6.8%
- By 2040
- 1,074,447 · +19.4%
- By 2050
- 1,171,954 · +30.2%
- By 2075
- 1,384,849 · +53.9%
- By 2100
- 1,497,296 · +66.4%
Race, ethnicity, and origin ACS 2023
- Neighborhood character
- Predominantly White (82%)
- Race & ethnicity
- White 82% Two or more races 8% Hispanic / Latino 7% Asian 5%
- Hispanic origin (detail)
- Mexican 5%
- Common ancestry
- Portuguese 9% Slovak 3% Lithuanian 2%
- Foreign-born
- 5% · Canada, Dominican Republic, China
- Languages at home
- 94% English-only · Spanish 2% Other Indo-European 1% Russian/Polish/Slavic 1%
Political lean MEDSL · Snohomish
- 2024 margin
- D (+19.0) · D 57.8% · R 38.9% · Other 3.3%
- 2008→2024 swing
- +0.1pp no change · 2008: 18.9pp · 2024: 19.0pp
- All cycles
- 2024: D+19.0 2020: D+20.6 2016: D+16.6 2012: D+16.2 2008: D+18.9
Not yet ingested
- Civics
- —
Market trends
- HPI YoY
- ▼ -270.47%
- Current HPI
- 300.5366
- Rent YoY
- —
- Metro
- —
- State GDP YoY
- ▲ 4.65%
- F500 in state
- 22
Industry mix (Fortune 500 HQ in WA)
| Industry | F500 HQs | Revenue |
|---|---|---|
| Retail | 2 | $269B |
|
||
| Technology / Retail | 1 | $638B |
|
||
| Technology | 1 | $245B |
|
||
| Telecommunications | 1 | $38B |
|
||
| Food / Beverage | 1 | $36B |
|
||
| Automotive / Trucks | 1 | $34B |
|
||
Price history
+9.9% since first listed12 events — show timeline
- 2026-06-04 Listed $315,000 NWMLS as Distributed by MLS Grid
- 2021-10-08 Sold (MLS) $375,000 NWMLS as Distributed by MLS Grid
- 2021-09-21 Pending — NWMLS as Distributed by MLS Grid
- 2021-09-18 Relisted — NWMLS as Distributed by MLS Grid
- 2021-09-18 Pending — NWMLS as Distributed by MLS Grid
- 2021-09-16 Listed $374,000 NWMLS as Distributed by MLS Grid
- 2003-09-10 Sold (Public Records) $123,000 Public Records
- 2003-09-10 Sold (MLS) $123,000 NWMLS as Distributed by MLS Grid
- 2003-06-17 Listed $125,000 NWMLS as Distributed by MLS Grid
- 1996-06-25 Sold (Public Records) $101,000 Public Records
- 1988-10-05 Sold (Public Records) $190,000 Public Records
- 1984-09-20 Sold (Public Records) $286,541 Public Records
Property tax history
+3.0%/yrLatest (2026): $2,788 · -6.1% YoY. Source: county tax records.
Cash-flow waterfall
monthlySold comps — $/sqft
last 12 mo · ≤1 miLoading sold comps…