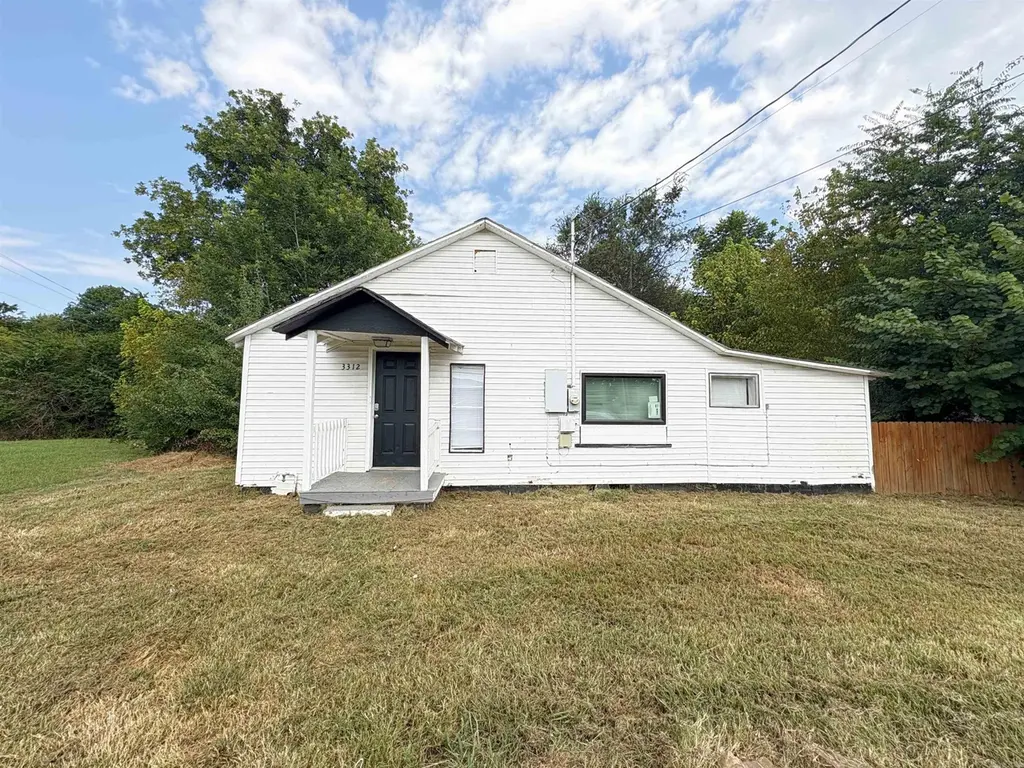
3312.5 Hwy 367 · Austin, AR
Flood risk 1/10 · Minimal
- FEMA flood zone
- X (unshaded)
- Chance of flooding over 30 yrs
- 0.0%
- Est. flood insurance / yr
- $507 – $1,088
Fire risk 4/10 · Minor
- Est. fire insurance / yr
- $1,499 – $2,785
Heat risk 7/10 · Major
- Hot days now (above 109°F)
- 7 days/yr
- Hot days in 30 yrs
- 19 days/yr
Wind risk 3/10 · Minor
- Chance of severe wind over 30 yrs
- 6.0%
Air-quality risk 2/10 · Minimal
- Unhealthy air days now
- 1 days/yr
- Unhealthy air days in 30 yrs
- 1 days/yr
Risk factors via First Street. Map © Google.
Why this score? — see what drove the C grade
The composite is a weighted blend of 9 inputs, each scored 0–100. Each bar is that input's sub-score; the figure is the points it added to the 100-point composite (weight × sub-score).
- Cash flow +25.4/30.0
- DSCR +8.4/10.0
- ARV discount +7.5/15.0
- 1% rule +5.4/10.0
- Schools +4.0/10.0
- Livability +3.7/5.0
- Rent growth +2.5/5.0
- Condition / age +2.5/5.0
- Appreciation +0.0/10.0
$85,000
🖨 Deal sheet 📄 Offer letter ✓ Due diligence
Listing remarks
Great opportunity for a first-time homebuyer or investor! This 2-bedroom, 1-bath home offers approximately 864 square feet and has served as a successful rental property for over 22 years. Conveniently located on Hwy 367 in Austin with easy access to Cabot, Jacksonville, and the interstate, this property offers strong long-term investment potential or affordable homeownership. Features include a functional floor plan, spacious yard, and great visibility/location. Whether you are looking to expand your rental portfolio, purchase your first home, or downsize into something manageable, this property offers plenty of opportunity at an affordable price point. Long rental history makes this an ex
Key facts
- Spacious yard
- Detached
- 4,791 sq ft lot
Tags
Property features AI
Finance
- Financial info: Owner financing possible; Cash purchase accepted; Rural Development financing possible
Exterior
- Utilities: Public sewer; Municipal electric service (Entergy)
- Home design: Frame exterior
- Construction: Crawl space foundation; Architectural shingle roof
- Exterior features: Level lot; Paved road access; Inside city limits
Interior
- Kitchen: Free‑standing stove
- Flooring: Luxury vinyl
- Bathrooms: 1 full bathroom
- Heating & cooling: Window air conditioning units
- Interior features: Washer connection; Electric dryer connection; Smoke detectors; Sheetrock walls/ceilings
- Laundry & utility: Washer connection; Electric dryer connection
Neighborhood map
What this means for you Summary
Snapshot
- This is a 2-bed/1.0-bath single-family listed at $85k.
Deal economics
- At list price, monthly cash flow is $195 ($2k/yr) — positive.
- The deal already cash-flows at list — no discount required.
- Meets the 1% rule at list price ($880 rent vs $85k).
- Recommended offer: $84k (1.5% below list) — sets the bar for market timing.
- Cap rate 9.0% vs local median 3.6% in Austin — top-decile yield for the area; either an underpriced asset or a hidden risk that comps aren't pricing in. Stress-test before assuming the spread holds.
Location & tenants
- Location reads 73/100 on livability (#21 in AR) — a middle-class / working-renter tenant base. Strengths: employment A+, cost of living A+, housing A+; Watch: schools D+, amenities F, commute F.
- Cabot School District (suburban): math 48% / reading 43% proficiency, ranked #29 of 238 in AR (top 12%) — families likely to look elsewhere, expect single-tenant / working-renter base with shorter leases.
- Market conditions: 59 active listings in the ZIP; 7 comparable units currently listed for rent nearby; rentals at typical pace (median 24d on market — plan ~3-4 weeks tenant-placement turnaround); 185 units permitted in Lonoke County in 2024 (0 in 5+ unit buildings).
Forward outlook
- Local home prices are declining (-3.0%/yr); year-one equity from $588 of loan paydown is wiped out by about $3k of value loss. Plan a longer hold.
- Lonoke County population projected at +12% by 2050 — modest demand growth; plan on rents tracking national, not racing it.
Negotiation context
- It's been on market 26 days — a 2% lower offer ($84k) is reasonable based on typical stale-listing flexibility.
- Current owner paid $28k; list at $85k implies a 204% gain — meaningful room to come down on a strong offer.
Risks & watch-outs
- Climate carrying-cost: extreme-heat days projected 7→19/yr by 2055 (HVAC capex compounding) — expect insurance premiums to compound above CPI over the hold.
Questions for the listing agent
- Is there a deadline driving the sale (1031 exchange, divorce, estate, relocation)? That informs how much negotiation room exists.
- Schools are D-rated, which usually means shorter tenancies and higher turnover. Who's the typical renter profile here, and what's been the actual vacancy rate?
- What's the average days-on-market for RENTAL listings here right now (not sales)? A rising rental-DOM trend means longer vacancies and softer asking-rent achievability than the comps imply.
- What's the recent tenant-quality profile in this submarket — average credit score on applications, eviction rate, late-payment / NSF rate, and stable-employment percentage? A property-management company in the area should have these aggregated.
- How much new for-sale + rental construction is in the pipeline within 1–3 miles? Heavy new supply typically softens prices + rents 12–24 months out; constrained supply supports both.
Investment metrics
- 1% rule
- 1.04% ✓
- Cap rate
- 9.04%
- Cash-on-cash
- 9.83%
- DSCR
- 1.44
- GRM
- 8.0
CMA / ARV
No comps found within radius.
Projected returns pro-forma
-3.0% appreciation · 3.0% rent growth · sell at horizon
- IRR
- -1.6%
- Equity multiple
- 0.94×
- Total profit
- $-1,400
- Equity at exit
- $12,674
- IRR
- 8.1%
- Equity multiple
- 1.61×
- Total profit
- $14,603
- Equity at exit
- $7,349
Cash invested: $23,800 (down + closing). Projections, not guarantees.
Landlord ↔ Tenant lean methodology
- Overall (STATE)
- 92 Strongly Landlord-Friendly
- State Arkansas
- 92 Strongly Landlord-Friendly · R+14
- County
- — inherits STATE
- City
- — inherits STATE
ZIP-level market 72007
- Home prices YoY
- -7.9%
- Active inventory
- 59
- Price-to-rent
- 8.0×
Monthly cashflow live
- Estimated rent
- $880 high interval (Pro) →
- Mortgage (P&I)
- −$446
- Tax from tax record
- −$19 /mo · $234/yr
- Insurance
- −$35
- HOA
- −$0
- Vacancy / Maint / Mgmt
- −$185
- Net cashflow
- $195
Break-even live
UW: 25.0% down · 7.5% · 30yr · 1.5% tax · 5.0% vac · 8.0% maint · 8.0% mgmt
Financing live
Cash to close
- Down payment
- $21,250
- Closing costs
- $2,550
- Reserves months
- —
- Total cash needed
- —
Loan-product check · same deal, 3 products live
Conventional
25% down · 7.5% · 30yr
- Down + closing
- —
- Monthly P&I
- —
- Monthly cashflow
- —
- DSCR
- —
- Eligible?
- —
Personal DTI + credit; lowest rate.
DSCR
20% down · 8.5% · 30yr
- Down + closing
- —
- Monthly P&I
- —
- Monthly cashflow
- —
- DSCR
- —
- Eligible?
- —
No personal income docs; deal must DSCR.
Hard money
10% down · 12.0% · 12mo
- Down + closing
- —
- Monthly P&I
- —
- Monthly cashflow
- —
- DSCR
- —
- Eligible?
- —
Short-term bridge; refi at stabilization.
Rent comps 7 comps
| Address | Beds | Baths | Sqft | Rent | $/sqft | DOM | Units | Dist |
|---|---|---|---|---|---|---|---|---|
| 3312 Arkansas 367 Austin, AR | 2.0 | 1.0 | 864 | $795 | $0.92 | 23d | 1 | 0.03mi |
| 3222 Arkansas 367 Unit 367 Austin, AR | 2.0 | 2.0 | 1120 | $895 | $0.80 | 23d | 1 | 0.06mi |
| 205 N 2nd St Austin, AR | 3.0 | 2.0 | 1008 | $1,250 | $1.24 | 23d | 1 | 0.21mi |
| 414 Austin Oaks Dr Austin, AR | 2.0 | 1.0 | 600 | $850 | $1.42 | 19d | 1 | 0.23mi |
| 512 Austin Oaks Dr Unit 512 Austin, AR | 2.0 | 1.0 | 600 | $850 | $1.42 | 21d | 1 | 0.24mi |
| 211 Austin Oaks Dr Unit 211 Austin, AR | 2.0 | 1.0 | 600 | $825 | $1.38 | 14d | 1 | 0.25mi |
| 504 S Pool St Austin, AR | 2.0 | 1.0 | 918 | $750 | $0.82 | 23d | 1 | 0.31mi |
Listing history 17 events
-
2026-06-18days on market $85,000 Active 26 DOM
-
2026-06-17days on market $85,000 Active 25 DOM
-
2026-06-16days on market $85,000 Active 24 DOM
-
2026-06-15days on market $85,000 Active 23 DOM
-
2026-06-14days on market $85,000 Active 21 DOM
-
2026-06-10days on market $85,000 Active 18 DOM
-
2026-06-09days on market $85,000 Active 17 DOM
-
2026-06-08days on market $85,000 Active 16 DOM
-
2026-06-07days on market $85,000 Active 15 DOM
-
2026-06-05days on market $85,000 Active 12 DOM
-
2026-06-03days on market $85,000 Active 11 DOM
-
2026-06-02days on market $85,000 Active 10 DOM
-
2026-06-01days on market $85,000 Active 9 DOM
-
2026-05-31days on market $85,000 Active 8 DOM
-
2026-05-31statusdays on market $85,000 Active 7 DOM
-
2026-05-23$85,000 New Listing
-
2010-12-28soldstatus $28,000
ⓘ Source: listings_history table (triggers on properties + properties_extension) + one-shot
backfill from property_details.listing_events for pre-trigger history.
Tax reassessment forecast AR · Resets to sale price
- Current annual tax
- $234 · $19/mo
- Projected year-2 tax
- $544 · $45/mo
- Expected delta
- +$310/yr (+$26/mo · 132.8%)
ⓘ Screening estimate from a state-policy table — verify with the county assessor before closing.
Climate risk First Street
- Flood 1/10 Low FEMA zone X (unshaded) · 0% chance over 30 yrs
- Wildfire 4/10 Moderate
- Heat 7/10 Severe 7 d/yr ≥109°F today · 19 d/yr by 30 yrs out
- Wind 3/10 Moderate 6% chance of damaging wind over 30 yrs
- Air quality 2/10 Low 1 unhealthy d/yr today · 1 by 30 yrs out
Nearby sold comps map
Loading sold comps map…
Walkable amenities ~0.75 mi
Loading nearby amenities…
Taxation est. · year 1
- Rental income
- $10,565
- − Mortgage interest
- −$4,761
- − Property taxes
- −$234
- − Insurance
- −$425
- − Repairs & maintenance
- −$845
- − Management
- −$845
- − Depreciation
- −$2,473
- Taxable income
- $982
- Est. tax owed @ 24.0%
- −$236
- After-tax cash flow
- $2,103/yr
For passive investors: Depreciation is non-cash, so a rental often shows a tax loss while cash-flowing — sheltering income. Rental losses are passive: they offset passive income freely, and up to $25,000/yr can offset ordinary (W-2) income if you actively participate and your MAGI is under $100k (phasing out to $0 by $150k); unused losses carry forward. On sale, claimed depreciation is recaptured at up to 25%, and gains may owe capital-gains tax (a 1031 exchange can defer both). Figures are a year-1 estimate at your 24.0% rate — not tax advice; consult a CPA.
Schools (NCES district)
- District
- Cabot School District
- NCES district ID
- 0503750
- Math proficiency
- 48% ▼ -14.00%
- Reading proficiency
- 43% ▼ -10.00%
- Median HH income
- $55,993
- Composite
- 39.66/100
- National rank
- #3912
- State rank
- #29 of 238 in AR
Livability — Austin
- Score
- 73/100
- State rank
- #21
- US rank
- #5280
Category grades
Schools grade is shown separately in the Schools card above.
Census & demographics
- Census place
- Austin, AR
- City population
- 9,945
- Population (ZIP)
- 9,945
Population outlook (Lonoke County) Hauer SSP2
- Today (2025)
- 78,072 people
- By 2030
- 80,673 · +3.3%
- By 2040
- 84,977 · +8.8%
- By 2050
- 87,778 · +12.4%
- By 2075
- 91,398 · +17.1%
- By 2100
- 87,858 · +12.5%
Race, ethnicity, and origin ACS 2023
- Neighborhood character
- Predominantly White (90%)
- Race & ethnicity
- White 90% Hispanic / Latino 5% Two or more races 3% Asian 2% Black 1%
- Hispanic origin (detail)
- Mexican 4%
- Common ancestry
- Romanian 3% Italian 1% Portuguese 1%
- Foreign-born
- 1% · Vietnam
- Languages at home
- 96% English-only · Spanish 1% Vietnamese 1%
Political lean MEDSL · Lonoke
- 2024 margin
- Solid R (+53.7) · D 22.2% · R 75.8% · Other 2.0%
- 2008→2024 swing
- -6.2pp toward R · 2008: -47.5pp · 2024: -53.7pp
- All cycles
- 2024: R+53.7 2020: R+52.8 2016: R+53.3 2012: R+50.9 2008: R+47.5
Not yet ingested
- Civics
- —
Market trends
- HPI YoY
- ▼ -16.87%
- Current HPI
- 196.9424
- Rent YoY
- —
- Metro
- —
- State GDP YoY
- ▲ 3.80%
- F500 in state
- 10
Industry mix (Fortune 500 HQ in AR)
| Industry | F500 HQs | Revenue |
|---|---|---|
| Retail | 1 | $681B |
|
||
| Food / Agriculture | 1 | $53B |
|
||
| Retail / Energy | 1 | $22B |
|
||
| Transportation / Logistics | 1 | $12B |
|
||
| Energy | 1 | $4B |
|
||
Price history
+203.6% since first listed2 events — show timeline
- 2026-05-23 Listed $85,000 CARMLS
- 2010-12-28 Sold (Public Records) $28,000 Public Records
Property tax history
+1.6%/yrLatest (2025): $234 · +0.0% YoY. Source: county tax records.
Cash-flow waterfall
monthlySold comps — $/sqft
last 12 mo · ≤1 miLoading sold comps…