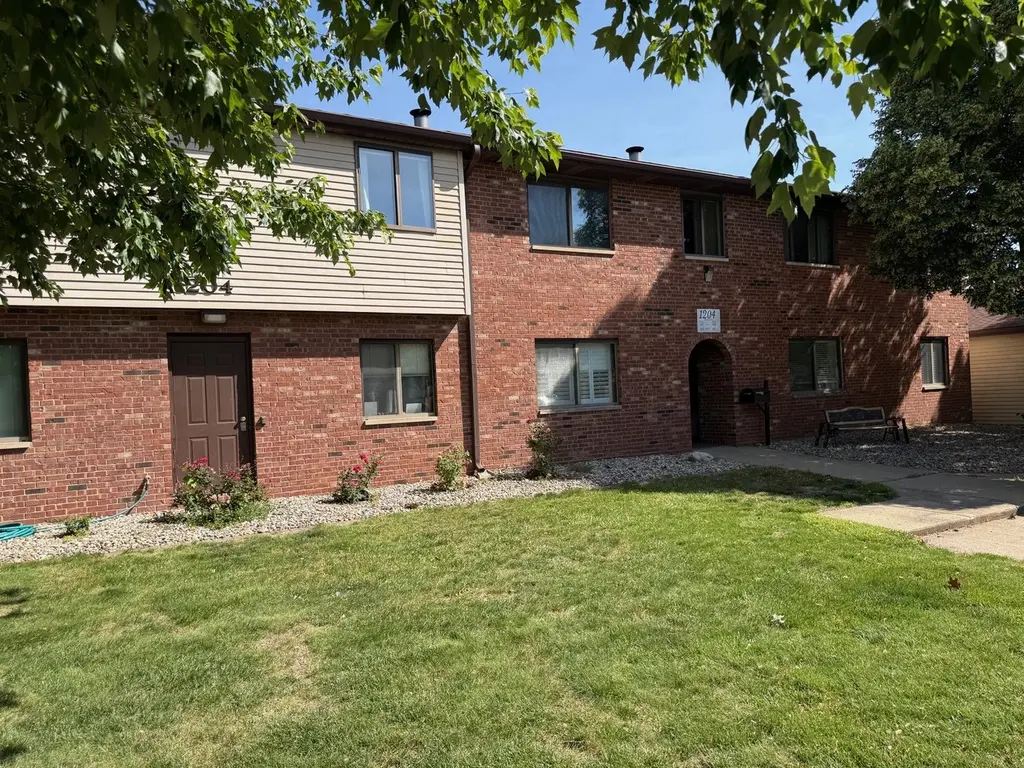
1204 Dean Dr #8 · Urbana, IL
Flood risk 1/10 · Minimal
- FEMA flood zone
- X (unshaded)
- Chance of flooding over 30 yrs
- 0.0%
- Est. flood insurance / yr
- $507 – $1,088
Fire risk 1/10 · Minimal
- Est. fire insurance / yr
- $804 – $1,492
Heat risk 3/10 · Minor
- Hot days now (above 104°F)
- 7 days/yr
- Hot days in 30 yrs
- 19 days/yr
Wind risk 2/10 · Minimal
- Chance of severe wind over 30 yrs
- 1.0%
Air-quality risk 2/10 · Minimal
- Unhealthy air days now
- 1 days/yr
- Unhealthy air days in 30 yrs
- 2 days/yr
Risk factors via First Street. Map © Google.
Why this score? — see what drove the D+ grade
The composite is a weighted blend of 9 inputs, each scored 0–100. Each bar is that input's sub-score; the figure is the points it added to the 100-point composite (weight × sub-score).
- Cash flow +17.1/30.0
- ARV discount +7.5/15.0
- 1% rule +6.4/10.0
- DSCR +5.3/10.0
- Rent growth +5.0/5.0
- Livability +4.0/5.0
- Condition / age +2.5/5.0
- Schools +1.0/10.0
- Appreciation +0.0/10.0
$110,000
🖨 Deal sheet 📄 Offer letter ✓ Due diligence
Listing remarks MLS
2nd-floor unit with a detached garage. 2 Bedrooms and 1.5 bathrooms. All kitchen appliances included.
Key facts
- $155 HOA
- Garage
- Community pool
Property features AI
Finance
- Other: Part of an 8-unit building
- Financial info: Special service area: No
- HOA & community: Monthly association fee of $155; Association includes insurance, clubhouse, exercise facilities, pool, exterior maintenance, lawn care, and snow removal; Pets allowed (cats and dogs) with a maximum pet weight of 30 lbs
Exterior
- Parking: Detached garage (1 garage space, 1 total parking space)
- Utilities: Public water; Public sewer
- Home design: Attached single (condo/duplex); Entry level: 2; Condo ownership
- Construction: Brick construction; Approximately 31–40 years old
- Exterior features: Condo lot/setting
Interior
- Kitchen: Kitchen on the main level
- Bedrooms: Two bedrooms (both on the main level); Master bedroom on the main level with a full bath
- Flooring: Carpet in living room and bedrooms; Luxury vinyl flooring in kitchen and dining room
- Bathrooms: One full bathroom; One half bathroom
- Heating & cooling: Natural gas heating; Central air conditioning
- Interior features: Five total rooms; School bus service; Interstate access
- Laundry & utility: Dedicated laundry room
Neighborhood map
What this means for you Summary
Snapshot
- This is a 2-bed/1.5-bath condo listed at $110k.
Deal economics
- At list price, monthly cash flow is $77 ($921/yr) — positive.
- The deal already cash-flows at list — no discount required.
- Meets the 1% rule at list price ($1k rent vs $110k).
- Cap rate 7.1% vs local median 3.6% in Urbana — top-decile yield for the area; either an underpriced asset or a hidden risk that comps aren't pricing in. Stress-test before assuming the spread holds.
Location & tenants
- Location reads 80/100 on livability (#110 in IL, #1,793 nationally) — a professional / high-income tenant draw. Strengths: amenities A+, commute A+, cost of living A+; Watch: employment D, crime F.
- Urbana SD 116 (urban): math 11% / reading 13% proficiency, ranked #568 of 620 in IL (top 92%) — low school quality limits family demand, transient renter base, plan for 1-2y turnover; 64% free/reduced lunch — lower-income household profile, screen leases tightly.
- Zoned schools: Thomas Paine Elem School (math 5% / reading 5%, grade F, #1,741 of 2,056 statewide, top 93%, 251 students, 0% FRL); Urbana Middle School (math 6% / reading 6%, grade F, #634 of 665 statewide, top 95%, 903 students, 0% FRL); Urbana High School (math 21% / reading 29%, grade F, #247 of 693 statewide, top 36%, 1,220 students, 0% FRL) — zoned schools average 0% FRL vs 64% district-wide (64 pts lower); this property's tenant base skews higher-income than the district average.
- Market conditions: Rents rising fast (+11.8%/yr); 122 active listings in the ZIP; 9 comparable units currently listed for rent nearby; rentals at typical pace (median 21d on market — plan ~3-4 weeks tenant-placement turnaround); 44% of comp listings sitting > 30 days — soft ceiling on asking rent; 573 units permitted in Champaign County in 2024 (359 in 5+ unit buildings).
Forward outlook
- Local home prices are declining (-3.0%/yr); year-one equity from $761 of loan paydown is wiped out by about $3k of value loss. Plan a longer hold.
- Champaign County population projected at +15% by 2050 — modest demand growth; plan on rents tracking national, not racing it.
- At projected returns (-3.0% appreciation + 8.0% rent growth), your $31k cash investment doubles in ~10 years — after that, you're playing with house money.
Negotiation context
- Only 9 days on market — expect competitive offers; lowballing is unlikely to land.
- 5 sale attempts since 17y ago; this cycle's ask is 29% above the opening price — seller raised mid-cycle; expect resistance to lowballs.
- Current owner paid $89k; 24% above their basis — modest negotiation headroom, anchor on the comps not their cost.
Questions for the listing agent
- What does the HOA fee cover, when was the last increase, and are there any pending special assessments or reserve-fund shortfalls?
- Any open or pending special assessments — roof, HVAC, plumbing, elevator, façade? What's the per-unit balance and payoff schedule, and is the seller paying it off at close or rolling it to the buyer?
- Is there a deadline driving the sale (1031 exchange, divorce, estate, relocation)? That informs how much negotiation room exists.
- Schools are D-rated, which usually means shorter tenancies and higher turnover. Who's the typical renter profile here, and what's been the actual vacancy rate?
- Crime grade is F in this area — have there been break-ins, vandalism, or insurance claims at this property in the last 3 years? What carrier currently insures it and at what premium?
- The area grade is low — what's the realistic commute time and amenity access for the typical tenant pool here? Any planned neighborhood developments (good or bad) we should know about?
- What's the average days-on-market for RENTAL listings here right now (not sales)? A rising rental-DOM trend means longer vacancies and softer asking-rent achievability than the comps imply.
- What's the recent tenant-quality profile in this submarket — average credit score on applications, eviction rate, late-payment / NSF rate, and stable-employment percentage? A property-management company in the area should have these aggregated.
- How much new apartment / multifamily construction is in the pipeline within 1–3 miles? Heavy new supply (>2% of stock underway) typically softens rents 12–24 months out; light construction supports rent growth.
Investment metrics
- 1% rule
- 1.14% ✓
- Cap rate
- 7.13%
- Cash-on-cash
- 2.99%
- DSCR
- 1.13
- GRM
- 7.3
CMA / ARV
No comps found within radius.
Projected returns pro-forma
-3.0% appreciation · 8.0% rent growth · sell at horizon
- IRR
- -5.1%
- Equity multiple
- 0.80×
- Total profit
- $-6,188
- Equity at exit
- $16,401
- IRR
- 10.4%
- Equity multiple
- 2.02×
- Total profit
- $31,569
- Equity at exit
- $9,511
Cash invested: $30,800 (down + closing). Projections, not guarantees.
Landlord ↔ Tenant lean methodology
- Overall (STATE)
- 43 Moderately Tenant-Leaning
- State Illinois
- 43 Moderately Tenant-Leaning · D+7
- County
- — inherits STATE
- City
- — inherits STATE
ZIP-level market 61802
- Home prices YoY
- -20.5%
- Rents YoY
- 11.8%
- Active inventory
- 122
- Price-to-rent
- 7.3×
Monthly cashflow live
- Estimated rent
- $1,256 high interval (Pro) →
- Mortgage (P&I)
- −$577
- Tax est. 1.5%
- −$138 /mo · $1,650/yr
- Insurance
- −$46
- HOA
- −$155
- Vacancy / Maint / Mgmt
- −$264
- Net cashflow
- $77
Break-even live
UW: 25.0% down · 7.5% · 30yr · 1.5% tax · 5.0% vac · 8.0% maint · 8.0% mgmt
Financing live
Cash to close
- Down payment
- $27,500
- Closing costs
- $3,300
- Reserves months
- —
- Total cash needed
- —
Loan-product check · same deal, 3 products live
Conventional
25% down · 7.5% · 30yr
- Down + closing
- —
- Monthly P&I
- —
- Monthly cashflow
- —
- DSCR
- —
- Eligible?
- —
Personal DTI + credit; lowest rate.
DSCR
20% down · 8.5% · 30yr
- Down + closing
- —
- Monthly P&I
- —
- Monthly cashflow
- —
- DSCR
- —
- Eligible?
- —
No personal income docs; deal must DSCR.
Hard money
10% down · 12.0% · 12mo
- Down + closing
- —
- Monthly P&I
- —
- Monthly cashflow
- —
- DSCR
- —
- Eligible?
- —
Short-term bridge; refi at stabilization.
Rent comps 9 comps
| Address | Beds | Baths | Sqft | Rent | $/sqft | DOM | Units | Dist |
|---|---|---|---|---|---|---|---|---|
| 1304 Christopher Cir Urbana, IL | 2.0 | 1.0 | 970 | $1,300 | $1.34 | 43d | 1 | 0.15mi |
| 1304 Christopher Cir Urbana, IL | 2.0 | 1.0 | 970 | $1,250 | $1.29 | 21d | 1 | 0.15mi |
| 26 Ivanhoe Dr Urbana, IL | 2.0 | 2.0 | 896 | $935 | $1.04 | 13d | 1 | 0.33mi |
| 1032 E Kerr Ave Urbana, IL | 1.0–2.0 | 1.0–2.0 | 777 | $1,430 | $1.84 | 13d | 46 | 0.54mi |
| 904 N Broadway Ave Urbana, IL | 2.0 | 1.0 | 825 | $972 | $1.18 | 21d | 1 | 1.06mi |
| 3419 County Road 1400 E Unit B Urbana, IL | 2.0 | 1.0 | 750 | $995 | $1.33 | 21d | 1 | 1.34mi |
| 1901 N Lincoln Ave Urbana, IL | 2.0 | 2.0 | 821 | $660 | $0.80 | 43d | 1 | 1.40mi |
| 202 Hartle Ave Unit 2 Urbana, IL | 1.0 | 1.0 | 575 | $790 | $1.37 | 43d | 1 | 1.40mi |
| 506 E Elm St Unit 2 Urbana, IL | 1.0 | 1.0 | 760 | $1,500 | $1.97 | 43d | 1 | 1.44mi |
HOA detail condo
- Monthly dues
- $155 · $1,860/yr
- Assessments
- None detected in remarks — confirm with the listing agent.
Listing history 6 events
-
2026-06-13statusdays on market $110,000 Pending 9 DOM
-
2026-06-10days on market $110,000 Active 8 DOM
-
2026-06-09days on market $110,000 Active 7 DOM
-
2026-06-08days on market $110,000 Active 6 DOM
-
2026-06-07remarks 216-char remark
-
2026-06-07$110,000 Active 5 DOM
ⓘ Source: listings_history table (triggers on properties + properties_extension) + one-shot
backfill from property_details.listing_events for pre-trigger history.
Climate risk First Street
- Flood 1/10 Low FEMA zone X (unshaded) · 0% chance over 30 yrs
- Wildfire 1/10 Low
- Heat 3/10 Moderate 7 d/yr ≥104°F today · 19 d/yr by 30 yrs out
- Wind 2/10 Low 100% chance of damaging wind over 30 yrs
- Air quality 2/10 Low 1 unhealthy d/yr today · 2 by 30 yrs out
Nearby sold comps map
Loading sold comps map…
Walkable amenities ~0.75 mi
Loading nearby amenities…
Taxation est. · year 1
- Rental income
- $15,067
- − Mortgage interest
- −$6,162
- − Property taxes
- −$1,650
- − Insurance
- −$550
- − Repairs & maintenance
- −$1,205
- − Management
- −$1,205
- − HOA
- −$1,860
- − Depreciation
- −$3,200
- Taxable loss
- −$765
- Est. tax savings @ 24.0%
- +$184
- After-tax cash flow
- $1,104/yr
For passive investors: Depreciation is non-cash, so a rental often shows a tax loss while cash-flowing — sheltering income. Rental losses are passive: they offset passive income freely, and up to $25,000/yr can offset ordinary (W-2) income if you actively participate and your MAGI is under $100k (phasing out to $0 by $150k); unused losses carry forward. On sale, claimed depreciation is recaptured at up to 25%, and gains may owe capital-gains tax (a 1031 exchange can defer both). Figures are a year-1 estimate at your 24.0% rate — not tax advice; consult a CPA.
Schools (NCES district)
- District
- Urbana SD 116
- NCES district ID
- 1739960
- Math proficiency
- 11% ▼ -5.00%
- Reading proficiency
- 13% ▼ -7.00%
- Median HH income
- $33,678
- Composite
- 9.72/100
- National rank
- #9830
- State rank
- #568 of 620 in IL
Livability — Urbana
- Score
- 80/100
- State rank
- #110
- US rank
- #1793
Category grades
Schools grade is shown separately in the Schools card above.
Census & demographics
- County
- Champaign County · 182,148 people
- City population
- 48,184
- Metro
- Champaign-Urbana, IL
- Population (ZIP)
- 20,293
- Household income
- $61,620
- Rent vs Own
- Severe rent burden
- 809.0
Population outlook (Champaign County) Hauer SSP2
- Today (2025)
- 223,848 people
- By 2030
- 231,416 · +3.4%
- By 2040
- 244,321 · +9.1%
- By 2050
- 256,432 · +14.6%
- By 2075
- 285,823 · +27.7%
- By 2100
- 296,406 · +32.4%
Race, ethnicity, and origin ACS 2023
- Neighborhood character
- Diverse neighborhood (Simpson 0.58)
- Race & ethnicity
- White 61% Black 18% Hispanic / Latino 11% Asian 7% Two or more races 6%
- Hispanic origin (detail)
- Mexican 7% Puerto Rican 1%
- Common ancestry
- Romanian 3% Lithuanian 2% Italian 1%
- Foreign-born
- 12% · China, Canada, South Korea
- Languages at home
- 83% English-only · Spanish 7% Other Indo-European 2% Chinese 2%
Political lean MEDSL · Champaign
- 2024 margin
- Strong D (+24.1) · D 61.3% · R 37.2% · Other 1.5%
- 2008→2024 swing
- +6.6pp toward D · 2008: 17.5pp · 2024: 24.1pp
- All cycles
- 2024: D+24.1 2020: D+22.8 2016: D+18.4 2012: D+6.8 2008: D+17.5
Not yet ingested
- Civics
- —
Market trends
- HPI YoY
- ▼ -53.21%
- Current HPI
- 206.3079
- Rent YoY
- ▲ 11.85%
- Metro
- Champaign-Urbana, IL
- State GDP YoY
- ▲ 1.59%
- F500 in state
- 60
Industry mix (Fortune 500 HQ in IL)
| Industry | F500 HQs | Revenue |
|---|---|---|
| Insurance | 4 | $201B |
|
||
| Consumer Goods | 4 | $87B |
|
||
| Industrial Machinery | 3 | $64B |
|
||
| Healthcare | 2 | $55B |
|
||
| Retail / Pharmacy | 1 | $148B |
|
||
| Agriculture / Food | 1 | $86B |
|
||
Price history
+11.2% since first listed12 events — show timeline
- 2024-07-09 Sold (MLS) $89,000 MRED as Distributed by MLS Grid
- 2024-06-07 Pending — MRED as Distributed by MLS Grid
- 2024-06-06 Relisted — MRED as Distributed by MLS Grid
- 2024-05-28 Contingent — MRED as Distributed by MLS Grid
- 2024-05-28 Relisted — MRED as Distributed by MLS Grid
- 2024-05-02 Contingent — MRED as Distributed by MLS Grid
- 2024-04-28 Listed $85,000 MRED as Distributed by MLS Grid
- 2010-04-30 Sold (MLS) $77,000 MRED as Distributed by MLS Grid
- 2010-03-30 Listing Removed — MRED as Distributed by MLS Grid
- 2010-02-16 Listed $80,000 MRED as Distributed by MLS Grid
- 2010-02-10 Listing Removed — MRED as Distributed by MLS Grid
- 2009-12-15 Listed — MRED as Distributed by MLS Grid
Cash-flow waterfall
monthlySold comps — $/sqft
last 12 mo · ≤1 miLoading sold comps…