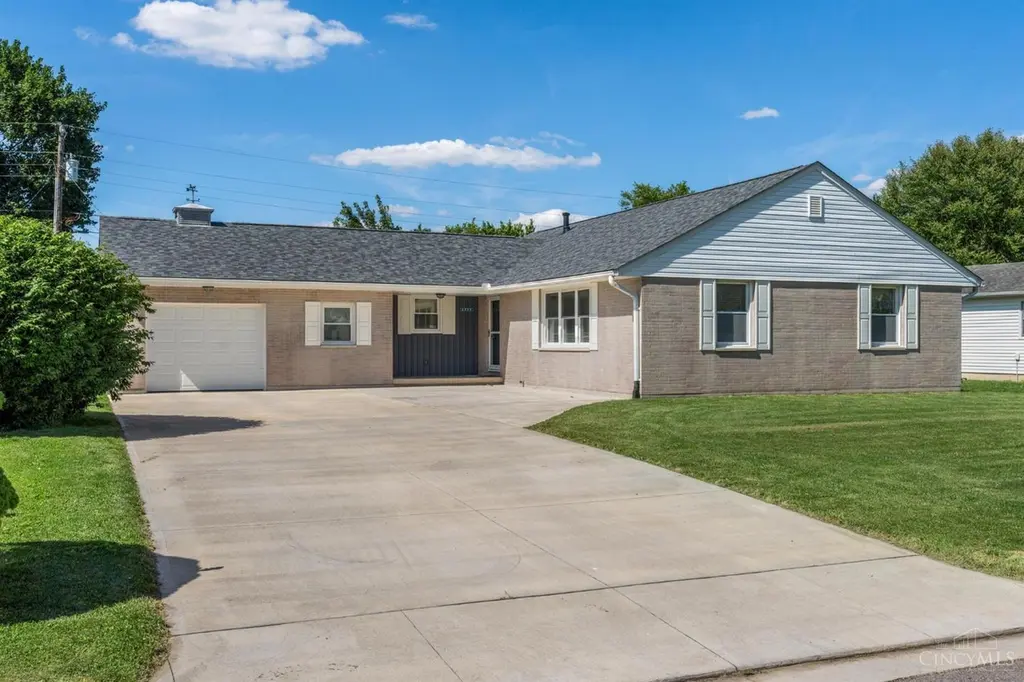
1313 Westmoor Dr · Wilmington, OH
Flood risk 1/10 · Minimal
- FEMA flood zone
- X (unshaded)
- Chance of flooding over 30 yrs
- 0.0%
- Est. flood insurance / yr
- $507 – $1,088
Fire risk 1/10 · Minimal
- Est. fire insurance / yr
- $713 – $1,323
Heat risk 4/10 · Minor
- Hot days now (above 100°F)
- 7 days/yr
- Hot days in 30 yrs
- 19 days/yr
Wind risk 2/10 · Minimal
- Chance of severe wind over 30 yrs
- 1.0%
Air-quality risk 2/10 · Minimal
- Unhealthy air days now
- 1 days/yr
- Unhealthy air days in 30 yrs
- 2 days/yr
Risk factors via First Street. Map © Google.
Why this score? — see what drove the B+ grade
The composite is a weighted blend of 9 inputs, each scored 0–100. Each bar is that input's sub-score; the figure is the points it added to the 100-point composite (weight × sub-score).
- Cash flow +30.0/30.0
- ARV discount +14.3/15.0
- 1% rule +10.0/10.0
- DSCR +10.0/10.0
- Schools +3.9/10.0
- Livability +3.9/5.0
- Rent growth +2.5/5.0
- Condition / age +2.5/5.0
- Appreciation +0.0/10.0
$259,000
🖨 Deal sheet (PDF) 📄 Offer letter ✓ Due diligence
Listing remarks MLS
Discover the perfect combination of comfort, quality, and convenience at 1313 Westmoor Drive. This well-maintained all-brick ranch home is truly move-in ready and showcases numerous updates throughout. Inside you'll find a welcoming formal living room, formal dining room, and a beautifully updated kitchen with breakfast area and included appliances. The home offers 3 bedrooms, 1.5 baths, a laundry room, and 1-car garage. Recent improvements include a new roof, soffits, HVAC, complete kitchen remodel, windows, laminate flooring, carpeting, garage door, fiberglass entry doors, storm doors, lighting, double driveway, and rear patio. With extensive updates already completed, you can simply unpack and enjoy all this home has to offer. A fantastic opportunity for buyers seeking value, style, and peace of mind.
Key facts
- All brick ranch
- Updated kitchen
- Rear patio
Tags
Property features AI
Finance
- Other: Zoned residential; Property access via city street
- HOA & community: No HOA
Exterior
- Parking: Attached front garage (1 car); Driveway parking; On-street parking
- Utilities: Public water; Public sewer; Natural gas
- Home design: Ranch-style single-family home; One level
- Construction: Brick construction; Block foundation; Shingle roof; Built on a crawlspace
- Exterior features: Patio; Porch; Shed on property; Less than 0.5-acre lot (approximately 0.23 acres); Lot dimensions about 80 x 126
Interior
- Kitchen: Eat-in kitchen with wood cabinets; Laminate and vinyl flooring in kitchen
- Bedrooms: 3 bedrooms, all on main level; Primary bedroom approximately 13 x 12; Second bedroom approximately 13 x 11; Third bedroom approximately 12 x 9
- Flooring: Wall-to-wall carpet; Laminate flooring; Vinyl flooring
- Bathrooms: 1 full bathroom on main level; 1 half bathroom on main level
- Appliances: Dishwasher; Microwave; Oven/Range; Refrigerator
- Heating & cooling: Forced air gas heating; Central air conditioning; Water heating: electric and gas
- Interior features: 7 total rooms; Wall-to-wall carpet in the living room; Laminate flooring in dining room and entry/foyer; Vinyl windows; Crawl basement; Home warranty included
- Laundry & utility: Main-level laundry room (about 7 x 6)
Neighborhood map
What this means for you Summary
Snapshot
- This is a 3-bed/1.5-bath single-family listed at $259k.
Deal economics
- At list price, monthly cash flow is $2k ($19k/yr) — positive.
- The deal already cash-flows at list — no discount required.
- Meets the 1% rule at list price ($4k rent vs $259k).
- Recommended offer: $255k (1.5% below list) — sets the bar for market timing.
- Cap rate 13.7% vs local median 6.2% in Wilmington — top-decile yield for the area; either an underpriced asset or a hidden risk that comps aren't pricing in. Stress-test before assuming the spread holds.
Location & tenants
- Location reads 77/100 on livability (#202 in OH, #3,127 nationally) — a middle-class / working-renter tenant base. Strengths: cost of living A+, housing A+, health & safety A+; Watch: schools C-, amenities D, commute F.
- Wilmington City (town): math 42% / reading 51% proficiency, ranked #492 of 656 in OH (top 75%) — families likely to look elsewhere, expect single-tenant / working-renter base with shorter leases.
- Market conditions: 107 active listings in the ZIP; 3 comparable units currently listed for rent nearby; rentals leasing fast (median 3d on market — plan ~1-2 weeks tenant-placement turnaround); 119 units permitted in Clinton County in 2024 (0 in 5+ unit buildings).
- At $4,082/mo this rent would consume 70% of the median local household income ($70k/yr) — very limited rent-growth headroom before tenants either downsize or default.
Forward outlook
- Local home prices are declining (-3.0%/yr); year-one equity from $2k of loan paydown is wiped out by about $8k of value loss. Plan a longer hold.
- Clinton County population projected at -12% by 2050 — secular population decline; favor cash flow + early exit over multi-decade hold.
- At projected returns (-3.0% appreciation + 3.0% rent growth), your $73k cash investment doubles in ~5 years — after that, you're playing with house money.
Negotiation context
- It's been on market 15 days — a 2% lower offer ($255k) is reasonable based on typical stale-listing flexibility.
- 10 sale attempts since 26y ago with the ask held roughly flat each time — persistent listings suggest the price (not the market) is what's stuck; bring a comps-based counter.
- Current owner paid $170k; list at $259k implies a 52% gain — meaningful room to come down on a strong offer.
Questions for the listing agent
- Built in 1961 — when were the roof, HVAC, electrical panel, plumbing, and water heater last replaced?
- Is there a deadline driving the sale (1031 exchange, divorce, estate, relocation)? That informs how much negotiation room exists.
- What's the average days-on-market for RENTAL listings here right now (not sales)? A rising rental-DOM trend means longer vacancies and softer asking-rent achievability than the comps imply.
- What's the recent tenant-quality profile in this submarket — average credit score on applications, eviction rate, late-payment / NSF rate, and stable-employment percentage? A property-management company in the area should have these aggregated.
- How much new for-sale + rental construction is in the pipeline within 1–3 miles? Heavy new supply typically softens prices + rents 12–24 months out; constrained supply supports both.
Investment metrics
- 1% rule
- 1.58% ✓
- Cap rate
- 13.70%
- Cash-on-cash
- 26.46%
- DSCR
- 2.18
- GRM
- 5.3
CMA / ARV
- ARV (on-the-fly)
- $304,836
- Comps found
- 12
Show comp detail 12 sales within ~0.75 mi
| Address | Dist | Beds/Ba | Sqft | Sold | Price | $/sf | Match |
|---|---|---|---|---|---|---|---|
| 97 Glenwood Cir | 0.18mi | 3/1.5 | 1,596 (0%) | 22mo | $250,000 | $157 | 73 |
| 1181 Blue Spruce Ln | 0.46mi | 3/2.0 | 1,500 (-6%) | 1mo | $304,000 | $203 | 66 |
| 1206 Timber Glen Dr | 0.46mi | 3/2.0 | 1,468 (-8%) | 2mo | $292,500 | $199 | 62 |
| 1268 Timber Glen Dr | 0.52mi | 3/2.0 | 1,495 (-6%) | 7mo | $299,900 | $201 | 57 |
| 692 W Truesdell St | 0.55mi | 3/2.0 | 1,558 (-2%) | 23mo | $245,000 | $157 | 49 |
| 365 Maple Ridge Dr | 0.67mi | 3/2.0 | 1,528 (-4%) | 22mo | $225,000 | $147 | 42 |
| 1244 Timber Glen Dr | 0.49mi | 3/2.0 | 1,416 (-11%) | 18mo | $269,900 | $191 | 41 |
| 434 Randolph St | 0.63mi | 3/3.0 | 1,472 (-8%) | 15mo | $227,500 | $155 | 40 |
| 1300 Blue Spruce Ln | 0.57mi | 4/3.0 (+1) | 1,797 (+13%) | 14mo | $426,244 | $237 | 30 |
| 641 Norman St | 0.65mi | 3/2.0 | 1,800 (+13%) | 21mo | $204,500 | $114 | 29 |
| 432 Red Maple Ln | 0.64mi | 4/3.0 (+1) | 1,802 (+13%) | 12mo | $449,940 | $250 | 27 |
| 719 Bernice St | 0.71mi | 2/1.0 (-1) | 1,440 (-10%) | 22mo | $120,000 | $83 | 26 |
Match score weights: distance 35% · size 25% · config 20% · recency 20%. Top-matched comps best support the ARV.
Projected returns pro-forma
-3.0% appreciation · 3.0% rent growth · sell at horizon
- IRR
- 20.3%
- Equity multiple
- 1.83×
- Total profit
- $59,833
- Equity at exit
- $38,618
- IRR
- 28.5%
- Equity multiple
- 3.52×
- Total profit
- $183,079
- Equity at exit
- $22,394
Cash invested: $72,520 (down + closing). Projections, not guarantees.
Landlord ↔ Tenant lean methodology
- Overall (STATE)
- 73 Landlord-Friendly
- State Ohio
- 73 Landlord-Friendly · R+6
- County
- — inherits STATE
- City
- — inherits STATE
ZIP-level market 45177
- Active inventory
- 107
- Price-to-rent
- 5.3×
Monthly cashflow live
- Estimated rent
- $4,082 medium interval (Pro) →
- Mortgage (P&I)
- −$1,358
- Tax from tax record
- −$160 /mo · $1,920/yr
- Insurance
- −$108
- HOA
- −$0
- Vacancy / Maint / Mgmt
- −$857
- Net cashflow
- $1,599
Break-even live
Sensitivity live
| Price | -10% $1,746 | -5% $1,672 | +0% $1,599 | +5% $1,526 | +10% $1,452 |
|---|---|---|---|---|---|
| Rent | -10% $1,276 | -5% $1,438 | +0% $1,599 | +5% $1,760 | +10% $1,922 |
| Rate | -1.0pp $1,729 | -0.5pp $1,665 | base $1,599 | +0.5pp $1,532 | +1.0pp $1,464 |
UW: 25.0% down · 7.5% · 30yr · 1.5% tax · 5.0% vac · 8.0% maint · 8.0% mgmt
Financing live
Cash to close
- Down payment
- $64,750
- Closing costs
- $7,770
- Reserves months
- —
- Total cash needed
- —
Loan-product check · same deal, 3 products live
Conventional
25% down · 7.5% · 30yr
- Down + closing
- —
- Monthly P&I
- —
- Monthly cashflow
- —
- DSCR
- —
- Eligible?
- —
Personal DTI + credit; lowest rate.
DSCR
20% down · 8.5% · 30yr
- Down + closing
- —
- Monthly P&I
- —
- Monthly cashflow
- —
- DSCR
- —
- Eligible?
- —
No personal income docs; deal must DSCR.
Hard money
10% down · 12.0% · 12mo
- Down + closing
- —
- Monthly P&I
- —
- Monthly cashflow
- —
- DSCR
- —
- Eligible?
- —
Short-term bridge; refi at stabilization.
Rent comps 3 comps
| Address | Beds | Baths | Sqft | Rent | $/sqft | DOM | Units | Dist |
|---|---|---|---|---|---|---|---|---|
| 109 Southwind Blvd Wilmington, OH | 3.0 | 2.0 | 1344 | $4,995 | $3.72 | 3d | 1 | 1.22mi |
| 121 Southwind Blvd Wilmington, OH | 3.0 | 2.0 | 1344 | $4,995 | $3.72 | 3d | 1 | 1.22mi |
| 229 Taylor Dr Wilmington, OH | 3.0 | 2.0 | 1242 | $2,000 | $1.61 | 11d | 1 | 1.29mi |
Listing history 12 events
-
2026-06-18days on market $259,000 Active 15 DOM
-
2026-06-17days on market $259,000 Active 14 DOM
-
2026-06-16days on market $259,000 Active 13 DOM
-
2026-06-15days on market $259,000 Active 12 DOM
-
2026-06-14days on market $259,000 Active 10 DOM
-
2026-06-10days on market $259,000 Active 7 DOM
-
2026-06-09days on market $259,000 Active 6 DOM
-
2026-06-09status $259,000 Active 5 DOM
-
2026-06-08days on market $259,000 Contingency Pending 5 DOM
-
2026-06-07days on market $259,000 Contingency Pending 4 DOM
-
2026-06-05remarks 699-char remark
Show marketing remark (815 chars)
Discover the perfect combination of comfort, quality, and convenience at 1313 Westmoor Drive. This well-maintained all-brick ranch home is truly move-in ready and showcases numerous updates throughout. Inside you'll find a welcoming formal living room, formal dining room, and a beautifully updated kitchen with breakfast area and included appliances. The home offers 3 bedrooms, 1.5 baths, a laundry room, and 1-car garage. Recent improvements include a new roof, soffits, HVAC, complete kitchen remodel, windows, laminate flooring, carpeting, garage door, fiberglass entry doors, storm doors, lighting, double driveway, and rear patio. With extensive updates already completed, you can simply unpack and enjoy all this home has to offer. A fantastic opportunity for buyers seeking value, style, and peace of mind.
-
2026-06-05$259,000 Contingency Pending 1 DOM
Show marketing remark (815 chars)
Discover the perfect combination of comfort, quality, and convenience at 1313 Westmoor Drive. This well-maintained all-brick ranch home is truly move-in ready and showcases numerous updates throughout. Inside you'll find a welcoming formal living room, formal dining room, and a beautifully updated kitchen with breakfast area and included appliances. The home offers 3 bedrooms, 1.5 baths, a laundry room, and 1-car garage. Recent improvements include a new roof, soffits, HVAC, complete kitchen remodel, windows, laminate flooring, carpeting, garage door, fiberglass entry doors, storm doors, lighting, double driveway, and rear patio. With extensive updates already completed, you can simply unpack and enjoy all this home has to offer. A fantastic opportunity for buyers seeking value, style, and peace of mind.
ⓘ Source: listings_history table (triggers on properties + properties_extension) + one-shot
backfill from property_details.listing_events for pre-trigger history.
Tax reassessment forecast OH · Partial reset (capped growth)
- Current annual tax
- $1,920 · $160/mo
- Projected year-2 tax
- $2,980 · $248/mo
- Expected delta
- +$1,060/yr (+$88/mo · 55.2%)
ⓘ Screening estimate from a state-policy table — verify with the county assessor before closing.
Climate risk First Street
- Flood 1/10 Low FEMA zone X (unshaded) · 0% chance over 30 yrs
- Wildfire 1/10 Low
- Heat 4/10 Moderate 7 d/yr ≥100°F today · 19 d/yr by 30 yrs out
- Wind 2/10 Low 100% chance of damaging wind over 30 yrs
- Air quality 2/10 Low 1 unhealthy d/yr today · 2 by 30 yrs out
Nearby sold comps map
Loading sold comps map…
Walkable amenities ~0.75 mi
Loading nearby amenities…
Taxation est. · year 1
- Rental income
- $48,989
- − Mortgage interest
- −$14,508
- − Property taxes
- −$1,920
- − Insurance
- −$1,295
- − Repairs & maintenance
- −$3,919
- − Management
- −$3,919
- − Depreciation
- −$7,535
- Taxable income
- $15,894
- Est. tax owed @ 24.0%
- −$3,814
- After-tax cash flow
- $15,373/yr
For passive investors: Depreciation is non-cash, so a rental often shows a tax loss while cash-flowing — sheltering income. Rental losses are passive: they offset passive income freely, and up to $25,000/yr can offset ordinary (W-2) income if you actively participate and your MAGI is under $100k (phasing out to $0 by $150k); unused losses carry forward. On sale, claimed depreciation is recaptured at up to 25%, and gains may owe capital-gains tax (a 1031 exchange can defer both). Figures are a year-1 estimate at your 24.0% rate — not tax advice; consult a CPA.
Schools (NCES district)
- District
- Wilmington City
- NCES district ID
- 3904511
- Math proficiency
- 42% ▼ -16.00%
- Reading proficiency
- 51% ▼ -6.00%
- Median HH income
- $43,201
- Composite
- 39.2/100
- National rank
- #4020
- State rank
- #492 of 656 in OH
Livability — Wilmington
- Score
- 77/100
- State rank
- #202
- US rank
- #3127
Category grades
Schools grade is shown separately in the Schools card above.
Census & demographics
- Census place
- Wilmington, OH
- County
- Clinton · 46,911 people
- Population (ZIP)
- 22,442
- Household income
- $70,483
- Rent vs Own
- Severe rent burden
- 9.5
Population outlook (Clinton County) Hauer SSP2
- Today (2025)
- 41,352 people
- By 2030
- 40,831 · -1.3%
- By 2040
- 39,049 · -5.6%
- By 2050
- 36,408 · -12.0%
- By 2075
- 29,652 · -28.3%
- By 2100
- 20,736 · -49.9%
Race, ethnicity, and origin ACS 2023
- Neighborhood character
- Predominantly White (91%)
- Race & ethnicity
- White 91% Two or more races 3% Black 3% Hispanic / Latino 2% Asian 1%
- Common ancestry
- Lithuanian 2% Slovak 2% Romanian 2%
- Foreign-born
- 3% · Canada, Jamaica
- Languages at home
- 97% English-only · Spanish 1% Other Asian/Pacific 1%
Political lean MEDSL · Clinton
- 2024 margin
- Solid R (+54.6) · D 22.3% · R 76.9%
- 2008→2024 swing
- -24.3pp toward R · 2008: -30.3pp · 2024: -54.6pp
- All cycles
- 2024: R+54.6 2020: R+52.6 2016: R+52.6 2012: R+35.2 2008: R+30.3
Not yet ingested
- Civics
- —
Market trends
- HPI YoY
- ▼ -150.35%
- Current HPI
- 238.9182
- Rent YoY
- —
- Metro
- —
- State GDP YoY
- ▲ 1.98%
- F500 in state
- 48
Industry mix (Fortune 500 HQ in OH)
| Industry | F500 HQs | Revenue |
|---|---|---|
| Insurance | 3 | $145B |
|
||
| Industrial Machinery | 3 | $49B |
|
||
| Financial Services | 3 | $24B |
|
||
| Consumer Goods | 2 | $93B |
|
||
| Aerospace / Defense | 2 | $47B |
|
||
| Utilities | 2 | $33B |
|
||
Price history
+189.4% since first listed27 events — show timeline
- 2026-06-05 Pending — Dayton MLS
- 2026-06-05 Contingent — Cincy MLS
- 2026-06-03 Listed $259,000 Cincy MLS
- 2026-06-03 Listed $259,000 Dayton MLS
- 2025-02-02 Listing Removed — Dayton MLS
- 2025-02-02 Listing Removed — Cincy MLS
- 2024-11-02 Listed $249,000 Dayton MLS
- 2024-11-02 Listed $249,000 Cincy MLS
- 2024-11-01 Listing Removed — Dayton MLS
- 2024-10-30 Listing Removed — Cincy MLS
- 2024-10-18 Contingent — Cincy MLS
- 2024-09-23 Listing Removed — Cincy MLS
- 2024-09-23 Listed $225,000 Cincy MLS
- 2024-09-23 Listed $225,000 Dayton MLS
- 2024-09-11 Price Changed $232,000 Cincy MLS
- 2024-07-15 Listed $235,000 Cincy MLS
- 2023-09-13 Price Changed $170,000 Cincy MLS
- 2022-10-17 Sold (MLS) $170,000 Cincy MLS
- 2022-09-12 Contingent — Cincy MLS
- 2022-09-11 Price Changed $189,900 Cincy MLS
- 2022-08-25 Relisted — Cincy MLS
- 2022-08-20 Contingent — Cincy MLS
- 2022-08-17 Price Changed $189,900 Cincy MLS
- 2022-07-30 Listed $199,900 Cincy MLS
- 2000-04-04 Sold (Public Records) $92,500 Public Records
- 2000-03-28 Sold (MLS) $92,500 Cincy MLS
- 2000-01-21 Listed $89,500 Cincy MLS
Property tax history
+5.0%/yrLatest (2025): $1,920 · -1.5% YoY. Source: county tax records.
Cash-flow waterfall
monthlySold comps — $/sqft
last 12 mo · ≤1 miLoading sold comps…