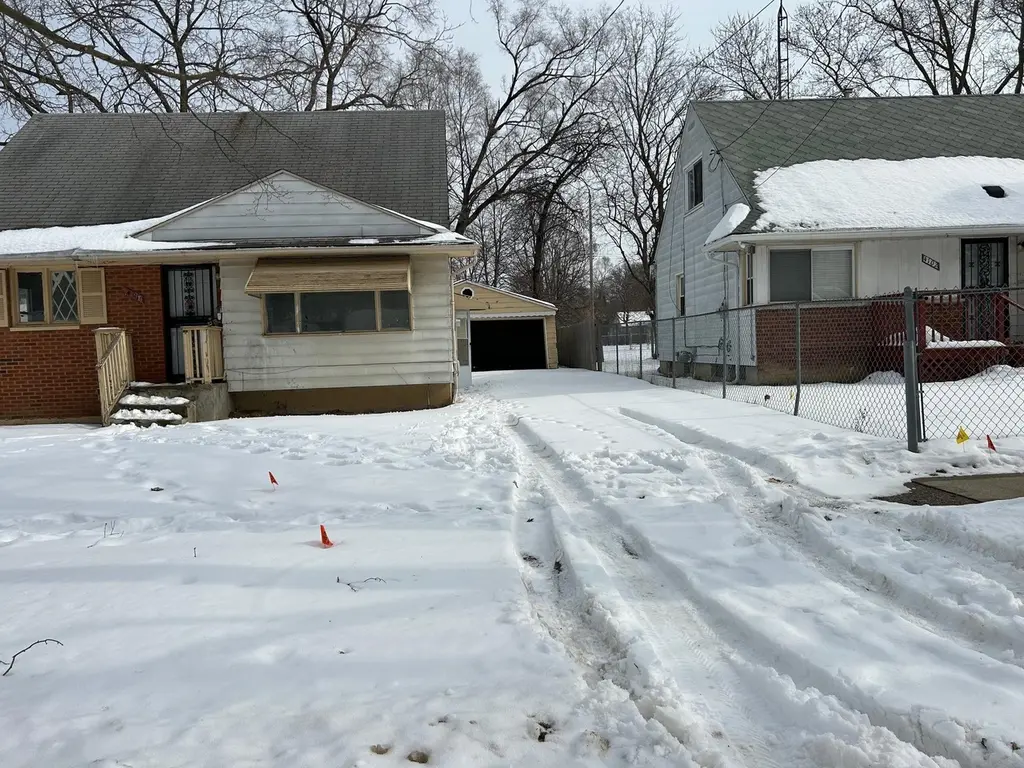
4110 Leerda St · Flint, MI
Flood risk 1/10 · Minimal
- FEMA flood zone
- X (unshaded)
- Chance of flooding over 30 yrs
- 0.0%
- Est. flood insurance / yr
- $507 – $1,088
Fire risk 1/10 · Minimal
- Est. fire insurance / yr
- $784 – $1,456
Heat risk 2/10 · Minimal
- Hot days now (above 96°F)
- 7 days/yr
- Hot days in 30 yrs
- 15 days/yr
Wind risk 2/10 · Minimal
- Chance of severe wind over 30 yrs
- —
Air-quality risk 2/10 · Minimal
- Unhealthy air days now
- 1 days/yr
- Unhealthy air days in 30 yrs
- 3 days/yr
Risk factors via First Street. Map © Google.
Why this score? — see what drove the C+ grade
The composite is a weighted blend of 9 inputs, each scored 0–100. Each bar is that input's sub-score; the figure is the points it added to the 100-point composite (weight × sub-score).
- Cash flow +30.0/30.0
- 1% rule +10.0/10.0
- DSCR +10.0/10.0
- ARV discount +5.0/15.0
- Livability +3.7/5.0
- Rent growth +2.5/5.0
- Condition / age +2.5/5.0
- Schools +1.1/10.0
- Appreciation +0.0/10.0
$39,900
🖨 Deal sheet (PDF) 📄 Offer letter ✓ Due diligence
Listing remarks MLS
Priced to Sell. Make an Offer!
Key facts
- 5,227 sq ft lot
- Garage
- Built 1959
Property features AI
Finance
- HOA & community: Homeowners association present
Exterior
- Parking: Detached 1-car garage
- Utilities: Public water service; Public sewer available
- Home design: Single-family residence; One-level home
- Construction: Aluminum siding and brick construction
- Exterior features: Aluminum siding and brick exterior; Public water; Public sewer
Interior
- Bedrooms: Total of 3 rooms (includes bedrooms and living areas)
- Bathrooms: 1 full bathroom
- Heating & cooling: Forced air heating; Natural gas heating; No central cooling
- Interior features: Concrete basement
Neighborhood map
What this means for you Summary
Snapshot
- This is a 3-bed/1.0-bath single-family listed at $40k.
Deal economics
- At list price, monthly cash flow is $419 ($5k/yr) — positive.
- The deal already cash-flows at list — no discount required.
- Meets the 1% rule at list price ($920 rent vs $40k).
- Recommended offer: $38k (6.0% below list) — sets the bar for market timing.
- Cap rate 18.9% vs local median 11.5% in Flint — top-decile yield for the area; either an underpriced asset or a hidden risk that comps aren't pricing in. Stress-test before assuming the spread holds.
Location & tenants
- Location reads 74/100 on livability (#196 in MI, #4,946 nationally) — a middle-class / working-renter tenant base. Strengths: commute A+, cost of living A+, housing A+; Watch: schools F, crime F, employment F.
- Flint School District (urban): math 7% / reading 13% proficiency, ranked #714 of 760 in MI (top 94%) — low school quality limits family demand, transient renter base, plan for 1-2y turnover; 83% free/reduced lunch — lower-income household profile, screen leases tightly.
- Market conditions: 131 active listings in the ZIP; 14 comparable units currently listed for rent nearby; rentals lingering (median 45d on market — plan ~5-8 weeks vacancy on turnover, expect pricing pressure); 50% of comp listings sitting > 30 days — soft ceiling on asking rent; 419 units permitted in Genesee County in 2024 (68 in 5+ unit buildings).
Forward outlook
- Local home prices are declining (-3.0%/yr); year-one equity from $276 of loan paydown is wiped out by about $1k of value loss. Plan a longer hold.
- Genesee County population projected at -27% by 2050 — secular population decline; favor cash flow + early exit over multi-decade hold.
- At projected returns (-3.0% appreciation + 3.0% rent growth), your $11k cash investment doubles in ~3 years — after that, you're playing with house money.
Negotiation context
- It's been on market 79 days — a 6% lower offer ($38k) is reasonable based on typical stale-listing flexibility.
- 2 sale attempts; this cycle's ask has dropped $3k (6%) from the opening price — seller is motivated, your offer sets the floor, not the list.
- Current owner paid $13k; list at $40k implies a 206% gain — meaningful room to come down on a strong offer.
Risks & watch-outs
- Watch-outs: built in 1959 — expect roof / HVAC / electrical / plumbing capex.
Questions for the listing agent
- It's been on market 79 days. Have you received any prior offers? Is the seller open to a 6% concession, seller financing, or rate buy-down credit?
- Built in 1959 — when were the roof, HVAC, electrical panel, plumbing, and water heater last replaced?
- Why hasn't it sold? Are there any deal-killer items the seller is aware of (foundation, flood, title, zoning, code violations)?
- Is there a deadline driving the sale (1031 exchange, divorce, estate, relocation)? That informs how much negotiation room exists.
- Schools are F-rated, which usually means shorter tenancies and higher turnover. Who's the typical renter profile here, and what's been the actual vacancy rate?
- Crime grade is F in this area — have there been break-ins, vandalism, or insurance claims at this property in the last 3 years? What carrier currently insures it and at what premium?
- What's the average days-on-market for RENTAL listings here right now (not sales)? A rising rental-DOM trend means longer vacancies and softer asking-rent achievability than the comps imply.
- What's the recent tenant-quality profile in this submarket — average credit score on applications, eviction rate, late-payment / NSF rate, and stable-employment percentage? A property-management company in the area should have these aggregated.
- How much new for-sale + rental construction is in the pipeline within 1–3 miles? Heavy new supply typically softens prices + rents 12–24 months out; constrained supply supports both.
Investment metrics
- 1% rule
- 2.31% ✓
- Cap rate
- 18.88%
- Cash-on-cash
- 44.95%
- DSCR
- 3.00
- GRM
- 3.6
CMA / ARV
- ARV (on-the-fly)
- $37,836
- Comps found
- 12
Show comp detail 12 sales within ~0.75 mi
| Address | Dist | Beds/Ba | Sqft | Sold | Price | $/sf | Match |
|---|---|---|---|---|---|---|---|
| 3819 Brownell Blvd | 0.20mi | 3/1.0 | 1,137 (+8%) | 5mo | $69,900 | $61 | 73 |
| 4702 Warrington Dr | 0.41mi | 3/1.0 | 1,010 (-4%) | 3mo | $82,900 | $82 | 72 |
| 1705 W Pasadena Ave | 0.39mi | 3/1.5 | 1,008 (-4%) | 7mo | $9,000 | $9 | 68 |
| 1818 Parkfront Dr | 0.44mi | 3/1.0 | 972 (-8%) | 4mo | $63,000 | $65 | 64 |
| 2118 Santa Barbara Dr | 0.34mi | 3/1.0 | 950 (-10%) | 5mo | $21,000 | $22 | 64 |
| 3419 Leerda St | 0.33mi | 3/1.0 | 938 (-11%) | 4mo | $25,500 | $27 | 63 |
| 4310 Berger Dr | 0.34mi | 3/1.0 | 905 (-14%) | 2mo | $33,000 | $36 | 60 |
| 3330 Maywood Dr | 0.55mi | 3/1.0 | 1,120 (+7%) | 5mo | $14,000 | $13 | 59 |
| 3509 Donnelly St | 0.52mi | 3/1.0 | 983 (-6%) | 8mo | $7,300 | $7 | 58 |
| 2210 Canniff St | 0.39mi | 3/1.5 | 905 (-14%) | 1mo | $83,000 | $92 | 56 |
| 4006 Donnelly St | 0.46mi | 2/1.0 (-1) | 912 (-13%) | 6mo | $13,000 | $14 | 46 |
| 3418 Keyes St | 0.60mi | 2/1.0 (-1) | 900 (-14%) | 7mo | $69,000 | $77 | 37 |
Match score weights: distance 35% · size 25% · config 20% · recency 20%. Top-matched comps best support the ARV.
Projected returns pro-forma
-3.0% appreciation · 3.0% rent growth · sell at horizon
- IRR
- 42.1%
- Equity multiple
- 2.81×
- Total profit
- $20,224
- Equity at exit
- $5,949
- IRR
- 48.2%
- Equity multiple
- 5.66×
- Total profit
- $52,073
- Equity at exit
- $3,450
Cash invested: $11,172 (down + closing). Projections, not guarantees.
Landlord ↔ Tenant lean methodology
- Overall (STATE)
- 62 Landlord-Friendly
- State Michigan
- 62 Landlord-Friendly · EVEN
- County
- — inherits STATE
- City
- — inherits STATE
ZIP-level market 48504
- Active inventory
- 131
- Price-to-rent
- 3.6×
Monthly cashflow live
- Estimated rent
- $920 high interval (Pro) →
- Mortgage (P&I)
- −$209
- Tax from tax record
- −$82 /mo · $989/yr
- Insurance
- −$17
- HOA
- −$0
- Vacancy / Maint / Mgmt
- −$193
- Net cashflow
- $419
Break-even live
Sensitivity live
| Price | -10% $441 | -5% $430 | +0% $419 | +5% $407 | +10% $396 |
|---|---|---|---|---|---|
| Rent | -10% $346 | -5% $382 | +0% $419 | +5% $455 | +10% $491 |
| Rate | -1.0pp $439 | -0.5pp $429 | base $419 | +0.5pp $408 | +1.0pp $398 |
UW: 25.0% down · 7.5% · 30yr · 1.5% tax · 5.0% vac · 8.0% maint · 8.0% mgmt
Financing live
Cash to close
- Down payment
- $9,975
- Closing costs
- $1,197
- Reserves months
- —
- Total cash needed
- —
Loan-product check · same deal, 3 products live
Conventional
25% down · 7.5% · 30yr
- Down + closing
- —
- Monthly P&I
- —
- Monthly cashflow
- —
- DSCR
- —
- Eligible?
- —
Personal DTI + credit; lowest rate.
DSCR
20% down · 8.5% · 30yr
- Down + closing
- —
- Monthly P&I
- —
- Monthly cashflow
- —
- DSCR
- —
- Eligible?
- —
No personal income docs; deal must DSCR.
Hard money
10% down · 12.0% · 12mo
- Down + closing
- —
- Monthly P&I
- —
- Monthly cashflow
- —
- DSCR
- —
- Eligible?
- —
Short-term bridge; refi at stabilization.
Rent comps 14 comps
| Address | Beds | Baths | Sqft | Rent | $/sqft | DOM | Units | Dist |
|---|---|---|---|---|---|---|---|---|
| 3221 Burgess St Flint, MI | 2.0 | 1.0 | 755 | $875 | $1.16 | 21d | 1 | 0.48mi |
| 711 W Dewey St Flint, MI | 3.0 | 1.0 | 1011 | $925 | $0.91 | 21d | 1 | 0.72mi |
| 5413 DuPont St Flint, MI | 4.0 | 1.5 | 1038 | $900 | $0.87 | 21d | 1 | 0.94mi |
| 411 W Marengo Ave Flint, MI | 3.0 | 1.0 | 1350 | $1,072 | $0.79 | 14d | 1 | 0.95mi |
| 5905 Griggs Dr Flint, MI | 3.0 | 1.0 | 940 | $1,000 | $1.06 | 14d | 1 | 1.00mi |
| 5813 Edwards Ave Flint, MI | 3.0 | 1.0 | 1500 | $899 | $0.60 | 14d | 1 | 1.09mi |
| 2462 Gena Ann Ln Unit GEN2462 Flint, MI | 3.0 | 2.0 | 960 | $895 | $0.93 | 44d | 1 | 1.23mi |
| 3376 Preston Pl Unit PRE3376 Flint, MI | 3.0 | 2.0 | 960 | $895 | $0.93 | 44d | 1 | 1.24mi |
| 100 Rosewood Mnr Flint, MI | 2.0 | 1.5 | 1159 | $947 | $0.82 | 14d | 1 | 1.26mi |
| 2410 Gena Ann Ln Unit GEN2410 Flint, MI | 3.0 | 2.0 | 960 | $895 | $0.93 | 44d | 1 | 1.29mi |
| 2410 Gena Ann Ln Flint, MI | 3.0 | 2.0 | 960 | $895 | $0.93 | 45d | 1 | 1.29mi |
| 2419 Gena Ann Ln Unit GEN2419 Flint, MI | 3.0 | 2.0 | 960 | $895 | $0.93 | 44d | 1 | 1.30mi |
| 3616 Concord St Unit CON3616 Flint, MI | 3.0 | 2.0 | 960 | $895 | $0.93 | 44d | 1 | 1.49mi |
| 2332 Fredonia Ave Unit FRE2332 Flint, MI | 3.0 | 2.0 | 960 | $895 | $0.93 | 44d | 1 | 1.49mi |
Listing history 21 events
-
2026-06-18days on market $39,900 Active 79 DOM
-
2026-06-17days on market $39,900 Active 78 DOM
-
2026-06-16days on market $39,900 Active 77 DOM
-
2026-06-15days on market $39,900 Active 76 DOM
-
2026-06-14days on market $39,900 Active 74 DOM
-
2026-06-13days on market $39,900 Active 73 DOM
-
2026-06-10days on market $39,900 Active 71 DOM
-
2026-06-09days on market $39,900 Active 70 DOM
-
2026-06-08days on market $39,900 Active 69 DOM
-
2026-06-07days on market $39,900 Active 68 DOM
-
2026-06-05days on market $39,900 Active 65 DOM
-
2026-06-03days on market $39,900 Active 64 DOM
-
2026-06-02days on market $39,900 Active 63 DOM
-
2026-06-01days on market $39,900 Active 62 DOM
-
2026-05-31days on market $39,900 Active 61 DOM
-
2026-05-30days on market $39,900 Active 60 DOM
-
2026-04-09price $39,900 30-char remark
Show marketing remark (30 chars)
Priced to Sell. Make an Offer!
-
2026-04-08price $39,900
-
2026-03-31$42,500 Active 30-char remark
Show marketing remark (30 chars)
Priced to Sell. Make an Offer!
-
2026-03-31$42,500 Active
Show marketing remark (30 chars)
Priced to Sell. Make an Offer!
-
2003-02-11soldstatus $13,038
ⓘ Source: listings_history table (triggers on properties + properties_extension) + one-shot
backfill from property_details.listing_events for pre-trigger history.
Tax reassessment forecast MI · Partial reset (capped growth)
- Current annual tax
- $989 · $82/mo
- Projected year-2 tax
- $989 · $82/mo
- Expected delta
- $0/yr ($0/mo · 0.0%)
ⓘ Screening estimate from a state-policy table — verify with the county assessor before closing.
Climate risk First Street
- Flood 1/10 Low FEMA zone X (unshaded) · 0% chance over 30 yrs
- Wildfire 1/10 Low
- Heat 2/10 Low 7 d/yr ≥96°F today · 15 d/yr by 30 yrs out
- Wind 2/10 Low
- Air quality 2/10 Low 1 unhealthy d/yr today · 3 by 30 yrs out
Nearby sold comps map
Loading sold comps map…
Walkable amenities ~0.75 mi
Loading nearby amenities…
Taxation est. · year 1
- Rental income
- $11,040
- − Mortgage interest
- −$2,235
- − Property taxes
- −$989
- − Insurance
- −$200
- − Repairs & maintenance
- −$883
- − Management
- −$883
- − Depreciation
- −$1,161
- Taxable income
- $4,689
- Est. tax owed @ 24.0%
- −$1,125
- After-tax cash flow
- $3,897/yr
For passive investors: Depreciation is non-cash, so a rental often shows a tax loss while cash-flowing — sheltering income. Rental losses are passive: they offset passive income freely, and up to $25,000/yr can offset ordinary (W-2) income if you actively participate and your MAGI is under $100k (phasing out to $0 by $150k); unused losses carry forward. On sale, claimed depreciation is recaptured at up to 25%, and gains may owe capital-gains tax (a 1031 exchange can defer both). Figures are a year-1 estimate at your 24.0% rate — not tax advice; consult a CPA.
Schools (NCES district)
- District
- Flint School District
- NCES district ID
- 2614520
- Math proficiency
- 7% ▬ 0.00%
- Reading proficiency
- 13% ▲ 3.00%
- Median HH income
- $25,954
- Composite
- 10.97/100
- National rank
- #14642
- State rank
- #714 of 760 in MI
Livability — Flint
- Score
- 74/100
- State rank
- #196
- US rank
- #4946
Category grades
Schools grade is shown separately in the Schools card above.
Census & demographics
- Census place
- Flint, MI
- City population
- 93,814
- Population (ZIP)
- 23,873
Population outlook (Genesee County) Hauer SSP2
- Today (2025)
- 381,312 people
- By 2030
- 362,731 · -4.9%
- By 2040
- 321,550 · -15.7%
- By 2050
- 279,212 · -26.8%
- By 2075
- 193,336 · -49.3%
- By 2100
- 128,118 · -66.4%
Race, ethnicity, and origin ACS 2023
- Neighborhood character
- Predominantly Black (66%)
- Race & ethnicity
- Black 66% White 24% Two or more races 6% Hispanic / Latino 5% Asian 1%
- Common ancestry
- Romanian 2% Lithuanian 1% Italian 1%
- Foreign-born
- 3% · Canada, China
- Languages at home
- 96% English-only · Spanish 2%
Political lean MEDSL · Genesee
- 2024 margin
- Toss-up / Even · D 51.4% · R 47.2% · Other 1.4%
- 2008→2024 swing
- -28.3pp toward R · 2008: 32.5pp · 2024: 4.2pp
- All cycles
- 2024: D+4.2 2020: D+9.3 2016: D+9.5 2012: D+28.2 2008: D+32.5
Not yet ingested
- Civics
- —
Market trends
- HPI YoY
- ▼ -101.67%
- Current HPI
- 94.3111
- Rent YoY
- —
- Metro
- —
- State GDP YoY
- ▲ 1.37%
- F500 in state
- 28
Industry mix (Fortune 500 HQ in MI)
| Industry | F500 HQs | Revenue |
|---|---|---|
| Automotive Parts | 3 | $48B |
|
||
| Automotive | 2 | $372B |
|
||
| Chemicals | 1 | $45B |
|
||
| Automotive Retail | 1 | $29B |
|
||
| Healthcare / Medical Devices | 1 | $23B |
|
||
| Automotive Technology | 1 | $20B |
|
||
Price history
+206.0% since first listed5 events — show timeline
- 2026-04-09 Price Changed $39,900 MiRealSource-MiMLS
- 2026-04-08 Price Changed $39,900 REALCOMP
- 2026-03-31 Listed $42,500 REALCOMP
- 2026-03-31 Listed $42,500 MiRealSource-MiMLS
- 2003-02-11 Sold (Public Records) $13,038 Public Records
Property tax history
-0.3%/yrLatest (2025): $989 · +1.6% YoY. Source: county tax records.
Cash-flow waterfall
monthlySold comps — $/sqft
last 12 mo · ≤1 miLoading sold comps…