 Triplex
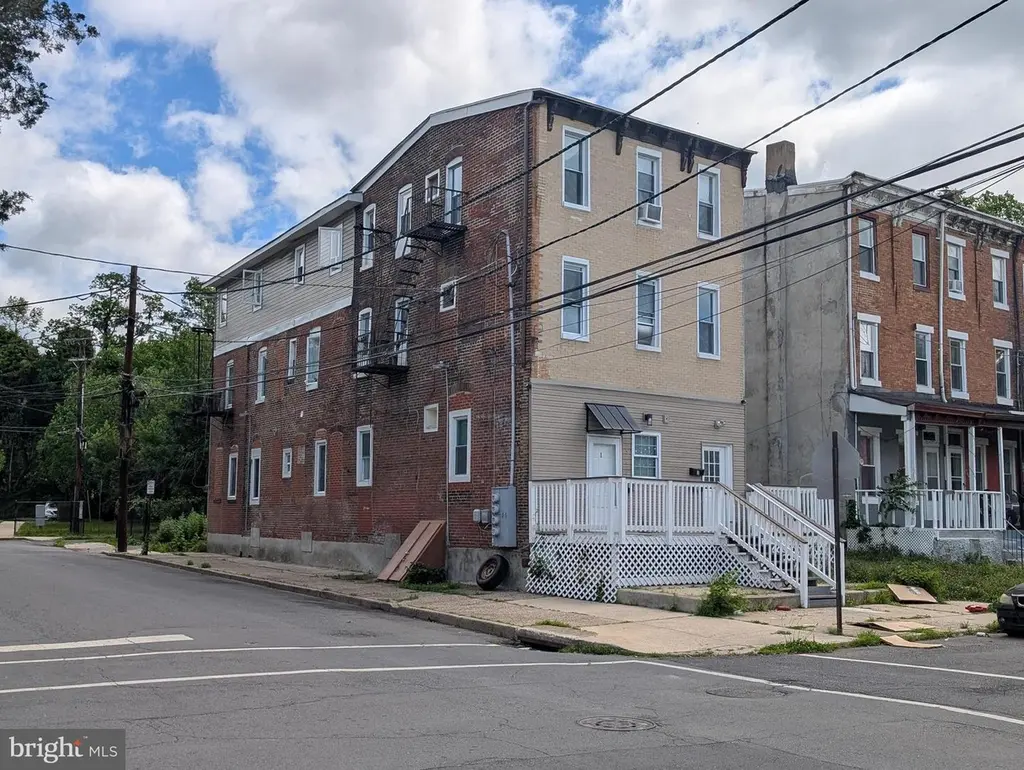
560 Edgewood Ave · Trenton, NJ
Flood risk No data
- FEMA flood zone
- —
- Chance of flooding over 30 yrs
- —
- Est. flood insurance / yr
- —
Fire risk No data
- Est. fire insurance / yr
- —
Heat risk No data
- Hot days now (above threshold)
- —
- Hot days in 30 yrs
- —
Wind risk No data
- Chance of severe wind over 30 yrs
- —
Air-quality risk No data
- Unhealthy air days now
- —
- Unhealthy air days in 30 yrs
- —
Risk factors via First Street. Map © Google.
Why this score? — see what drove the B- grade
The composite is a weighted blend of 9 inputs, each scored 0–100. Each bar is that input's sub-score; the figure is the points it added to the 100-point composite (weight × sub-score).
- Cash flow +30.0/30.0
- 1% rule +10.0/10.0
- DSCR +10.0/10.0
- ARV discount +7.5/15.0
- Livability +3.8/5.0
- Rent growth +3.2/5.0
- Condition / age +2.5/5.0
- Schools +0.7/10.0
- Appreciation +0.0/10.0
$459,900
🖨 Deal sheet (PDF) 📄 Offer letter ✓ Due diligence
Multi-family units
County records classify this as Multi-Family (2-4 Unit). Listing-text estimate: 3 units. confirmed
Listing remarks MLS
ATTENTION INVESTORS! Come see this 3-family, detached home that needs interior renovation due to fire damage. Each unit has 3 bedrooms and 1 bath. The building has been gutted. However, electrical, most plumbing and framing are intact. There are Hydronic Heating Combo Units and individual electric meters for each unit. Kitchen cabinets may still be salvageable. Pictures are from the renovation in 2016 prior to fire damage. The property is located on a corner with space in the rear and an additional lot to the side of the building. With access from a rear alley, this space could provide off-street parking for tenants. Once renovated, the total possible rental income is approximately $3,000+ per month. Could be a good money maker for the industrious investor! Property is being sold in as-is'' condition with buyer responsible for all city certs, permits and inspections.
Key facts
- 2,200 sq ft lot
- Built 1920
- Listed 15 days
Property features AI
Finance
- Other: Total of 3 residential units (2 leased, 1 vacant); Assessor-reported finished above-grade area
- Financial info: Existing month-to-month leases; Rent controlled; Total actual rent reported: $3,700; Fee simple ownership
Exterior
- Parking: On-street parking
- Utilities: Public water; Public sewer
- Home design: Detached building; 3 stories
- Construction: Brick construction; Block foundation; Above-grade and below-grade structures; Built (year recorded by assessor)
- Exterior features: Lot approximately 22 x 100; No tidal water
Interior
- Bedrooms: Three 3-bedroom units
- Heating & cooling: Radiator heating; Natural gas heating and hot water
- Interior features: Full basement
Neighborhood map
What this means for you Summary
Snapshot
- This is a 3 × 3-bed/1-bath units multifamily listed at $460k.
Deal economics
- At list price, monthly cash flow is $2k ($30k/yr) — positive. Per door: $827/mo.
- The deal already cash-flows at list — no discount required.
- Meets the 1% rule at list price ($7k rent vs $460k).
- Recommended offer: $453k (1.5% below list) — sets the bar for market timing.
- Cap rate 12.8% vs local median 6.3% in Trenton — top-decile yield for the area; either an underpriced asset or a hidden risk that comps aren't pricing in. Stress-test before assuming the spread holds.
Location & tenants
- Location reads 76/100 on livability (#133 in NJ, #3,533 nationally) — a middle-class / working-renter tenant base. Strengths: amenities A+, commute A+, health & safety A+; Watch: schools F, crime F, employment F.
- Trenton Public School District (urban): math 2% / reading 16% proficiency, ranked #471 of 472 in NJ (top 100%) — low school quality limits family demand, transient renter base, plan for 1-2y turnover; 80% free/reduced lunch — lower-income household profile, screen leases tightly.
- Market conditions: Rents rising (+2.6%/yr); 144 active listings in the ZIP; 2,256 units permitted in Mercer County in 2024 (1,303 in 5+ unit buildings).
- At $7,162/mo this rent would consume 171% of the median local household income ($50k/yr) (locally 2116% of renters already pay >50% of income on rent) — very limited rent-growth headroom before tenants either downsize or default.
Forward outlook
- Local home prices are declining (-3.0%/yr); year-one equity from $3k of loan paydown is wiped out by about $14k of value loss. Plan a longer hold.
- Mercer County population projected at +4% by 2050 — modest demand growth; plan on rents tracking national, not racing it.
- At projected returns (-3.0% appreciation + 2.6% rent growth), your $129k cash investment doubles in ~6 years — after that, you're playing with house money.
Negotiation context
- It's been on market 15 days — a 2% lower offer ($453k) is reasonable based on typical stale-listing flexibility.
- 5 sale attempts since 20y ago; this cycle's ask is 131% above the opening price — seller raised mid-cycle; expect resistance to lowballs.
- Current owner paid $150k; list at $460k implies a 207% gain — meaningful room to come down on a strong offer.
Risks & watch-outs
- Watch-outs: built in 1920 — expect roof / HVAC / electrical / plumbing capex.
Questions for the listing agent
- Can we see the unit-by-unit rent roll, current vacancy, and any below-market leases? What's the average tenancy length?
- What capital expenditures (roof, boiler, parking lot, exteriors) have been made in the last 5 years, and what's planned in the next 2?
- Built in 1920 — when were the roof, HVAC, electrical panel, plumbing, and water heater last replaced?
- Is there a deadline driving the sale (1031 exchange, divorce, estate, relocation)? That informs how much negotiation room exists.
- Schools are F-rated, which usually means shorter tenancies and higher turnover. Who's the typical renter profile here, and what's been the actual vacancy rate?
- Crime grade is F in this area — have there been break-ins, vandalism, or insurance claims at this property in the last 3 years? What carrier currently insures it and at what premium?
- What's the average days-on-market for RENTAL listings here right now (not sales)? A rising rental-DOM trend means longer vacancies and softer asking-rent achievability than the comps imply.
- What's the recent tenant-quality profile in this submarket — average credit score on applications, eviction rate, late-payment / NSF rate, and stable-employment percentage? A property-management company in the area should have these aggregated.
- How much new apartment / multifamily construction is in the pipeline within 1–3 miles? Heavy new supply (>2% of stock underway) typically softens rents 12–24 months out; light construction supports rent growth.
Investment metrics
- 1% rule
- 1.56% ✓
- Cap rate
- 12.76%
- Cash-on-cash
- 23.11%
- DSCR
- 2.03
- GRM
- 5.4
CMA / ARV
No comps found within radius.
Projected returns pro-forma
-3.0% appreciation · 2.6% rent growth · sell at horizon
- IRR
- 15.7%
- Equity multiple
- 1.63×
- Total profit
- $80,648
- Equity at exit
- $68,573
- IRR
- 24.0%
- Equity multiple
- 3.04×
- Total profit
- $262,345
- Equity at exit
- $39,764
Cash invested: $128,772 (down + closing). Projections, not guarantees.
Landlord ↔ Tenant lean methodology
- Overall (STATE)
- 21 Tenant-Leaning
- State New Jersey
- 21 Tenant-Leaning · D+6
- County
- — inherits STATE
- City
- — inherits STATE
ZIP-level market 08618
- Rents YoY
- 2.6%
- Active inventory
- 144
- Price-to-rent
- 16.1×
Monthly cashflow live
- Estimated rent
- $7,162 high interval (Pro) →
- Mortgage (P&I)
- −$2,412
- Tax est. 1.5%
- −$575 /mo · $6,898/yr
- Insurance
- −$192
- HOA
- −$0
- Vacancy / Maint / Mgmt
- −$1,504
- Net cashflow
- $2,480
Break-even live
Sensitivity live
| Price | -10% $2,798 | -5% $2,639 | +0% $2,480 | +5% $2,321 | +10% $2,162 |
|---|---|---|---|---|---|
| Rent | -10% $1,914 | -5% $2,197 | +0% $2,480 | +5% $2,763 | +10% $3,046 |
| Rate | -1.0pp $2,711 | -0.5pp $2,597 | base $2,480 | +0.5pp $2,361 | +1.0pp $2,239 |
3-unit breakdown (identical units grouped — click to expand)
| Units | Beds | Baths | Est. rent |
|---|---|---|---|
| 3× units | 3 | 1 | $7,161 |
| #1 | 3 | 1 | $2,387 |
| #2 | 3 | 1 | $2,387 |
| #3 | 3 | 1 | $2,387 |
| Total (3 units) | $7,162 | ||
UW: 25.0% down · 7.5% · 30yr · 1.5% tax · 5.0% vac · 8.0% maint · 8.0% mgmt
Financing live
Cash to close
- Down payment
- $114,975
- Closing costs
- $13,797
- Reserves months
- —
- Total cash needed
- —
Loan-product check · same deal, 3 products live
Conventional
25% down · 7.5% · 30yr
- Down + closing
- —
- Monthly P&I
- —
- Monthly cashflow
- —
- DSCR
- —
- Eligible?
- —
Personal DTI + credit; lowest rate.
DSCR
20% down · 8.5% · 30yr
- Down + closing
- —
- Monthly P&I
- —
- Monthly cashflow
- —
- DSCR
- —
- Eligible?
- —
No personal income docs; deal must DSCR.
Hard money
10% down · 12.0% · 12mo
- Down + closing
- —
- Monthly P&I
- —
- Monthly cashflow
- —
- DSCR
- —
- Eligible?
- —
Short-term bridge; refi at stabilization.
Listing history 13 events
-
2026-06-19price $459,900 Active 15 DOM
-
2026-06-18days on market $499,900 Active 15 DOM
-
2026-06-17days on market $499,900 Active 14 DOM
-
2026-06-16days on market $499,900 Active 13 DOM
-
2026-06-15days on market $499,900 Active 12 DOM
-
2026-06-14days on market $499,900 Active 10 DOM
-
2026-06-10days on market $499,900 Active 7 DOM
-
2026-06-09days on market $499,900 Active 6 DOM
-
2026-06-08days on market $499,900 Active 5 DOM
-
2026-06-07statusdays on market $499,900 Active 4 DOM
-
2026-06-03days on market $499,900 Coming Soon 2 DOM
-
2026-06-02remarks 693-char remark
-
2026-06-02$499,900 Coming Soon 1 DOM
ⓘ Source: listings_history table (triggers on properties + properties_extension) + one-shot
backfill from property_details.listing_events for pre-trigger history.
Nearby sold comps map
Loading sold comps map…
Walkable amenities ~0.75 mi
Loading nearby amenities…
Taxation est. · year 1
- Rental income
- $85,944
- − Mortgage interest
- −$25,762
- − Property taxes
- −$6,898
- − Insurance
- −$2,300
- − Repairs & maintenance
- −$6,876
- − Management
- −$6,876
- − Depreciation
- −$13,379
- Taxable income
- $23,855
- Est. tax owed @ 24.0%
- −$5,725
- After-tax cash flow
- $24,031/yr
For passive investors: Depreciation is non-cash, so a rental often shows a tax loss while cash-flowing — sheltering income. Rental losses are passive: they offset passive income freely, and up to $25,000/yr can offset ordinary (W-2) income if you actively participate and your MAGI is under $100k (phasing out to $0 by $150k); unused losses carry forward. On sale, claimed depreciation is recaptured at up to 25%, and gains may owe capital-gains tax (a 1031 exchange can defer both). Figures are a year-1 estimate at your 24.0% rate — not tax advice; consult a CPA.
Schools (NCES district)
- District
- Trenton Public School District
- NCES district ID
- 3416290
- Math proficiency
- 2% ▼ -8.00%
- Reading proficiency
- 16% ▼ -4.00%
- Median HH income
- $35,078
- Composite
- 7.31/100
- National rank
- #9956
- State rank
- #471 of 472 in NJ
Livability — Trenton
- Score
- 76/100
- State rank
- #133
- US rank
- #3533
Category grades
Schools grade is shown separately in the Schools card above.
Census & demographics
- Census place
- Trenton, NJ
- County
- Mercer County · 327,655 people
- City population
- 177,819
- Metro
- Trenton-Princeton, NJ
- Population (ZIP)
- 35,634
- Household income
- $50,390
- Rent vs Own
- Severe rent burden
- 2116.0
Population outlook (Mercer County) Hauer SSP2
- Today (2025)
- 381,395 people
- By 2030
- 384,640 · +0.9%
- By 2040
- 391,431 · +2.6%
- By 2050
- 397,845 · +4.3%
- By 2075
- 417,281 · +9.4%
- By 2100
- 420,327 · +10.2%
Race, ethnicity, and origin ACS 2023
- Neighborhood character
- Diverse neighborhood (Simpson 0.59)
- Race & ethnicity
- Black 59% White 19% Hispanic / Latino 16% Two or more races 7% Asian 3%
- Hispanic origin (detail)
- Mexican 1% Puerto Rican 6% Dominican 3%
- Common ancestry
- Romanian 2% Hispanic 1% Scotch-Irish 1%
- Foreign-born
- 14% · Canada, China, South Korea
- Languages at home
- 80% English-only · Spanish 10% Other Indo-European 3% Arabic 1%
Political lean MEDSL · Mercer
- 2024 margin
- Solid D (+33.9) · D 65.9% · R 32.0% · Other 2.1%
- 2008→2024 swing
- -2.2pp toward R · 2008: 36.1pp · 2024: 33.9pp
- All cycles
- 2024: D+33.9 2020: D+40.0 2016: D+36.2 2012: D+36.8 2008: D+36.1
Not yet ingested
- Civics
- —
Market trends
- HPI YoY
- ▼ -309.54%
- Current HPI
- 288.6841
- Rent YoY
- ▲ 2.60%
- Metro
- Trenton-Princeton, NJ
- State GDP YoY
- ▲ 2.05%
- F500 in state
- 34
Industry mix (Fortune 500 HQ in NJ)
| Industry | F500 HQs | Revenue |
|---|---|---|
| Consumer Goods | 3 | $31B |
|
||
| Pharmaceuticals | 2 | $153B |
|
||
| Technology | 2 | $21B |
|
||
| Insurance | 2 | $20B |
|
||
| Healthcare | 2 | $19B |
|
||
| Financial Services | 1 | $70B |
|
||
Price history
+300.2% since first listed17 events — show timeline
- 2026-06-01 Coming Soon $499,900 BRIGHT MLS
- 2022-10-07 Sold (MLS) $150,000 CJMLS
- 2022-10-06 Sold (MLS) $150,000 BRIGHT MLS
- 2022-10-06 Sold (MLS) $150,000 GSMLS
- 2022-09-20 Pending — GSMLS
- 2022-09-08 Pending — BRIGHT MLS
- 2022-08-19 Price Changed $157,500 GSMLS
- 2022-08-19 Price Changed $157,500 BRIGHT MLS
- 2022-08-10 Price Changed $175,000 BRIGHT MLS
- 2022-08-10 Price Changed $175,000 CJMLS
- 2022-07-20 Relisted — BRIGHT MLS
- 2022-07-14 Contingent — BRIGHT MLS
- 2022-06-27 Listed $199,000 BRIGHT MLS
- 2022-06-27 Listed $175,000 GSMLS
- 2022-06-27 Listed $199,000 CJMLS
- 2007-04-24 Listing Removed — BRIGHT MLS
- 2006-04-24 Listed $124,900 BRIGHT MLS
Cash-flow waterfall
monthlySold comps — $/sqft
last 12 mo · ≤1 miLoading sold comps…