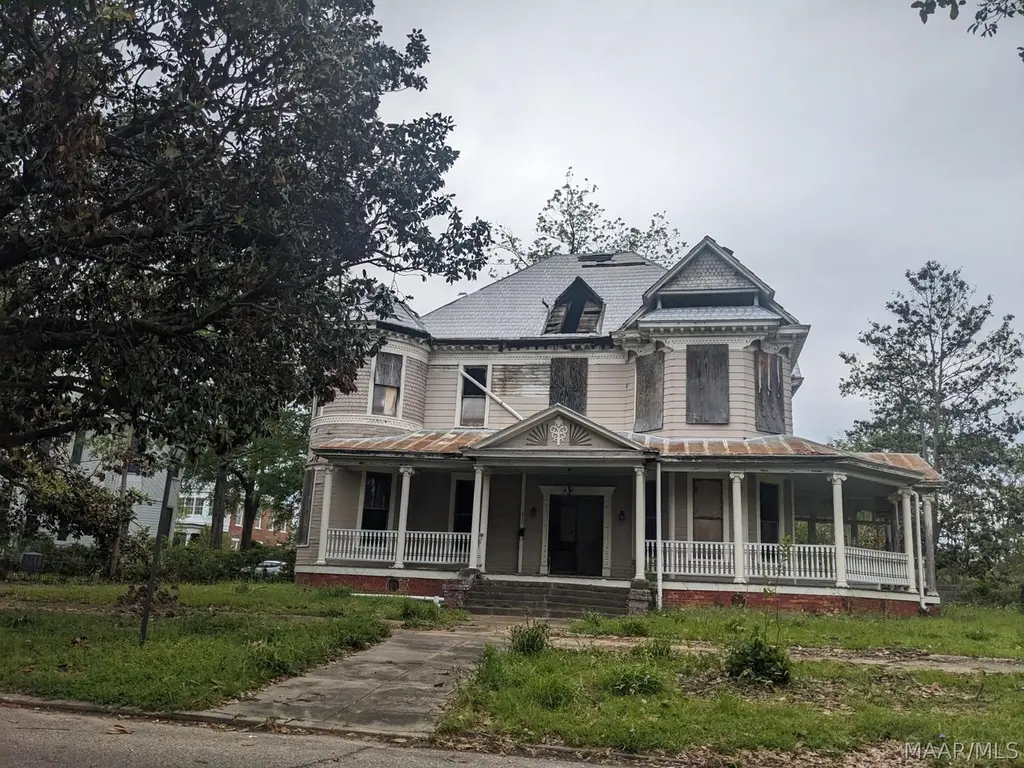
610 Mabry St · Selma, AL
Flood risk 1/10 · Minimal
- FEMA flood zone
- X (unshaded)
- Chance of flooding over 30 yrs
- 0.0%
- Est. flood insurance / yr
- $507 – $1,088
Fire risk 3/10 · Minor
- Est. fire insurance / yr
- $916 – $1,700
Heat risk 7/10 · Major
- Hot days now (above 108°F)
- 7 days/yr
- Hot days in 30 yrs
- 19 days/yr
Wind risk 8/10 · Major
- Chance of severe wind over 30 yrs
- 80.0%
Air-quality risk 2/10 · Minimal
- Unhealthy air days now
- 0 days/yr
- Unhealthy air days in 30 yrs
- 1 days/yr
Risk factors via First Street. Map © Google.
Why this score? — see what drove the B- grade
The composite is a weighted blend of 9 inputs, each scored 0–100. Each bar is that input's sub-score; the figure is the points it added to the 100-point composite (weight × sub-score).
- Cash flow +30.0/30.0
- 1% rule +10.0/10.0
- DSCR +10.0/10.0
- ARV discount +7.5/15.0
- Livability +2.8/5.0
- Rent growth +2.5/5.0
- Condition / age +2.5/5.0
- Schools +0.9/10.0
- Appreciation +0.0/10.0
$28,500
🖨 Deal sheet 📄 Offer letter ✓ Due diligence
Listing remarks MLS
QUEEN ANN HOME - HOUSE HAS BEEN IN A FIRE - SEEPLAT FOR SIZE OFTHE YARD - SOLD IN "AS IS " CONDITION
Key facts
- 8,755 sq ft lot
- Built 1880
- Listed 14 days
Property features AI
Exterior
- Utilities: Cable available; Electricity available; Natural gas available; High-speed internet available; Public water; Public sewer
- Home design: 2 stories; Metal siding; Wood siding
- Construction: Built (year source: public records)
- Exterior features: Balcony; Covered balcony; Porch; City lot
Interior
- Flooring: Parquet; Tile; Wood
- Bathrooms: 4 full bathrooms
- Heating & cooling: Central heating; Gas heating
- Interior features: Attic; Storage
- Laundry & utility: Water heater
Neighborhood map
What this means for you Summary
Snapshot
- This is a 3-bed/2.0-bath single-family listed at $28k.
Deal economics
- At list price, monthly cash flow is $650 ($8k/yr) — positive.
- The deal already cash-flows at list — no discount required.
- Meets the 1% rule at list price ($1k rent vs $28k).
- Recommended offer: $28k (1.5% below list) — sets the bar for market timing.
- Cap rate 33.6% vs local median 7.5% in Selma — top-decile yield for the area; either an underpriced asset or a hidden risk that comps aren't pricing in. Stress-test before assuming the spread holds.
Location & tenants
- Location reads 56/100 on livability (#407 in AL) — a working-class tenant base; expect higher turnover. Strengths: cost of living A+, housing B; Watch: schools F, crime F, amenities F.
- Selma City (town): math 2% / reading 23% proficiency, ranked #118 of 129 in AL (top 92%) — low school quality limits family demand, transient renter base, plan for 1-2y turnover; 84% free/reduced lunch — lower-income household profile, screen leases tightly.
- Market conditions: 104 active listings in the ZIP; 7 units permitted in Dallas County in 2024 (0 in 5+ unit buildings).
Forward outlook
- Local home prices are declining (-3.0%/yr); year-one equity from $197 of loan paydown is wiped out by about $855 of value loss. Plan a longer hold.
- Dallas County population projected at -36% by 2050 — secular population decline; favor cash flow + early exit over multi-decade hold.
- At projected returns (-3.0% appreciation + 3.0% rent growth), your $8k cash investment doubles in ~2 years — after that, you're playing with house money.
Negotiation context
- It's been on market 15 days — a 2% lower offer ($28k) is reasonable based on typical stale-listing flexibility.
- 4 sale attempts since 18y ago with the ask held roughly flat each time — persistent listings suggest the price (not the market) is what's stuck; bring a comps-based counter.
Risks & watch-outs
- Watch-outs: built in 1880 — expect roof / HVAC / electrical / plumbing capex.
- Climate carrying-cost: severe wind risk, 80% chance of damaging wind over 30y; extreme-heat days projected 7→19/yr by 2055 (HVAC capex compounding) — expect insurance premiums to compound above CPI over the hold.
Questions for the listing agent
- Built in 1880 — when were the roof, HVAC, electrical panel, plumbing, and water heater last replaced?
- Is there a deadline driving the sale (1031 exchange, divorce, estate, relocation)? That informs how much negotiation room exists.
- Schools are F-rated, which usually means shorter tenancies and higher turnover. Who's the typical renter profile here, and what's been the actual vacancy rate?
- Crime grade is F in this area — have there been break-ins, vandalism, or insurance claims at this property in the last 3 years? What carrier currently insures it and at what premium?
- What's the average days-on-market for RENTAL listings here right now (not sales)? A rising rental-DOM trend means longer vacancies and softer asking-rent achievability than the comps imply.
- What's the recent tenant-quality profile in this submarket — average credit score on applications, eviction rate, late-payment / NSF rate, and stable-employment percentage? A property-management company in the area should have these aggregated.
- How much new for-sale + rental construction is in the pipeline within 1–3 miles? Heavy new supply typically softens prices + rents 12–24 months out; constrained supply supports both.
Investment metrics
- 1% rule
- 3.71% ✓
- Cap rate
- 33.65%
- Cash-on-cash
- 97.70%
- DSCR
- 5.35
- GRM
- 2.2
CMA / ARV
- ARV (on-the-fly)
- $115,150
- Comps found
- 1
Show comp detail 1 sale within ~0.75 mi
| Address | Dist | Beds/Ba | Sqft | Sold | Price | $/sf | Match |
|---|---|---|---|---|---|---|---|
| 501 Tremont St | 0.11mi | 4/2.5 (+1) | 5,027 (+9%) | 10mo | $125,000 | $25 | 64 |
Match score weights: distance 35% · size 25% · config 20% · recency 20%. Top-matched comps best support the ARV.
Projected returns pro-forma
-3.0% appreciation · 3.0% rent growth · sell at horizon
- IRR
- 98.7%
- Equity multiple
- 5.61×
- Total profit
- $36,772
- Equity at exit
- $4,249
- IRR
- —
- Equity multiple
- 11.69×
- Total profit
- $85,340
- Equity at exit
- $2,464
Cash invested: $7,980 (down + closing). Projections, not guarantees.
Landlord ↔ Tenant lean methodology
- Overall (STATE)
- 90 Strongly Landlord-Friendly
- State Alabama
- 90 Strongly Landlord-Friendly · R+15
- County
- — inherits STATE
- City
- — inherits STATE
ZIP-level market 36701
- Home prices YoY
- -6.3%
- Active inventory
- 104
- Price-to-rent
- 2.2×
Monthly cashflow live
- Estimated rent
- $1,056 medium interval (Pro) →
- Mortgage (P&I)
- −$149
- Tax from tax record
- −$24 /mo · $283/yr
- Insurance
- −$12
- HOA
- −$0
- Vacancy / Maint / Mgmt
- −$222
- Net cashflow
- $650
Break-even live
UW: 25.0% down · 7.5% · 30yr · 1.5% tax · 5.0% vac · 8.0% maint · 8.0% mgmt
Financing live
Cash to close
- Down payment
- $7,125
- Closing costs
- $855
- Reserves months
- —
- Total cash needed
- —
Loan-product check · same deal, 3 products live
Conventional
25% down · 7.5% · 30yr
- Down + closing
- —
- Monthly P&I
- —
- Monthly cashflow
- —
- DSCR
- —
- Eligible?
- —
Personal DTI + credit; lowest rate.
DSCR
20% down · 8.5% · 30yr
- Down + closing
- —
- Monthly P&I
- —
- Monthly cashflow
- —
- DSCR
- —
- Eligible?
- —
No personal income docs; deal must DSCR.
Hard money
10% down · 12.0% · 12mo
- Down + closing
- —
- Monthly P&I
- —
- Monthly cashflow
- —
- DSCR
- —
- Eligible?
- —
Short-term bridge; refi at stabilization.
Listing history 13 events
-
2026-06-19days on market $28,500 Active 15 DOM
-
2026-06-18days on market $28,500 Active 14 DOM
-
2026-06-17days on market $28,500 Active 13 DOM
-
2026-06-16days on market $28,500 Active 12 DOM
-
2026-06-15days on market $28,500 Active 11 DOM
-
2026-06-14days on market $28,500 Active 9 DOM
-
2026-06-12days on market $28,500 Active 8 DOM
-
2026-06-09days on market $28,500 Active 5 DOM
-
2026-06-09status $28,500 Active 4 DOM
-
2026-06-08days on market $28,500 Contingent 4 DOM
-
2026-06-07statusdays on market $28,500 Contingent 3 DOM
-
2026-06-07remarks 214-char remark
-
2026-06-07$28,500 Active 2 DOM
ⓘ Source: listings_history table (triggers on properties + properties_extension) + one-shot
backfill from property_details.listing_events for pre-trigger history.
Tax reassessment forecast AL · Resets to sale price
- Current annual tax
- $283 · $24/mo
- Projected year-2 tax
- $283 · $24/mo
- Expected delta
- $0/yr ($0/mo · 0.0%)
ⓘ Screening estimate from a state-policy table — verify with the county assessor before closing.
Climate risk First Street
- Flood 1/10 Low FEMA zone X (unshaded) · 0% chance over 30 yrs
- Wildfire 3/10 Moderate
- Heat 7/10 Severe 7 d/yr ≥108°F today · 19 d/yr by 30 yrs out
- Wind 8/10 Severe 80% chance of damaging wind over 30 yrs
- Air quality 2/10 Low 0 unhealthy d/yr today · 1 by 30 yrs out
Nearby sold comps map
Loading sold comps map…
Walkable amenities ~0.75 mi
Loading nearby amenities…
Taxation est. · year 1
- Rental income
- $12,678
- − Mortgage interest
- −$1,596
- − Property taxes
- −$283
- − Insurance
- −$142
- − Repairs & maintenance
- −$1,014
- − Management
- −$1,014
- − Depreciation
- −$829
- Taxable income
- $7,799
- Est. tax owed @ 24.0%
- −$1,872
- After-tax cash flow
- $5,925/yr
For passive investors: Depreciation is non-cash, so a rental often shows a tax loss while cash-flowing — sheltering income. Rental losses are passive: they offset passive income freely, and up to $25,000/yr can offset ordinary (W-2) income if you actively participate and your MAGI is under $100k (phasing out to $0 by $150k); unused losses carry forward. On sale, claimed depreciation is recaptured at up to 25%, and gains may owe capital-gains tax (a 1031 exchange can defer both). Figures are a year-1 estimate at your 24.0% rate — not tax advice; consult a CPA.
Schools (NCES district)
- District
- Selma City
- NCES district ID
- 0102970
- Math proficiency
- 2% ▼ -24.00%
- Reading proficiency
- 23% ▼ -2.00%
- Median HH income
- $23,380
- Composite
- 9.07/100
- National rank
- #9870
- State rank
- #118 of 129 in AL
Livability — Selma
- Score
- 56/100
- State rank
- #407
- US rank
- #22550
Category grades
Schools grade is shown separately in the Schools card above.
Census & demographics
- Census place
- Selma, AL
- Population (ZIP)
- 22,358
Population outlook (Dallas County) Hauer SSP2
- Today (2025)
- 35,464 people
- By 2030
- 32,631 · -8.0%
- By 2040
- 27,246 · -23.2%
- By 2050
- 22,691 · -36.0%
- By 2075
- 14,867 · -58.1%
- By 2100
- 10,285 · -71.0%
Race, ethnicity, and origin ACS 2023
- Neighborhood character
- Predominantly Black (69%)
- Race & ethnicity
- Black 69% White 28% Hispanic / Latino 2%
- Common ancestry
- Serbian 1% Lithuanian 1% Slovak 1%
- Foreign-born
- 2% · Canada
- Languages at home
- 98% English-only · Spanish 1%
Political lean MEDSL · Dallas
- 2024 margin
- Solid D (+32.5) · D 65.9% · R 33.4%
- 2008→2024 swing
- -2.0pp toward R · 2008: 34.5pp · 2024: 32.5pp
- All cycles
- 2024: D+32.5 2020: D+37.5 2016: D+37.6 2012: D+39.7 2008: D+34.5
Not yet ingested
- Civics
- —
Market trends
- HPI YoY
- ▼ -11.98%
- Current HPI
- 176.6034
- Rent YoY
- —
- Metro
- —
- State GDP YoY
- ▲ 2.94%
- F500 in state
- 4
Industry mix (Fortune 500 HQ in AL)
| Industry | F500 HQs | Revenue |
|---|---|---|
| Financial Services | 1 | $8B |
|
||
| Healthcare | 1 | $5B |
|
||
Price history
-72.1% since first listed13 events — show timeline
- 2026-06-04 Listed $28,500 MAAR
- 2025-06-09 Sold (Public Records) $28,511 Public Records
- 2024-08-23 Sold (MLS) $33,000 MAAR
- 2024-07-27 Pending — MAAR
- 2024-04-24 Price Changed $39,900 MAAR
- 2024-01-12 Listed $45,000 MAAR
- 2023-07-21 Sold (MLS) $47,000 MAAR
- 2023-07-20 Sold (Public Records) $37,000 Public Records
- 2023-06-23 Pending — MAAR
- 2023-05-26 Contingent — MAAR
- 2023-04-13 Listed $45,000 MAAR
- 2008-12-19 Listed $52,000 MAAR
- 2005-01-21 Sold (Public Records) $102,000 Public Records
Property tax history
-7.5%/yrLatest (2023): $283 · +3.4% YoY. Source: county tax records.
Cash-flow waterfall
monthlySold comps — $/sqft
last 12 mo · ≤1 miLoading sold comps…