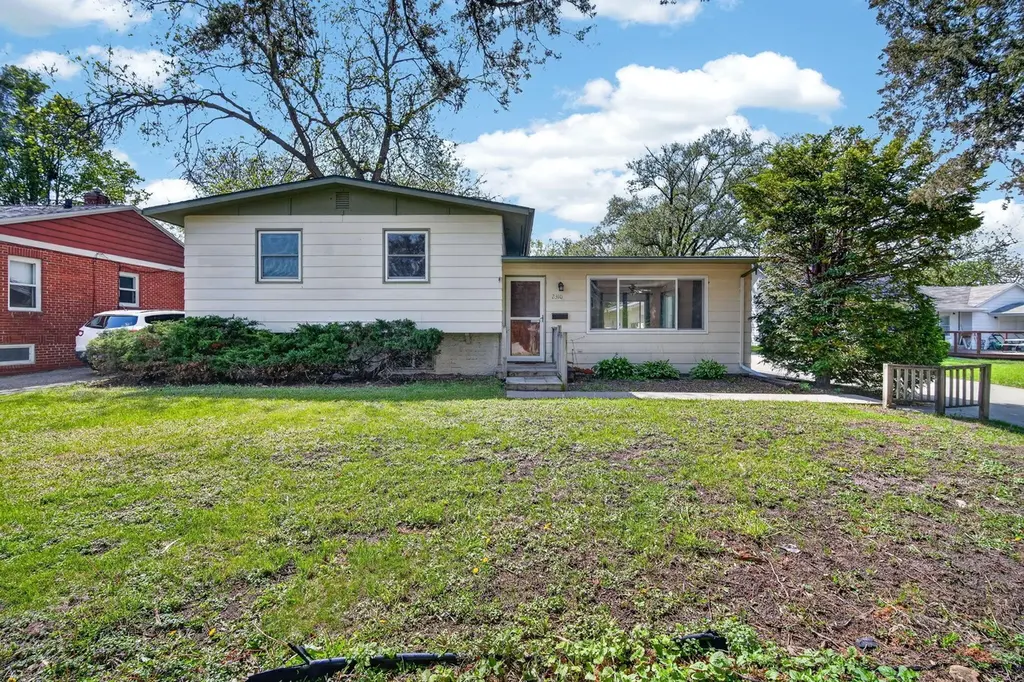
2310 37th St · Des Moines, IA
Flood risk 1/10 · Minimal
- FEMA flood zone
- X (unshaded)
- Chance of flooding over 30 yrs
- 0.0%
- Est. flood insurance / yr
- $473 – $860
Fire risk 1/10 · Minimal
- Est. fire insurance / yr
- $902 – $1,676
Heat risk 3/10 · Minor
- Hot days now (above 103°F)
- 7 days/yr
- Hot days in 30 yrs
- 15 days/yr
Wind risk 2/10 · Minimal
- Chance of severe wind over 30 yrs
- —
Air-quality risk 2/10 · Minimal
- Unhealthy air days now
- 1 days/yr
- Unhealthy air days in 30 yrs
- 1 days/yr
Risk factors via First Street. Map © Google.
Why this score? — see what drove the D- grade
The composite is a weighted blend of 9 inputs, each scored 0–100. Each bar is that input's sub-score; the figure is the points it added to the 100-point composite (weight × sub-score).
- ARV discount +15.0/15.0
- Cash flow +6.4/30.0
- Livability +4.0/5.0
- Schools +3.8/10.0
- Rent growth +3.4/5.0
- 1% rule +2.8/10.0
- Condition / age +2.5/5.0
- DSCR +0.7/10.0
- Appreciation +0.0/10.0
$165,000
🖨 Deal sheet (PDF) 📄 Offer letter ✓ Due diligence
Listing remarks
Split-level home in the Beaverdale area with great potential. The main level features the living room, dining area, and kitchen. The upper level includes three bedrooms and an updated full bath. The lower level offers a spacious family room along with a 3/4 bath for added flexibility. Hardwood floors in the bedrooms and vinyl windows throughout. All appliances included. Outside, you'll find a fenced yard, 2 car attached garage, and storage shed. Good space and layout for someone looking to build equity.
Key facts
- 0.24 acre lot
- 2 garage spots
- Built 1963
Property features AI
Finance
- Other: Contaminant control indoor air quality feature; Partial basement with sump pump; Approximately 0.24-acre lot (75 x 140)
Exterior
- Parking: Attached or detached 2-car garage
- Utilities: Public water; Public sewer
- Home design: Single family residence; Residential property
- Construction: Built with other construction materials; Block foundation
- Exterior features: Patio; Fenced yard; Shed
Interior
- Kitchen: Dishwasher; Range; Refrigerator
- Flooring: Vinyl; Laminate; Hardwood; Carpet
- Bathrooms: Two three-quarter bathrooms
- Heating & cooling: Forced air heating (natural gas); Central air conditioning
- Interior features: Ceiling fans; Window treatments; Gas fireplace
- Laundry & utility: Washer; Dryer
Neighborhood map
What this means for you Summary
Snapshot
- This is a 3-bed/2.0-bath single-family listed at $165k.
Deal economics
- At list price, monthly cash flow is $-283 ($-3k/yr) — negative.
- To cash-flow at today's rent, offer at most $115k (30.3% below list).
- To meet the 1% rule (rent ≥ 1% of price), the offer needs to be $129k (22.1% below list).
- Recommended offer: $115k (30.3% below list) — sets the bar for cash-flow.
- Cap rate 4.2% vs local median 3.1% in Des Moines — top-decile yield for the area; either an underpriced asset or a hidden risk that comps aren't pricing in. Stress-test before assuming the spread holds.
Location & tenants
- Location reads 81/100 on livability (#63 in IA, #1,432 nationally) — a professional / high-income tenant draw. Strengths: commute A+, cost of living A+, housing A+; Watch: employment C-, crime F.
- Des Moines Independent Community School District (urban): math 43% / reading 46% proficiency, ranked #289 of 289 in IA (top 100%) — families likely to look elsewhere, expect single-tenant / working-renter base with shorter leases; 63% free/reduced lunch — lower-income household profile, screen leases tightly.
- Zoned schools: Monroe Elementary School (math 30% / reading 27%, grade F, #606 of 616 statewide, top 98%, 423 students, 95% FRL); Meredith Middle School (math 40% / reading 40%, grade F, #239 of 246 statewide, top 97%, 664 students, 84% FRL); Hoover High School (math 46% / reading 55%, grade D+, #311 of 336 statewide, top 93%, 991 students, 78% FRL) — zoned schools average 86% FRL vs 63% district-wide (23 pts higher); higher-poverty schools than district average — tighter screening recommended.
- Market conditions: Rents rising (+3.7%/yr); 260 active listings in the ZIP; 40 comparable units currently listed for rent nearby; rentals at typical pace (median 25d on market — plan ~3-4 weeks tenant-placement turnaround); solid renter incomes; 2,953 units permitted in Polk County in 2024 (540 in 5+ unit buildings).
Forward outlook
- Local home prices are declining (-3.0%/yr); year-one equity from $1k of loan paydown is wiped out by about $5k of value loss. Plan a longer hold.
- Polk County population projected at +37% by 2050 — long-run rental-demand tailwind backs the buy-and-hold thesis.
Negotiation context
- Only 5 days on market — expect competitive offers; lowballing is unlikely to land.
- 2 sale attempts with the ask held roughly flat each time — persistent listings suggest the price (not the market) is what's stuck; bring a comps-based counter.
Risks & watch-outs
- Watch-outs: property tax is 2.6% of price.
Questions for the listing agent
- What do current leases actually rent for vs. the listed asking? Can we see a recent rent roll and the last 12 months of T-12 income?
- Built in 1963 — when were the roof, HVAC, electrical panel, plumbing, and water heater last replaced?
- Property tax is high relative to price — has the assessment been appealed recently, and will the sale trigger a re-assessment?
- Is there a deadline driving the sale (1031 exchange, divorce, estate, relocation)? That informs how much negotiation room exists.
- Schools are D-rated, which usually means shorter tenancies and higher turnover. Who's the typical renter profile here, and what's been the actual vacancy rate?
- Crime grade is F in this area — have there been break-ins, vandalism, or insurance claims at this property in the last 3 years? What carrier currently insures it and at what premium?
- The area grade is low — what's the realistic commute time and amenity access for the typical tenant pool here? Any planned neighborhood developments (good or bad) we should know about?
- What's the average days-on-market for RENTAL listings here right now (not sales)? A rising rental-DOM trend means longer vacancies and softer asking-rent achievability than the comps imply.
- What's the recent tenant-quality profile in this submarket — average credit score on applications, eviction rate, late-payment / NSF rate, and stable-employment percentage? A property-management company in the area should have these aggregated.
- How much new for-sale + rental construction is in the pipeline within 1–3 miles? Heavy new supply typically softens prices + rents 12–24 months out; constrained supply supports both.
Investment metrics
- 1% rule
- 0.78% ✗
- Cap rate
- 4.24%
- Cash-on-cash
- -7.34%
- DSCR
- 0.67
- GRM
- 10.7
CMA / ARV
- ARV (median comp)
- $224,568
- List price
- $165,000
- Delta
- -26.53%
- Verdict
- UNDERPRICED
- Comps
- 20 within 1.0 mi
Show comp detail 12 sales within ~0.75 mi
| Address | Dist | Beds/Ba | Sqft | Sold | Price | $/sf | Match |
|---|---|---|---|---|---|---|---|
| 3112 Sheridan Ave | 0.42mi | 3/1.0 | 1,008 (-1%) | 1mo | $178,000 | $177 | 74 |
| 3013 Sheridan Ave | 0.48mi | 3/1.5 | 1,020 (+0%) | 1mo | $225,000 | $221 | 74 |
| 2824 35th St | 0.39mi | 3/2.0 | 929 (-9%) | 1mo | $242,000 | $260 | 67 |
| 3124 Sheridan Ave | 0.40mi | 2/1.0 (-1) | 980 (-4%) | 0mo | $186,000 | $190 | 66 |
| 4110 Leonard Pl | 0.57mi | 3/1.5 | 1,042 (+3%) | 2mo | $259,900 | $249 | 66 |
| 1683 Northwest Dr | 0.52mi | 2/1.0 (-1) | 1,039 (+2%) | 2mo | $262,000 | $252 | 62 |
| 2101 30th St | 0.49mi | 3/1.0 | 1,082 (+6%) | 2mo | $234,400 | $217 | 61 |
| 2512 33rd St | 0.31mi | 2/2.0 (-1) | 896 (-12%) | 0mo | $240,000 | $268 | 61 |
| 2615 30th St | 0.50mi | 3/2.0 | 918 (-10%) | 1mo | $210,000 | $229 | 60 |
| 2412 33rd St | 0.28mi | 2/2.0 (-1) | 1,162 (+14%) | 2mo | $258,500 | $222 | 56 |
| 1637 Huntland Dr | 0.57mi | 2/2.0 (-1) | 1,166 (+15%) | 0mo | $280,000 | $240 | 43 |
| 1716 44th St | 0.69mi | 3/1.0 | 868 (-15%) | 1mo | $185,000 | $213 | 38 |
Match score weights: distance 35% · size 25% · config 20% · recency 20%. Top-matched comps best support the ARV.
Projected returns pro-forma
-3.0% appreciation · 3.74% rent growth · sell at horizon
- IRR
- -28.0%
- Equity multiple
- 0.05×
- Total profit
- $-43,663
- Equity at exit
- $24,602
- IRR
- -23.6%
- Equity multiple
- -0.23×
- Total profit
- $-56,718
- Equity at exit
- $14,266
Cash invested: $46,200 (down + closing). Projections, not guarantees.
Landlord ↔ Tenant lean methodology
- Overall (STATE)
- 83 Strongly Landlord-Friendly
- State Iowa
- 83 Strongly Landlord-Friendly · R+6
- County
- — inherits STATE
- City
- — inherits STATE
ZIP-level market 50310
- Rents YoY
- 3.7%
- Active inventory
- 260
- Price-to-rent
- 10.7×
Monthly cashflow live
- Estimated rent
- $1,285 high interval (Pro) →
- Mortgage (P&I)
- −$865
- Tax from tax record
- −$364 /mo · $4,368/yr
- Insurance
- −$69
- HOA
- −$0
- Vacancy / Maint / Mgmt
- −$270
- Net cashflow
- $-283
Break-even live
Sensitivity live
| Price | -10% $-189 | -5% $-236 | +0% $-283 | +5% $-329 | +10% $-376 |
|---|---|---|---|---|---|
| Rent | -10% $-384 | -5% $-333 | +0% $-283 | +5% $-232 | +10% $-181 |
| Rate | -1.0pp $-200 | -0.5pp $-241 | base $-283 | +0.5pp $-325 | +1.0pp $-369 |
UW: 25.0% down · 7.5% · 30yr · 1.5% tax · 5.0% vac · 8.0% maint · 8.0% mgmt
Financing live
Cash to close
- Down payment
- $41,250
- Closing costs
- $4,950
- Reserves months
- —
- Total cash needed
- —
Loan-product check · same deal, 3 products live
Conventional
25% down · 7.5% · 30yr
- Down + closing
- —
- Monthly P&I
- —
- Monthly cashflow
- —
- DSCR
- —
- Eligible?
- —
Personal DTI + credit; lowest rate.
DSCR
20% down · 8.5% · 30yr
- Down + closing
- —
- Monthly P&I
- —
- Monthly cashflow
- —
- DSCR
- —
- Eligible?
- —
No personal income docs; deal must DSCR.
Hard money
10% down · 12.0% · 12mo
- Down + closing
- —
- Monthly P&I
- —
- Monthly cashflow
- —
- DSCR
- —
- Eligible?
- —
Short-term bridge; refi at stabilization.
Rent comps 40 comps
| Address | Beds | Baths | Sqft | Rent | $/sqft | DOM | Units | Dist |
|---|---|---|---|---|---|---|---|---|
| 2403 36th St Des Moines, IA | 3.0 | 2.0 | 1324 | $1,600 | $1.21 | 25d | 1 | 0.10mi |
| 2002 34th St Des Moines, IA | 2.0 | 1.0 | 897 | $1,350 | $1.51 | 23d | 1 | 0.24mi |
| 4326 Hickman Rd Unit 303 Des Moines, IA | 2.0 | 2.0 | 984 | $1,620 | $1.65 | 45d | 1 | 0.54mi |
| 4326 Hickman Rd Unit 403 Des Moines, IA | 2.0 | 2.0 | 984 | $1,640 | $1.67 | 45d | 1 | 0.55mi |
| 4326 Hickman Rd Unit 206 Des Moines, IA | 2.0 | 2.0 | 984 | $1,600 | $1.63 | 45d | 1 | 0.55mi |
| 4322 Northwest Dr Unit 1 Des Moines, IA | 3.0 | 1.5 | 1386 | $1,895 | $1.37 | 45d | 1 | 0.65mi |
| 2403 47th St Des Moines, IA | 2.0 | 1.0 | 776 | $1,033 | $1.33 | 45d | 1 | 0.73mi |
| 2901 Boston Ave Des Moines, IA | 1.0–2.0 | 1.0–1.5 | 707 | $1,300 | $1.84 | 16d | 7 | 0.75mi |
| 1604 44th St Des Moines, IA | 2.0 | 1.0 | 820 | $1,595 | $1.95 | 45d | 1 | 0.75mi |
| 3201 Forest Ave Des Moines, IA | 3.0 | 1.0–2.0 | 717 | $1,600 | $2.23 | 16d | 16 | 0.81mi |
| 3103 Forest Ave Des Moines, IA | 1.0–2.0 | 1.0–1.5 | 900 | $1,550 | $1.72 | 16d | 1 | 0.82mi |
| 2717 Meek Ave Des Moines, IA | 2.0 | 2.0 | 1128 | $1,550 | $1.37 | 16d | 1 | 0.84mi |
| 2501 24th St Unit 121 Des Moines, IA | 3.0 | 2.0 | 950 | $995 | $1.05 | 25d | 1 | 0.92mi |
| 2501 24th St Unit 113 Des Moines, IA | 2.0 | 1.0 | 750 | $945 | $1.26 | 45d | 1 | 0.92mi |
| 2501 24th St Apt 106 Des Moines, IA | 4.0 | 2.0 | 1175 | $1,245 | $1.06 | 45d | 1 | 0.92mi |
| 2501 24th St Unit 101 Des Moines, IA | 2.0 | 1.0 | 750 | $725 | $0.97 | 25d | 1 | 0.92mi |
| 2501 24th St Des Moines, IA | 2.0 | 1.0 | 910 | $795 | $0.87 | 25d | 1 | 0.92mi |
| 2501 24th St Apt 107 Des Moines, IA | 3.0 | 2.0 | 950 | $1,045 | $1.10 | 16d | 1 | 0.92mi |
| 2501 24th St Unit 111 Des Moines, IA | 2.0 | 1.0 | 750 | $760 | $1.01 | 25d | 1 | 0.92mi |
| 1260 34th St Unit 401 Des Moines, IA | 3.0 | 2.0 | 1088 | $1,335 | $1.23 | 45d | 1 | 0.92mi |
| 4532-4534 & Des Moines, IA | 2.0 | 2.0 | 800 | $1,098 | $1.37 | 16d | 4 | 0.94mi |
| 3517 University Ave Unit 008 Des Moines, IA | 2.0 | 1.0 | 750 | $799 | $1.07 | 25d | 1 | 0.95mi |
| 3727 University Ave Des Moines, IA | 2.0 | 1.0 | 725 | $875 | $1.21 | 45d | 1 | 0.95mi |
| 3809 University Ave Des Moines, IA | 2.0 | 1.0 | 725 | $875 | $1.21 | 45d | 1 | 0.97mi |
| 1219 34th St Unit 205 Des Moines, IA | 2.0 | 1.0 | 767 | $1,325 | $1.73 | 25d | 1 | 0.98mi |
| 3807 University Ave Des Moines, IA | 2.0 | 1.0 | 725 | $875 | $1.21 | 23d | 1 | 0.99mi |
| 3519 University Ave Apt 103 Des Moines, IA | 2.0 | 1.0 | 900 | $915 | $1.02 | 25d | 1 | 1.00mi |
| 4925 Franklin Ave Des Moines, IA | 1.0–2.0 | 1.0 | 606 | $1,015 | $1.67 | 16d | 4 | 1.02mi |
| 3724 University Ave Des Moines, IA | 2.0 | 1.0 | 788 | $1,200 | $1.52 | 23d | 1 | 1.03mi |
| 3120 Douglas Ave Des Moines, IA | 2.0 | 1.0 | 850 | $970 | $1.14 | 16d | 3 | 1.04mi |
| 3436 University Ave Unit 3438-1 Des Moines, IA | 2.0 | 1.0 | 734 | $792 | $1.08 | 16d | 1 | 1.05mi |
| 2411 Welbeck Rd #7 Des Moines, IA | 2.0 | 1.0 | 750 | $845 | $1.13 | 45d | 1 | 1.06mi |
| 2411 Welbeck Rd #11 Des Moines, IA | 2.0 | 1.0 | 750 | $745 | $0.99 | 45d | 1 | 1.06mi |
| 4010 University Ave Des Moines, IA | 2.0 | 1.0 | 790 | $895 | $1.13 | 16d | 1 | 1.07mi |
| 4010 University Ave Unit Apply Now Des Moines, IA | 2.0 | 1.0 | 790 | $895 | $1.13 | 25d | 1 | 1.07mi |
| 1718 22nd St Des Moines, IA | 2.0 | 1.0 | 840 | $995 | $1.18 | 16d | 1 | 1.08mi |
| 2715 Douglas Ave Des Moines, IA | 3.0 | 2.0 | 1109 | $1,408 | $1.27 | 16d | 1 | 1.12mi |
| 2940 Brattleboro Ave Unit 2 Des Moines, IA | 3.0 | 2.0 | 1250 | $1,300 | $1.04 | 16d | 1 | 1.16mi |
| 3915 Lawnwoods Dr Des Moines, IA | 3.0 | 1.5 | 1192 | $1,850 | $1.55 | 45d | 1 | 1.22mi |
| 1075 33rd St Unit 1075-1 Des Moines, IA | 2.0 | 1.0 | 800 | $777 | $0.97 | 25d | 1 | 1.22mi |
Listing history 5 events
-
2026-05-05status Pending 508-char remark
-
2026-04-30$165,000 Active 508-char remark
-
2026-04-27historical
-
2026-04-27$165,000
-
2006-09-08soldstatus $132,500
ⓘ Source: listings_history table (triggers on properties + properties_extension) + one-shot
backfill from property_details.listing_events for pre-trigger history.
Tax reassessment forecast IA · Partial reset (capped growth)
- Current annual tax
- $4,368 · $364/mo
- Projected year-2 tax
- $4,368 · $364/mo
- Expected delta
- $0/yr ($0/mo · 0.0%)
ⓘ Screening estimate from a state-policy table — verify with the county assessor before closing.
Climate risk First Street
- Flood 1/10 Low FEMA zone X (unshaded) · 0% chance over 30 yrs
- Wildfire 1/10 Low
- Heat 3/10 Moderate 7 d/yr ≥103°F today · 15 d/yr by 30 yrs out
- Wind 2/10 Low
- Air quality 2/10 Low 1 unhealthy d/yr today · 1 by 30 yrs out
Nearby sold comps map
Loading sold comps map…
Walkable amenities ~0.75 mi
Loading nearby amenities…
Taxation est. · year 1
- Rental income
- $15,423
- − Mortgage interest
- −$9,243
- − Property taxes
- −$4,368
- − Insurance
- −$825
- − Repairs & maintenance
- −$1,234
- − Management
- −$1,234
- − Depreciation
- −$4,800
- Taxable loss
- −$6,281
- Est. tax savings @ 24.0%
- +$1,507
- After-tax cash flow
- $-1,885/yr
For passive investors: Depreciation is non-cash, so a rental often shows a tax loss while cash-flowing — sheltering income. Rental losses are passive: they offset passive income freely, and up to $25,000/yr can offset ordinary (W-2) income if you actively participate and your MAGI is under $100k (phasing out to $0 by $150k); unused losses carry forward. On sale, claimed depreciation is recaptured at up to 25%, and gains may owe capital-gains tax (a 1031 exchange can defer both). Figures are a year-1 estimate at your 24.0% rate — not tax advice; consult a CPA.
Schools (NCES district)
- District
- Des Moines Independent Community School District
- NCES district ID
- 1908970
- Math proficiency
- 43% ▼ -6.00%
- Reading proficiency
- 46% ▼ -1.00%
- Median HH income
- $45,905
- Composite
- 37.83/100
- National rank
- #4331
- State rank
- #289 of 289 in IA
Livability — Des Moines
- Score
- 81/100
- State rank
- #63
- US rank
- #1432
Category grades
Schools grade is shown separately in the Schools card above.
Census & demographics
- Census place
- Des Moines, IA
- County
- Polk County · 453,298 people
- City population
- 203,612
- Metro
- Des Moines-West Des Moines, IA
- Population (ZIP)
- 31,177
- Household income
- $76,381
- Rent vs Own
- Severe rent burden
- 928.0
Population outlook (Polk County) Hauer SSP2
- Today (2025)
- 548,042 people
- By 2030
- 588,557 · +7.4%
- By 2040
- 670,629 · +22.4%
- By 2050
- 752,830 · +37.4%
- By 2075
- 955,069 · +74.3%
- By 2100
- 1,115,436 · +103.5%
Race, ethnicity, and origin ACS 2023
- Neighborhood character
- Majority White (65%)
- Race & ethnicity
- White 65% Black 14% Asian 9% Hispanic / Latino 8% Two or more races 7%
- Hispanic origin (detail)
- Mexican 6%
- Common ancestry
- Ukrainian 3% Iranian 3% Italian 2%
- Foreign-born
- 19% · Canada, Philippines, Vietnam
- Languages at home
- 77% English-only · Other Asian/Pacific 6% Spanish 6% Russian/Polish/Slavic 3%
Political lean MEDSL · Polk
- 2024 margin
- D (+10.9) · D 54.8% · R 43.9% · Other 1.3%
- 2008→2024 swing
- -3.7pp toward R · 2008: 14.6pp · 2024: 10.9pp
- All cycles
- 2024: D+10.9 2020: D+15.2 2016: D+11.5 2012: D+14.2 2008: D+14.6
Not yet ingested
- Civics
- —
Market trends
- HPI YoY
- ▼ -197.92%
- Current HPI
- 248.07
- Rent YoY
- ▲ 3.74%
- Metro
- Des Moines-West Des Moines, IA
- State GDP YoY
- ▲ 2.48%
- F500 in state
- 4
Industry mix (Fortune 500 HQ in IA)
| Industry | F500 HQs | Revenue |
|---|---|---|
| Financial Services | 1 | $16B |
|
||
| Retail / Convenience | 1 | $15B |
|
||
Price history
+43.4% since first listed7 events — show timeline
- 2026-06-05 Sold (Public Records) $190,000 Public Records
- 2026-06-03 Sold (MLS) $190,000 CIBOR
- 2026-05-05 Pending — CIBOR
- 2026-04-30 Listed $165,000 CIBOR
- 2026-04-27 Listing Removed — DMMLS
- 2026-04-27 Listed $165,000 DMMLS
- 2006-09-08 Sold (Public Records) $132,500 Public Records
Property tax history
+2.1%/yrLatest (2025): $4,368 · +2.1% YoY. Source: county tax records.
Cash-flow waterfall
monthlySold comps — $/sqft
last 12 mo · ≤1 miLoading sold comps…