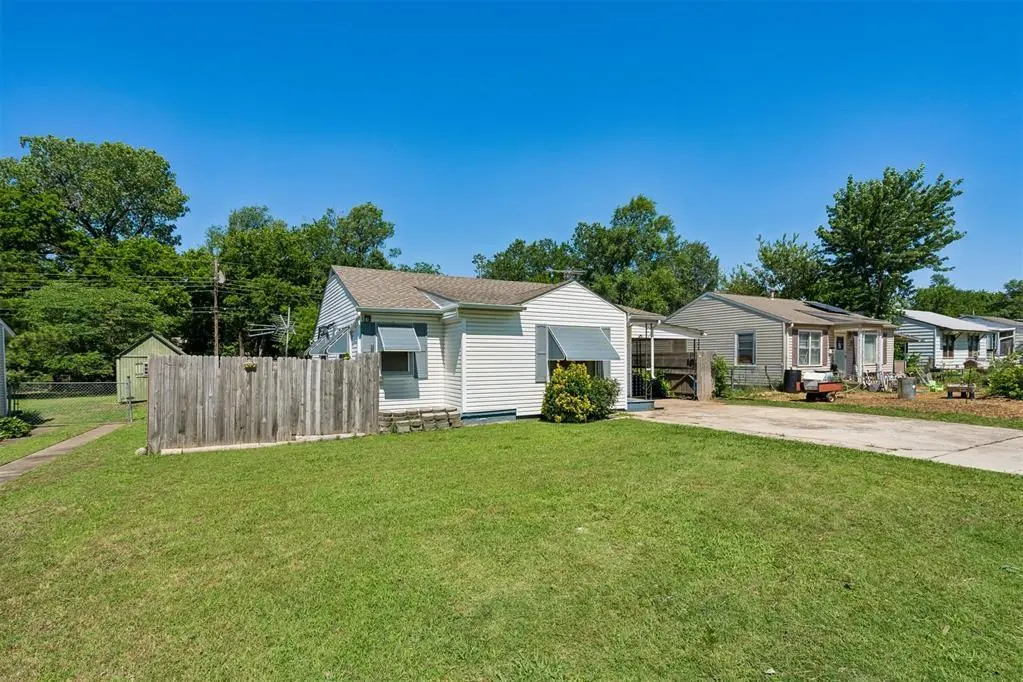
626 Rancho Dr · Norman, OK
Flood risk 1/10 · Minimal
- FEMA flood zone
- X (unshaded)
- Chance of flooding over 30 yrs
- 0.0%
- Est. flood insurance / yr
- $507 – $1,088
Fire risk 4/10 · Minor
- Est. fire insurance / yr
- $2,463 – $4,575
Heat risk 6/10 · Moderate
- Hot days now (above 108°F)
- 7 days/yr
- Hot days in 30 yrs
- 19 days/yr
Wind risk 2/10 · Minimal
- Chance of severe wind over 30 yrs
- 4.0%
Air-quality risk 2/10 · Minimal
- Unhealthy air days now
- 1 days/yr
- Unhealthy air days in 30 yrs
- 1 days/yr
Risk factors via First Street. Map © Google.
Why this score? — see what drove the B- grade
The composite is a weighted blend of 9 inputs, each scored 0–100. Each bar is that input's sub-score; the figure is the points it added to the 100-point composite (weight × sub-score).
- Cash flow +25.2/30.0
- ARV discount +14.5/15.0
- DSCR +8.3/10.0
- 1% rule +5.3/10.0
- Livability +4.2/5.0
- Rent growth +3.2/5.0
- Schools +2.6/10.0
- Condition / age +2.5/5.0
- Appreciation +0.0/10.0
$99,900
🖨 Deal sheet 📄 Offer letter ✓ Due diligence
Listing remarks
LOADS of POTENTIAL in this Charming little bungalow, walking distance to shops and restaurants, AND just a few minutes to the University! Original & refinished wood floors. Large backyard with storm shelter and shed/shop. Large carport and double wide concrete driveway. Sellers installed 4 mini-splits a few years ago--CHA still worked at that time but hasn't been used since. Needs a little work to be perfect but priced accordingly and for a quick sale! Seller prefers as-is offers and will not be able to make any repairs.
Key facts
- Large backyard
- Storm shelter
- Large carport
Tags
Property features AI
Finance
- Other: Vacant and available; Located in the Hanly addition
- Financial info: Sold as-is; acceptable financing: Cash or Conventional; Not assumable
- HOA & community: No mandatory association dues
Exterior
- Parking: Concrete parking; 1-car garage
- Utilities: Public utilities; Below-ground/outdoor storm shelter
- Home design: Single-family residence; One level; Faces east; Residential property
- Construction: Frame construction with vinyl siding; Composition roof (replaced/updated 2023); Conventional foundation; Existing property
- Exterior features: Open patio; Outbuilding(s); Combination fencing; Interior lot
Interior
- Kitchen: Freestanding gas range and oven
- Bedrooms: 2 bedrooms
- Flooring: Wood; Combination
- Bathrooms: 1 full bathroom
- Heating & cooling: Zoned heating; Zoned cooling
- Interior features: Dishwasher; Garbage disposal; Combination of flooring types; Wood flooring
Neighborhood map
What this means for you Summary
Snapshot
- This is a 2-bed/1.0-bath single-family listed at $100k.
Deal economics
- At list price, monthly cash flow is $223 ($3k/yr) — positive.
- The deal already cash-flows at list — no discount required.
- Meets the 1% rule at list price ($1k rent vs $100k).
- Cap rate 9.0% vs local median 3.6% in Norman — top-decile yield for the area; either an underpriced asset or a hidden risk that comps aren't pricing in. Stress-test before assuming the spread holds.
Location & tenants
- Location reads 85/100 on livability (#1 in OK, #557 nationally) — a professional / high-income tenant draw. Strengths: amenities A+, commute A+, cost of living A+.
- Norman (suburban): math 27% / reading 32% proficiency, ranked #61 of 270 in OK (top 23%) — low school quality limits family demand, transient renter base, plan for 1-2y turnover.
- Zoned schools: Lincoln Es (math 42% / reading 37%, grade F, #107 of 845 statewide, top 14%, 283 students, 0% FRL); Norman Hs (math 27% / reading 44%, grade F, #46 of 447 statewide, top 10%, 2,137 students, 0% FRL) — zoned schools average 0% FRL vs 39% district-wide (39 pts lower); this property's tenant base skews higher-income than the district average.
- Market conditions: Rents rising (+2.8%/yr); 350 active listings in the ZIP; 21 comparable units currently listed for rent nearby; rentals at typical pace (median 14d on market — plan ~3-4 weeks tenant-placement turnaround); 592 units permitted in Cleveland County in 2024 (12 in 5+ unit buildings).
Forward outlook
- Local home prices are declining (-3.0%/yr); year-one equity from $691 of loan paydown is wiped out by about $3k of value loss. Plan a longer hold.
- Cleveland County population projected at +40% by 2050 — long-run rental-demand tailwind backs the buy-and-hold thesis.
Negotiation context
- Only 1 days on market — expect competitive offers; lowballing is unlikely to land.
- Current owner paid $36k; list at $100k implies a 174% gain — meaningful room to come down on a strong offer.
Risks & watch-outs
- Watch-outs: built in 1952 — expect roof / HVAC / electrical / plumbing capex.
- Climate carrying-cost: extreme-heat days projected 7→19/yr by 2055 (HVAC capex compounding) — expect insurance premiums to compound above CPI over the hold.
Questions for the listing agent
- Built in 1952 — when were the roof, HVAC, electrical panel, plumbing, and water heater last replaced?
- Is there a deadline driving the sale (1031 exchange, divorce, estate, relocation)? That informs how much negotiation room exists.
- What's the average days-on-market for RENTAL listings here right now (not sales)? A rising rental-DOM trend means longer vacancies and softer asking-rent achievability than the comps imply.
- What's the recent tenant-quality profile in this submarket — average credit score on applications, eviction rate, late-payment / NSF rate, and stable-employment percentage? A property-management company in the area should have these aggregated.
- How much new for-sale + rental construction is in the pipeline within 1–3 miles? Heavy new supply typically softens prices + rents 12–24 months out; constrained supply supports both.
Investment metrics
- 1% rule
- 1.03% ✓
- Cap rate
- 8.98%
- Cash-on-cash
- 9.59%
- DSCR
- 1.43
- GRM
- 8.1
CMA / ARV
- ARV (on-the-fly)
- $118,400
- Comps found
- 10
Show comp detail 10 sales within ~0.75 mi
| Address | Dist | Beds/Ba | Sqft | Sold | Price | $/sf | Match |
|---|---|---|---|---|---|---|---|
| 418 S Stewart Ave | 0.47mi | 2/1.0 | 750 (+1%) | 8mo | $159,900 | $213 | 69 |
| 320 S Cook Ave | 0.48mi | 2/1.0 | 720 (-3%) | 6mo | $115,000 | $160 | 68 |
| 629 Tollie Dr | 0.08mi | 2/1.0 | 840 (+14%) | 8mo | $140,000 | $167 | 67 |
| 1505 Morland Ave | 0.51mi | 2/1.0 | 721 (-3%) | 13mo | $95,000 | $132 | 61 |
| 401 SE 12th St #217 | 0.34mi | 1/1.0 (-1) | 756 (+2%) | 23mo | $60,000 | $79 | 57 |
| 517 E Linn St | 0.46mi | 2/1.0 | 776 (+5%) | 17mo | $135,000 | $174 | 56 |
| 914 E Eufaula | 0.48mi | 2/1.0 | 648 (-12%) | 6mo | $116,000 | $179 | 52 |
| 408 S Cook Ave | 0.42mi | 2/1.0 | 800 (+8%) | 22mo | $99,000 | $124 | 49 |
| 433 E Apache St | 0.55mi | 1/1.0 (-1) | 644 (-13%) | 8mo | $90,000 | $140 | 41 |
| 1028 E Main St | 0.64mi | 2/2.0 | 786 (+6%) | 20mo | $87,000 | $111 | 39 |
Match score weights: distance 35% · size 25% · config 20% · recency 20%. Top-matched comps best support the ARV.
Projected returns pro-forma
-3.0% appreciation · 2.8% rent growth · sell at horizon
- IRR
- -2.1%
- Equity multiple
- 0.92×
- Total profit
- $-2,208
- Equity at exit
- $14,895
- IRR
- 7.4%
- Equity multiple
- 1.55×
- Total profit
- $15,369
- Equity at exit
- $8,638
Cash invested: $27,972 (down + closing). Projections, not guarantees.
Landlord ↔ Tenant lean methodology
- Overall (STATE)
- 83 Strongly Landlord-Friendly
- State Oklahoma
- 83 Strongly Landlord-Friendly · R+20
- County
- — inherits STATE
- City
- — inherits STATE
ZIP-level market 73071
- Rents YoY
- 2.8%
- Active inventory
- 350
- Price-to-rent
- 8.1×
Monthly cashflow live
- Estimated rent
- $1,027 high interval (Pro) →
- Mortgage (P&I)
- −$524
- Tax from tax record
- −$22 /mo · $265/yr
- Insurance
- −$42
- HOA
- −$0
- Vacancy / Maint / Mgmt
- −$216
- Net cashflow
- $223
Break-even live
UW: 25.0% down · 7.5% · 30yr · 1.5% tax · 5.0% vac · 8.0% maint · 8.0% mgmt
Financing live
Cash to close
- Down payment
- $24,975
- Closing costs
- $2,997
- Reserves months
- —
- Total cash needed
- —
Loan-product check · same deal, 3 products live
Conventional
25% down · 7.5% · 30yr
- Down + closing
- —
- Monthly P&I
- —
- Monthly cashflow
- —
- DSCR
- —
- Eligible?
- —
Personal DTI + credit; lowest rate.
DSCR
20% down · 8.5% · 30yr
- Down + closing
- —
- Monthly P&I
- —
- Monthly cashflow
- —
- DSCR
- —
- Eligible?
- —
No personal income docs; deal must DSCR.
Hard money
10% down · 12.0% · 12mo
- Down + closing
- —
- Monthly P&I
- —
- Monthly cashflow
- —
- DSCR
- —
- Eligible?
- —
Short-term bridge; refi at stabilization.
Rent comps 21 comps
| Address | Beds | Baths | Sqft | Rent | $/sqft | DOM | Units | Dist |
|---|---|---|---|---|---|---|---|---|
| 1616 Alameda St Norman, OK | 1.0–2.0 | 1.0–1.5 | 975 | $980 | $1.01 | 23d | 8 | 0.54mi |
| 1149 W Brooks St Norman, OK | 1.0–4.0 | 1.0–2.0 | 1025 | $1,053 | $1.03 | 1d | 7 | 0.61mi |
| 1106 Arkansas St Norman, OK | 1.0 | 1.0 | 568 | $725 | $1.28 | 23d | 1 | 0.64mi |
| 2023 Delaware Ln Norman, OK | 2.0 | 1.0 | 720 | $1,000 | $1.39 | 23d | 1 | 0.79mi |
| 819 E Lindsey St Norman, OK | 2.0 | 1.0 | 700 | $850 | $1.21 | 1d | 1 | 0.83mi |
| 1744 Classen Blvd Unit 2 Norman, OK | 1.0 | 1.0 | 550 | $750 | $1.36 | 3d | 1 | 0.85mi |
| 746 S Jenkins Ave Unit 1/2 Norman, OK | 1.0 | 1.0 | 500 | $825 | $1.65 | 14d | 1 | 0.86mi |
| 1115 Biloxi Dr Norman, OK | 1.0–2.0 | 1.0 | 818 | $909 | $1.11 | 11d | 3 | 0.89mi |
| 430 E Tonhawa St Norman, OK | 1.0 | 1.0 | 600 | $875 | $1.46 | 19d | 1 | 0.91mi |
| 430 E Tonhawa St Norman, OK | 1.0 | 1.0 | 600 | $875 | $1.46 | 23d | 1 | 0.91mi |
| 203 E Brooks St Norman, OK | 1.0 | 1.0 | 605 | $1,000 | $1.65 | 23d | 1 | 0.92mi |
| 602 Tiffin Ave Norman, OK | 2.0 | 1.0 | 720 | $1,249 | $1.73 | 10d | 1 | 0.96mi |
| 1502 E Lindsey St Norman, OK | 1.0–2.0 | 1.0–2.0 | 755 | $989 | $1.31 | 2d | 1 | 1.07mi |
| 217 E Daws St Unit B Norman, OK | 1.0 | 1.0 | 650 | $900 | $1.38 | 23d | 1 | 1.09mi |
| 222 S University Blvd Unit 2 Norman, OK | 2.0 | 2.0 | 685 | $2,055 | $3.00 | 14d | 1 | 1.15mi |
| 222 S University Blvd Norman, OK | 1.0 | 1.0 | 695 | $2,275 | $3.27 | 23d | 1 | 1.15mi |
| 213 Farmer St Unit 213 Norman, OK | 2.0 | 1.0 | 700 | $1,500 | $2.14 | 3d | 1 | 1.17mi |
| 420 W Comanche St Norman, OK | 1.0 | 1.0 | 580 | $1,200 | $2.07 | 14d | 1 | 1.20mi |
| 500 Stinson St Norman, OK | 2.0 | 1.0 | 696 | $1,000 | $1.44 | 23d | 1 | 1.23mi |
| 303 E Himes St Unit 2 Norman, OK | 2.0 | 1.0 | 671 | $1,045 | $1.56 | 23d | 1 | 1.34mi |
| 127 W Acres St Apt E Norman, OK | 1.0 | 1.0 | 710 | $850 | $1.20 | 3d | 1 | 1.41mi |
Listing history 2 events
-
2026-06-18remarks 528-char remark
-
2026-06-18$99,900 Active 1 DOM
ⓘ Source: listings_history table (triggers on properties + properties_extension) + one-shot
backfill from property_details.listing_events for pre-trigger history.
Tax reassessment forecast OK · Resets to sale price
- Current annual tax
- $265 · $22/mo
- Projected year-2 tax
- $899 · $75/mo
- Expected delta
- +$634/yr (+$53/mo · 239.3%)
ⓘ Screening estimate from a state-policy table — verify with the county assessor before closing.
Climate risk First Street
- Flood 1/10 Low FEMA zone X (unshaded) · 0% chance over 30 yrs
- Wildfire 4/10 Moderate
- Heat 6/10 Major 7 d/yr ≥108°F today · 19 d/yr by 30 yrs out
- Wind 2/10 Low 4% chance of damaging wind over 30 yrs
- Air quality 2/10 Low 1 unhealthy d/yr today · 1 by 30 yrs out
Nearby sold comps map
Loading sold comps map…
Walkable amenities ~0.75 mi
Loading nearby amenities…
Taxation est. · year 1
- Rental income
- $12,320
- − Mortgage interest
- −$5,596
- − Property taxes
- −$265
- − Insurance
- −$500
- − Repairs & maintenance
- −$986
- − Management
- −$986
- − Depreciation
- −$2,906
- Taxable income
- $1,082
- Est. tax owed @ 24.0%
- −$260
- After-tax cash flow
- $2,422/yr
For passive investors: Depreciation is non-cash, so a rental often shows a tax loss while cash-flowing — sheltering income. Rental losses are passive: they offset passive income freely, and up to $25,000/yr can offset ordinary (W-2) income if you actively participate and your MAGI is under $100k (phasing out to $0 by $150k); unused losses carry forward. On sale, claimed depreciation is recaptured at up to 25%, and gains may owe capital-gains tax (a 1031 exchange can defer both). Figures are a year-1 estimate at your 24.0% rate — not tax advice; consult a CPA.
Schools (NCES district)
- District
- Norman
- NCES district ID
- 4021720
- Math proficiency
- 27% ▼ -9.00%
- Reading proficiency
- 32% ▼ -8.00%
- Median HH income
- $48,940
- Composite
- 25.67/100
- National rank
- #7395
- State rank
- #61 of 270 in OK
Livability — Norman
- Score
- 85/100
- State rank
- #1
- US rank
- #557
Category grades
Schools grade is shown separately in the Schools card above.
Census & demographics
- Census place
- Norman, OK
- County
- Cleveland County · 239,547 people
- City population
- 123,141
- Metro
- Oklahoma City, OK
- Population (ZIP)
- 43,798
- Household income
- $64,007
- Rent vs Own
- Severe rent burden
- 1903.0
Population outlook (Cleveland County) Hauer SSP2
- Today (2025)
- 323,621 people
- By 2030
- 349,070 · +7.9%
- By 2040
- 400,168 · +23.7%
- By 2050
- 454,101 · +40.3%
- By 2075
- 602,926 · +86.3%
- By 2100
- 734,485 · +127.0%
Race, ethnicity, and origin ACS 2023
- Neighborhood character
- Predominantly White (68%)
- Race & ethnicity
- White 68% Two or more races 12% Black 8% Hispanic / Latino 8% Asian 3% Native American 3%
- Hispanic origin (detail)
- Mexican 5%
- Common ancestry
- Italian 3% Serbian 3% Lithuanian 2%
- Foreign-born
- 7% · Canada, China
- Languages at home
- 89% English-only · Spanish 5% Other Indo-European 1% Chinese 1%
Political lean MEDSL · Cleveland
- 2024 margin
- R (+14.9) · D 41.4% · R 56.4% · Other 2.2%
- 2008→2024 swing
- +9.1pp toward D · 2008: -24.0pp · 2024: -14.9pp
- All cycles
- 2024: R+14.9 2020: R+14.1 2016: R+21.7 2012: R+25.9 2008: R+24.0
Not yet ingested
- Civics
- —
Market trends
- HPI YoY
- ▼ -187.04%
- Current HPI
- 249.3797
- Rent YoY
- ▲ 2.80%
- Metro
- Oklahoma City, OK
- State GDP YoY
- ▲ 1.55%
- F500 in state
- 6
Industry mix (Fortune 500 HQ in OK)
| Industry | F500 HQs | Revenue |
|---|---|---|
| Energy | 3 | $48B |
|
||
Price history
+173.7% since first listed2 events — show timeline
- 2026-06-18 Listed $99,900 MLSOK
- 1984-01-01 Sold (Public Records) $36,500 Public Records
Property tax history
+0.2%/yrLatest (2024): $265 · -0.4% YoY. Source: county tax records.
Cash-flow waterfall
monthlySold comps — $/sqft
last 12 mo · ≤1 miLoading sold comps…