320 Riverview Dr · Adairville, KY
Flood risk 4/10 · Minor
- FEMA flood zone
- A
- Chance of flooding over 30 yrs
- 0.24%
- Est. flood insurance / yr
- $1,009 – $1,996
Fire risk 1/10 · Minimal
- Est. fire insurance / yr
- $839 – $1,559
Heat risk 5/10 · Moderate
- Hot days now (above 107°F)
- 7 days/yr
- Hot days in 30 yrs
- 20 days/yr
Wind risk 4/10 · Minor
- Chance of severe wind over 30 yrs
- 9.0%
Air-quality risk 1/10 · Minimal
- Unhealthy air days now
- 0 days/yr
- Unhealthy air days in 30 yrs
- 0 days/yr
Risk factors via First Street. Map © Google.
Why this score? — see what drove the B grade
The composite is a weighted blend of 9 inputs, each scored 0–100. Each bar is that input's sub-score; the figure is the points it added to the 100-point composite (weight × sub-score).
- Cash flow +30.0/30.0
- 1% rule +10.0/10.0
- DSCR +10.0/10.0
- ARV discount +7.5/15.0
- Appreciation +4.6/10.0
- Schools +3.3/10.0
- Livability +3.1/5.0
- Rent growth +2.5/5.0
- Condition / age +2.5/5.0
$54,900
🖨 Deal sheet (PDF) 📄 Offer letter ✓ Due diligence
Listing remarks
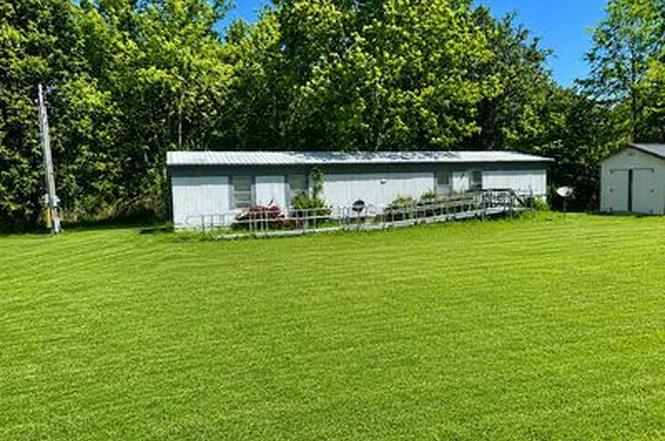
1.56 acres in a peaceful rural setting with an existing manufactured home and utilities already in place. The home offers potential for renovation and improvement, making it an excellent opportunity for investors, handyman buyers, or anyone looking for an affordable country property. The 1.56 acre lot provides plenty of space for gardening, recreation, storage, or future improvements. Manufactured home conveys AS-IS * * * * BONUS OPPORTUNITY the adjoining property is for sale by the same owner. Conveniently located near Adairville while offering the privacy and space of country living, Don& apos; t miss this opportunity to own acreage with an existing residence at an affordable pric
Key facts
- 1.56 acres
- Space for gardening
- Space for recreation
Tags
Neighborhood map
What this means for you Summary
Snapshot
- This is a 2-bed/2.0-bath other listed at $55k.
Deal economics
- At list price, monthly cash flow is $220 ($3k/yr) — positive.
- The deal already cash-flows at list — no discount required.
- Meets the 1% rule at list price ($855 rent vs $55k).
Location & tenants
- Location reads 62/100 on livability (#353 in KY) — a middle-class / working-renter tenant base. Strengths: crime A+, cost of living A+, housing A+; Watch: amenities F, commute F, employment F.
- Logan County (rural): math 35% / reading 44% proficiency, ranked #32 of 165 in KY (top 19%) — families likely to look elsewhere, expect single-tenant / working-renter base with shorter leases.
- Zoned schools: Adairville Elementary School (math 35% / reading 34%, grade F, #301 of 676 statewide, top 48%, 351 students, 52% FRL); Logan County High School (math 32% / reading 54%, grade F, #30 of 254 statewide, top 12%, 953 students, 47% FRL) — zoned schools at 50% FRL track the district average.
- Market conditions: 8 active listings in the ZIP; 30 units permitted in Logan County in 2024 (0 in 5+ unit buildings).
Forward outlook
- Local home prices are declining (-0.7%/yr); year-one equity from $380 of loan paydown is wiped out by about $404 of value loss. Plan a longer hold.
- Logan County population projected at -13% by 2050 — secular population decline; favor cash flow + early exit over multi-decade hold.
- At projected returns (-0.7% appreciation + 3.0% rent growth), your $15k cash investment doubles in ~5 years — after that, you're playing with house money.
Negotiation context
- Only 6 days on market — expect competitive offers; lowballing is unlikely to land.
- Current owner paid $8k; list at $55k implies a 586% gain — meaningful room to come down on a strong offer.
Risks & watch-outs
- Watch-outs: flood insurance adds $125/mo.
- Climate carrying-cost: in FEMA flood zone A (mandatory federal flood insurance); extreme-heat days projected 7→20/yr by 2055 (HVAC capex compounding) — expect insurance premiums to compound above CPI over the hold.
Questions for the listing agent
- What's the actual annual flood-insurance premium (NFIP or private), and is the property in a SFHA with mandatory coverage?
- Is there a deadline driving the sale (1031 exchange, divorce, estate, relocation)? That informs how much negotiation room exists.
- Schools are D-rated, which usually means shorter tenancies and higher turnover. Who's the typical renter profile here, and what's been the actual vacancy rate?
- What's the average days-on-market for RENTAL listings here right now (not sales)? A rising rental-DOM trend means longer vacancies and softer asking-rent achievability than the comps imply.
- What's the recent tenant-quality profile in this submarket — average credit score on applications, eviction rate, late-payment / NSF rate, and stable-employment percentage? A property-management company in the area should have these aggregated.
- How much new for-sale + rental construction is in the pipeline within 1–3 miles? Heavy new supply typically softens prices + rents 12–24 months out; constrained supply supports both.
Investment metrics
- 1% rule
- 1.56% ✓
- Cap rate
- 13.84%
- Cash-on-cash
- 26.97%
- DSCR
- 2.20
- GRM
- 5.3
CMA / ARV
No comps found within radius.
Projected returns pro-forma
-0.74% appreciation · 3.0% rent growth · sell at horizon
- IRR
- 15.0%
- Equity multiple
- 1.69×
- Total profit
- $10,613
- Equity at exit
- $13,950
- IRR
- 20.5%
- Equity multiple
- 3.13×
- Total profit
- $32,707
- Equity at exit
- $15,253
Cash invested: $15,372 (down + closing). Projections, not guarantees.
Landlord ↔ Tenant lean methodology
- Overall (STATE)
- 83 Strongly Landlord-Friendly
- State Kentucky
- 83 Strongly Landlord-Friendly · R+16
- County
- — inherits STATE
- City
- — inherits STATE
ZIP-level market 42202
- Home prices YoY
- -0.3%
- Active inventory
- 8
- Price-to-rent
- 5.3×
Monthly cashflow live
- Estimated rent
- $855 medium interval (Pro) →
- Mortgage (P&I)
- −$288
- Tax from tax record
- −$19 /mo · $232/yr
- Insurance
- −$23
- Flood insurance flood zone
- −$125 /mo · $1,502/yr
- HOA
- −$0
- Vacancy / Maint / Mgmt
- −$180
- Net cashflow
- $220
Break-even live
Sensitivity live
| Price | -10% $251 | -5% $236 | +0% $220 | +5% $205 | +10% $189 |
|---|---|---|---|---|---|
| Rent | -10% $153 | -5% $187 | +0% $220 | +5% $254 | +10% $288 |
| Rate | -1.0pp $248 | -0.5pp $234 | base $220 | +0.5pp $206 | +1.0pp $192 |
UW: 25.0% down · 7.5% · 30yr · 1.5% tax · 5.0% vac · 8.0% maint · 8.0% mgmt
Financing live
Cash to close
- Down payment
- $13,725
- Closing costs
- $1,647
- Reserves months
- —
- Total cash needed
- —
Loan-product check · same deal, 3 products live
Conventional
25% down · 7.5% · 30yr
- Down + closing
- —
- Monthly P&I
- —
- Monthly cashflow
- —
- DSCR
- —
- Eligible?
- —
Personal DTI + credit; lowest rate.
DSCR
20% down · 8.5% · 30yr
- Down + closing
- —
- Monthly P&I
- —
- Monthly cashflow
- —
- DSCR
- —
- Eligible?
- —
No personal income docs; deal must DSCR.
Hard money
10% down · 12.0% · 12mo
- Down + closing
- —
- Monthly P&I
- —
- Monthly cashflow
- —
- DSCR
- —
- Eligible?
- —
Short-term bridge; refi at stabilization.
Listing history 5 events
-
2026-06-21days on market $54,900 Active 6 DOM
-
2026-06-18days on market $54,900 Active 3 DOM
-
2026-06-17days on market $54,900 Active 2 DOM
-
2026-06-15remarks 695-char remark
-
2026-06-15$54,900 Active 1 DOM
ⓘ Source: listings_history table (triggers on properties + properties_extension) + one-shot
backfill from property_details.listing_events for pre-trigger history.
Tax reassessment forecast KY · Resets to sale price
- Current annual tax
- $232 · $19/mo
- Projected year-2 tax
- $472 · $39/mo
- Expected delta
- +$240/yr (+$20/mo · 103.2%)
ⓘ Screening estimate from a state-policy table — verify with the county assessor before closing.
Climate risk First Street
- Flood 4/10 Moderate FEMA zone A · 24% chance over 30 yrs
- Wildfire 1/10 Low
- Heat 5/10 Major 7 d/yr ≥107°F today · 20 d/yr by 30 yrs out
- Wind 4/10 Moderate 9% chance of damaging wind over 30 yrs
- Air quality 1/10 Low 0 unhealthy d/yr today · 0 by 30 yrs out
Nearby sold comps map
Loading sold comps map…
Walkable amenities ~0.75 mi
Loading nearby amenities…
Taxation est. · year 1
- Rental income
- $10,263
- − Mortgage interest
- −$3,075
- − Property taxes
- −$232
- − Insurance
- −$1,777
- − Repairs & maintenance
- −$821
- − Management
- −$821
- − Depreciation
- −$1,597
- Taxable income
- $1,939
- Est. tax owed @ 24.0%
- −$465
- After-tax cash flow
- $2,178/yr
For passive investors: Depreciation is non-cash, so a rental often shows a tax loss while cash-flowing — sheltering income. Rental losses are passive: they offset passive income freely, and up to $25,000/yr can offset ordinary (W-2) income if you actively participate and your MAGI is under $100k (phasing out to $0 by $150k); unused losses carry forward. On sale, claimed depreciation is recaptured at up to 25%, and gains may owe capital-gains tax (a 1031 exchange can defer both). Figures are a year-1 estimate at your 24.0% rate — not tax advice; consult a CPA.
Schools (NCES district)
- District
- Logan County
- NCES district ID
- 2103540
- Math proficiency
- 35% ▼ -17.00%
- Reading proficiency
- 44% ▼ -14.00%
- Median HH income
- $42,577
- Composite
- 33.34/100
- National rank
- #5492
- State rank
- #32 of 165 in KY
Livability — Adairville
- Score
- 62/100
- State rank
- #353
- US rank
- #16752
Category grades
Schools grade is shown separately in the Schools card above.
Census & demographics
- Population (ZIP)
- 1,736
Population outlook (Logan County) Hauer SSP2
- Today (2025)
- 26,133 people
- By 2030
- 25,572 · -2.1%
- By 2040
- 24,247 · -7.2%
- By 2050
- 22,849 · -12.6%
- By 2075
- 19,587 · -25.0%
- By 2100
- 15,927 · -39.1%
Race, ethnicity, and origin ACS 2023
- Neighborhood character
- Predominantly White (75%)
- Race & ethnicity
- White 75% Black 10% Two or more races 10% Hispanic / Latino 6%
- Hispanic origin (detail)
- Mexican 3%
- Common ancestry
- Slovak 3% Romanian 3% Serbian 1%
- Foreign-born
- 1% · Canada
- Languages at home
- 96% English-only · Other Asian/Pacific 2% Spanish 2%
Political lean MEDSL · Logan
- 2024 margin
- Solid R (+55.1) · D 21.9% · R 76.9% · Other 1.2%
- 2008→2024 swing
- -26.5pp toward R · 2008: -28.6pp · 2024: -55.1pp
- All cycles
- 2024: R+55.1 2020: R+48.4 2016: R+46.1 2012: R+32.6 2008: R+28.6
Not yet ingested
- Civics
- —
Market trends
- HPI YoY
- ▼ -0.74%
- Current HPI
- 251.6318
- Rent YoY
- —
- Metro
- —
- State GDP YoY
- ▲ 1.81%
- F500 in state
- 4
Industry mix (Fortune 500 HQ in KY)
| Industry | F500 HQs | Revenue |
|---|---|---|
| Healthcare | 1 | $118B |
|
||
| Food / Beverage | 1 | $7B |
|
||
Price history
+586.2% since first listed2 events — show timeline
- 2026-06-16 Listed $54,900 FSBO.com
- 1995-08-01 Sold (Public Records) $8,000 Public Records
Property tax history
+2.2%/yrLatest (2025): $232 · +20.8% YoY. Source: county tax records.
Cash-flow waterfall
monthlySold comps — $/sqft
last 12 mo · ≤1 miLoading sold comps…